Union Bank of India — Q2 FY27 (standalone)
| Metric | Q2 FY27 | Q2 FY26 | YoY | Q1 FY27 | QoQ |
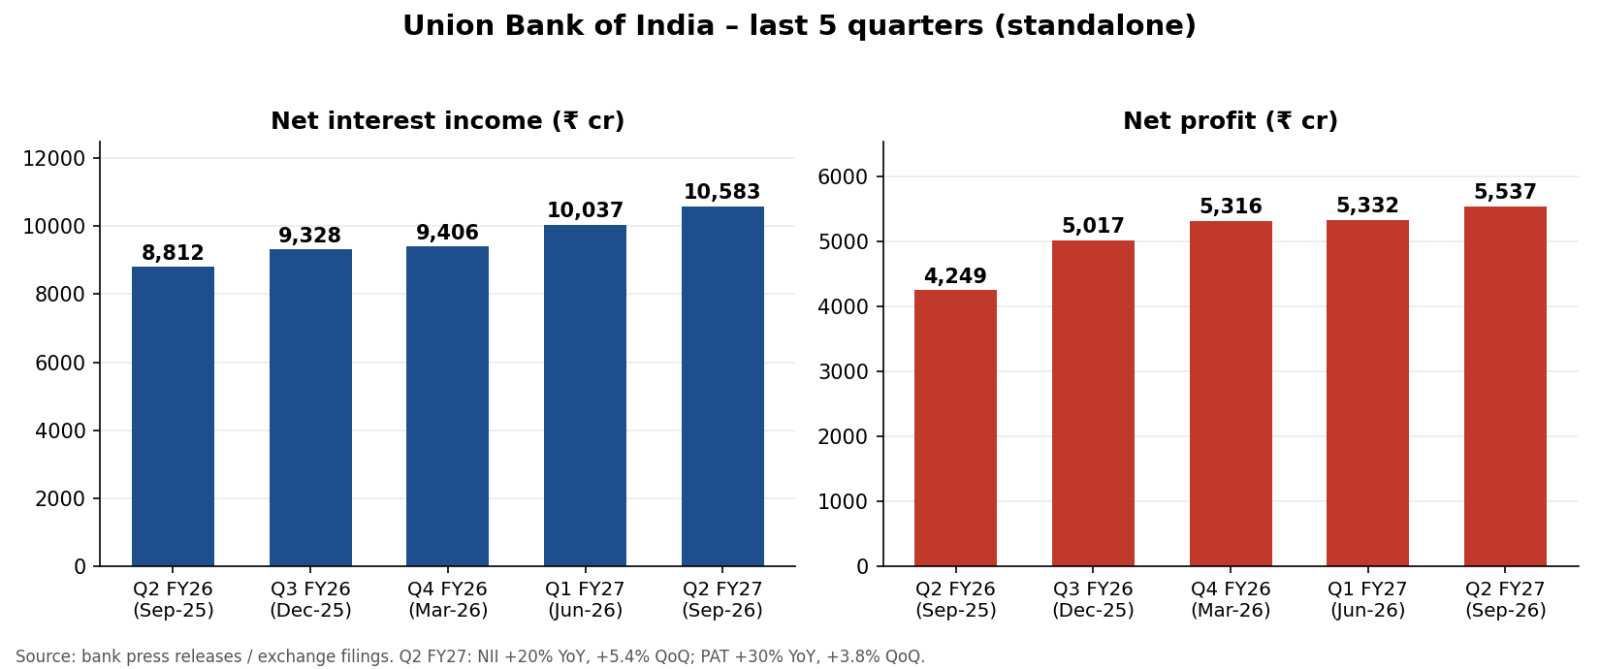
| Net interest income (₹ cr) | 10,583 | 8,812 | +20.1% | 10,037 | +5.4% |
| Operating profit (₹ cr) | 8,108 | 6,814 | +19.0% | 8,003 | +1.3% |
| Net profit (₹ cr) | 5,537 | 4,249 | +30.3% | 5,332 | +3.8% |
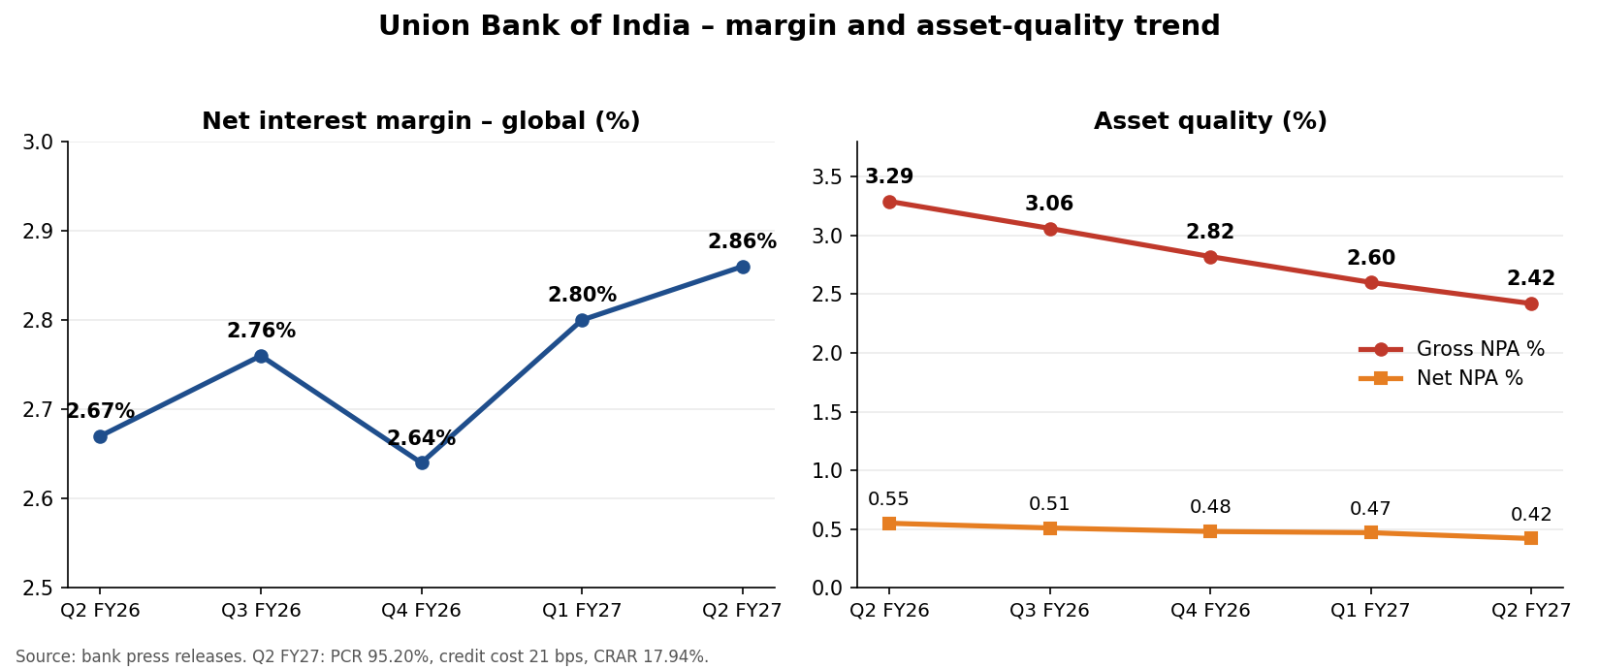
| NIM (global) | 2.86% | 2.67% | +19 bps | 2.80% | +6 bps |
| Gross NPA | 2.42% | 3.29% | −87 bps | 2.60% | −18 bps |
| Net NPA | 0.42% | 0.55% | −13 bps | 0.47% | −5 bps |
1. Core income drove the profit this quarter. NII rose 20.09% to ₹10,583 crore against ₹8,812 crore in Q2 FY26, and grew 5.43% sequentially. This is a clear change from Q4 FY26, when NII slipped 1.1% and NIM was 2.64%, down from 2.87% a year earlier. Management said the bank had improved NIM from a low of 2.64% to 2.86% without any change in the repo rate.
2. The 30% YoY growth is partly a base effect. Q2 FY26 was a soft quarter. After it, Q3 FY26 net profit jumped 18.1% QoQ to ₹5,017 crore from ₹4,249 crore, and NIM recovered from 2.67%. The QoQ profit growth of +3.8% is the more sober number to quote.
3. Operating profit lagged NII. Sequentially, NII grew 5.4% but operating profit rose only to ₹8,108 crore from ₹8,003 crore (up 1.31% QoQ), and non-interest income was ₹4,651 crore vs ₹4,603 crore in Q1. Flat other income combined with slower operating profit points to higher operating costs. It’s worth checking the opex line in the presentation before posting.
4. Asset quality is very clean. The bank reports PCR of 95.20% and credit cost contained at 21 bps. The flip side is that with credit costs this low, further profit support from lower provisions is limited. From here, earnings growth has to come from NII.
5. Funding is the key watch item. Gross advances increased 18.53% while total deposits rose 6.87%. By my rough calculation from the reported total-business figures, the credit-deposit ratio has risen from about 79% to about 88% in a year. Cost of deposits stood at 5.01%. If deposit growth doesn’t pick up, the bank will have to fund loans with more expensive money, and that would squeeze the NIM gains. Capital is not a constraint: CRAR is 17.94% and CET1 is 16.05%.
6. Returns and market reaction. RoA was 1.38% and RoE 17.21% for Q2 FY27. Shares rose as much as 5.3% intraday on Monday, October 19. This contrasts nicely with BEPL. In both cases YoY growth was flattered by a weak base, but Union Bank showed sequential improvement in its core metrics, while BEPL showed a sequential dip plus a delayed growth trigger.
Things to track next quarter: deposit growth and the CD ratio, whether NIM holds near 2.85%, opex trend, and slippages if credit growth stays near 18%.