Bottom line: The numbers reconcile, and the post's main call is right: profit growth came from other income, not lending. The math makes that point even stronger than the post does.
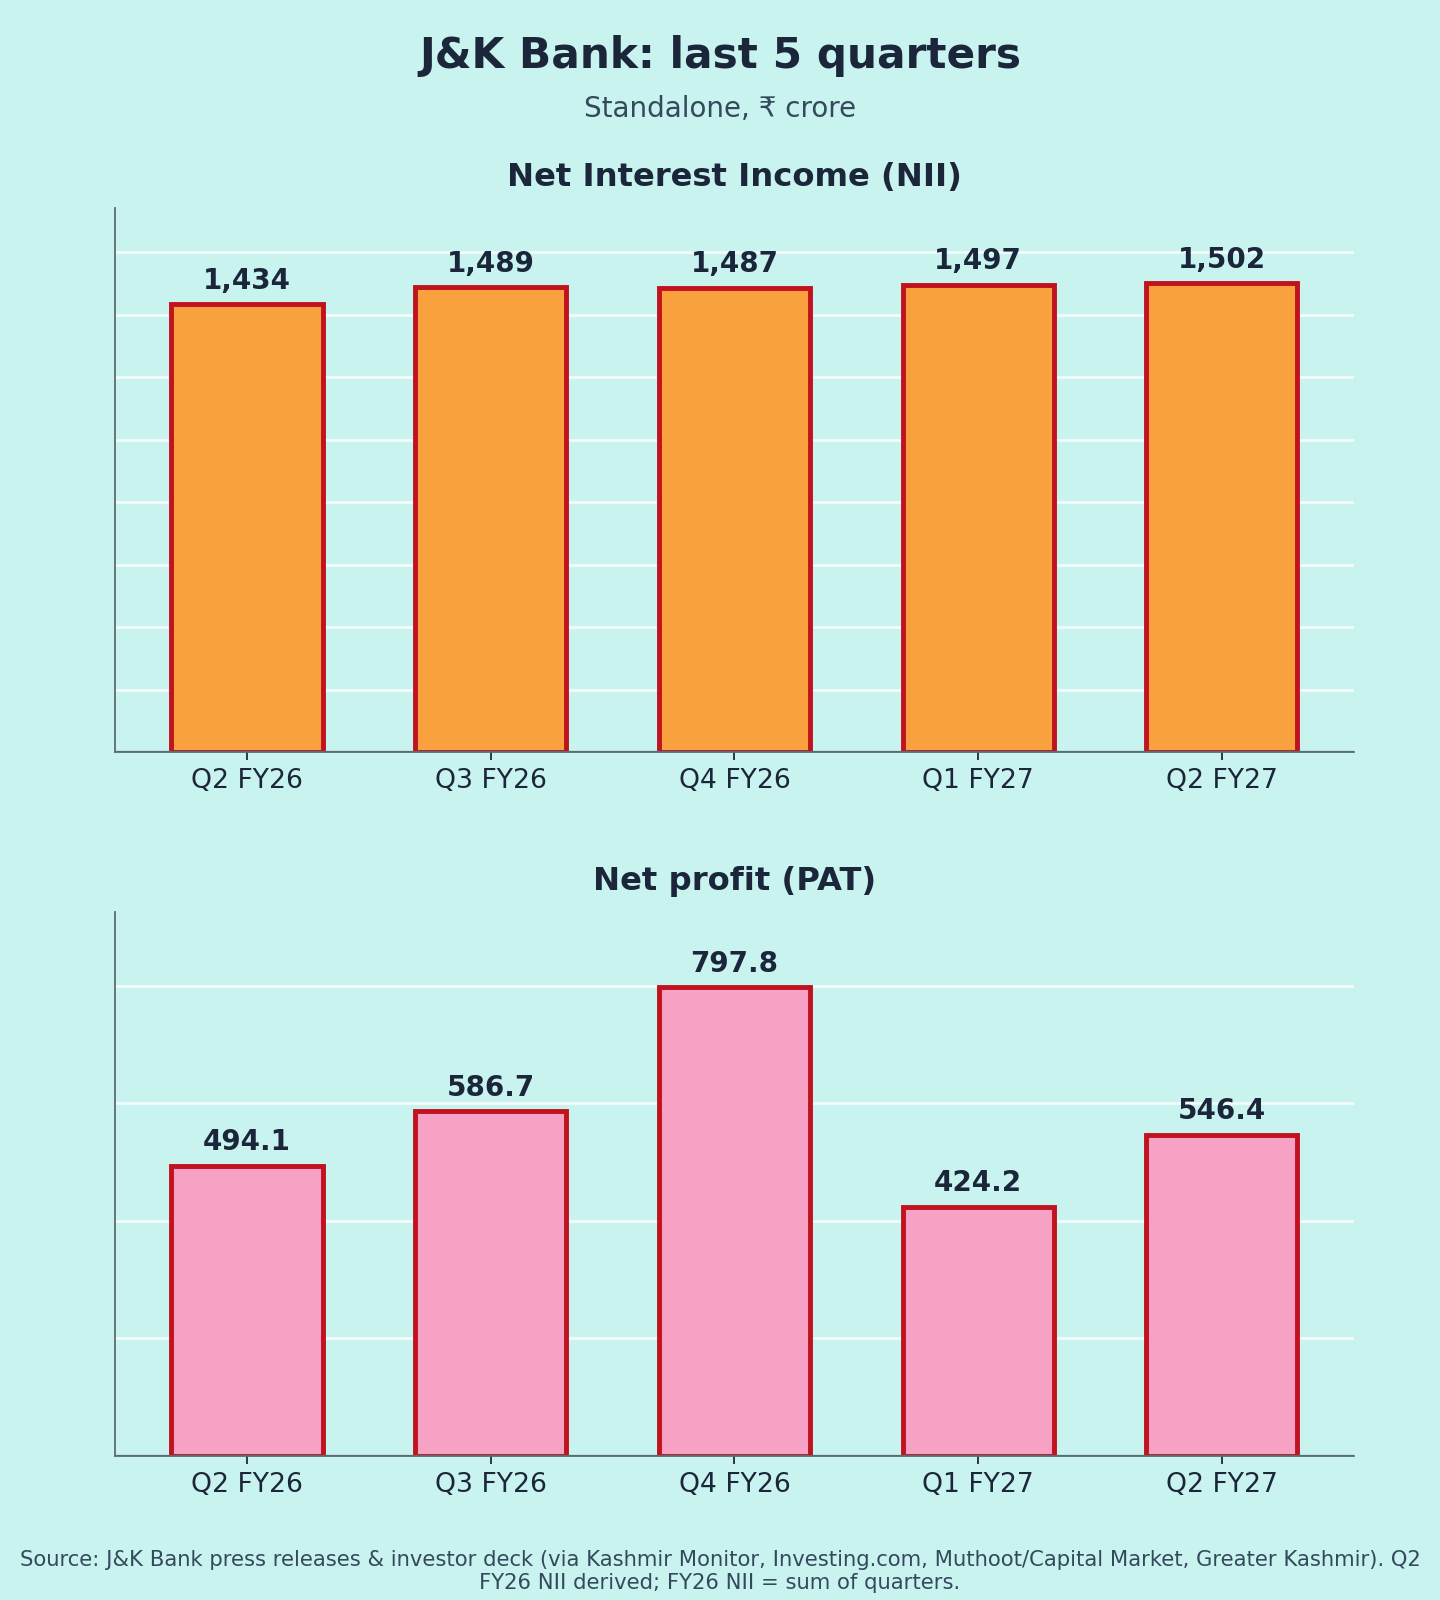
1. Operating profit growth was almost entirely other income (₹ cr)
Q2 FY26 Q2 FY27 Change
NII 1,434 1,502 +67
Other income 154 315 +161
Opex (derived) 965 1,028 +62 (+6.5%)
Operating profit 623 789 +166
Core profit (NII − opex) 469 474 +1%
Other income explains about 97% of the operating-profit increase (161 of 166). Core pre-provision profit was flat despite 24% loan growth. The derived cost-to-income ratios (56.6% vs 60.8%) match the reported ones, so these numbers hold.
2. Points the post should tighten
Claim in post Issue
"Opex +1.5% in H1" Q2 opex rose about 6.5% YoY. The H1 figure only works if Q1 opex fell.
QoQ jump "off a weak Q1" that included a ₹56 cr PSLC boost The boost made Q1 stronger, so it makes the QoQ comparison harder, not easier. The cleaner point is that H1 PAT was flat: 970 vs ~979, −0.9%.
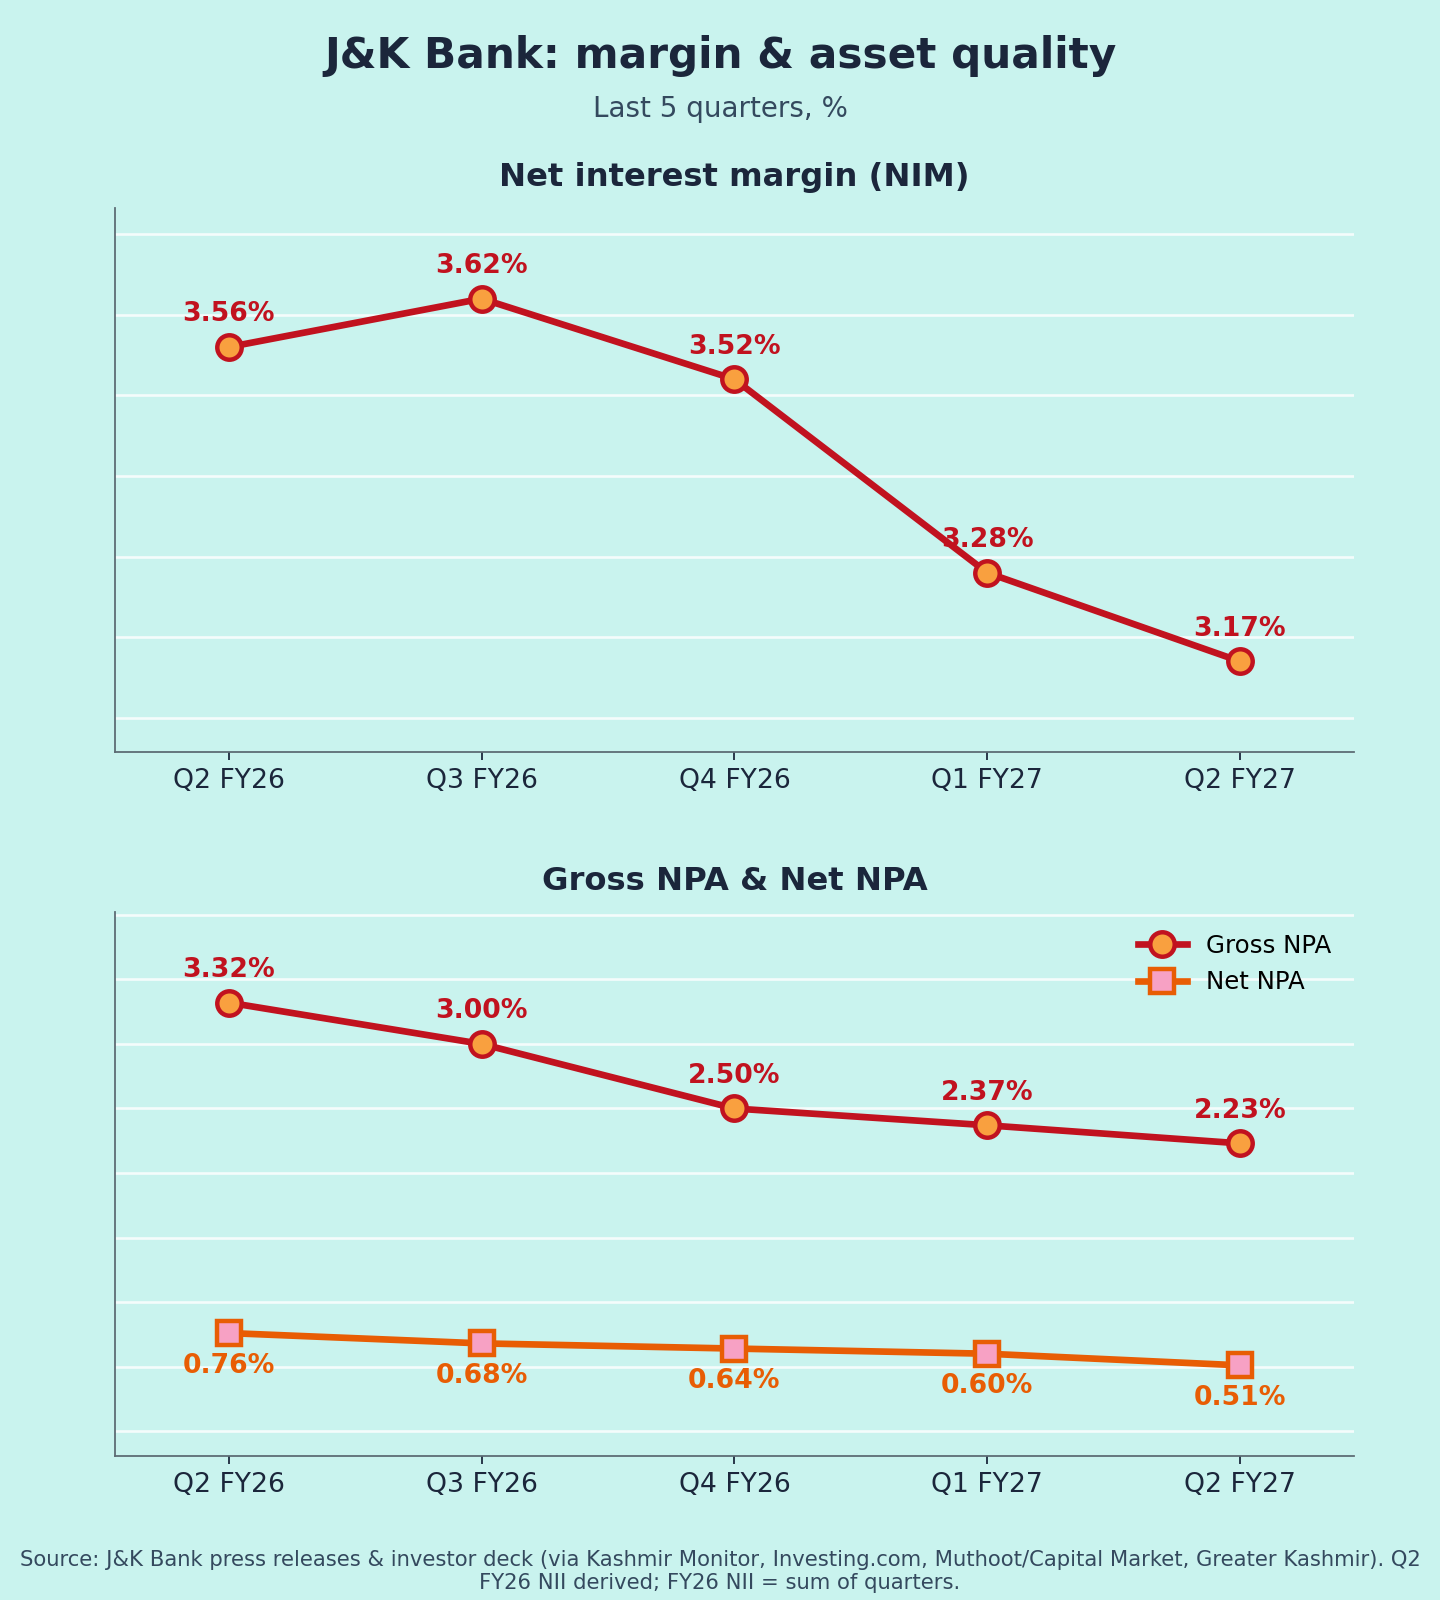
Funding costs "barely moved" Loan yield fell 65 bps but NIM fell only 39 bps, so roughly 26 bps was offset somewhere
CD ratio 74.2% Last year's 69.2% grown at the reported rates (× 1.237 ÷ 1.163) gives 73.6%. The small gap may be gross vs net advances.
3. Provisions and guidance (my estimates)
- Assuming about a 25% tax rate, Q2 provisions come to roughly ₹60 cr. That would put Q2 FY26 at about a net write-back of ~₹35 cr, which is why PAT grew only 10.6% while operating profit grew 26.7%.
- Credit guidance of 14–18% against a 23.7% running rate implies either conservative guidance or a sharp slowdown in H2.
- NII growth of 4.7% against NIM down 39 bps implies earning assets grew about 17.6% (1.047 ÷ 0.890). That's consistent with deposit growth of 16%: deposits, not loans, are setting the pace.
- Vision 2030 (₹5 lakh cr from ₹3.10 lakh cr) needs about 14.6% CAGR over 3.5 years. That's achievable only if deposits keep up, and CASA has slipped about 3.7 pp since June 2025.
My read: Asset quality is the real strength, with GNPA at 2.23% and PCR at 92%. Earnings quality is the weakness. Q3 rests on two things: the promised NIM recovery, and whether other income near ₹300 cr repeats. If either misses, PAT growth goes to roughly zero. This is analysis, not a recommendation.