J&K Bank (J&KBANK): Q2 FY27 results analysis
(Quarter ended 30 Sep 2026)
All figures standalone, ₹ crore unless stated. Results approved on 22 Oct 2026 [1]. YoY/QoQ % and the CD ratio check are my calculations from reported numbers.
| Metric | Q2 FY27 | Q2 FY26 | Q1 FY27 |
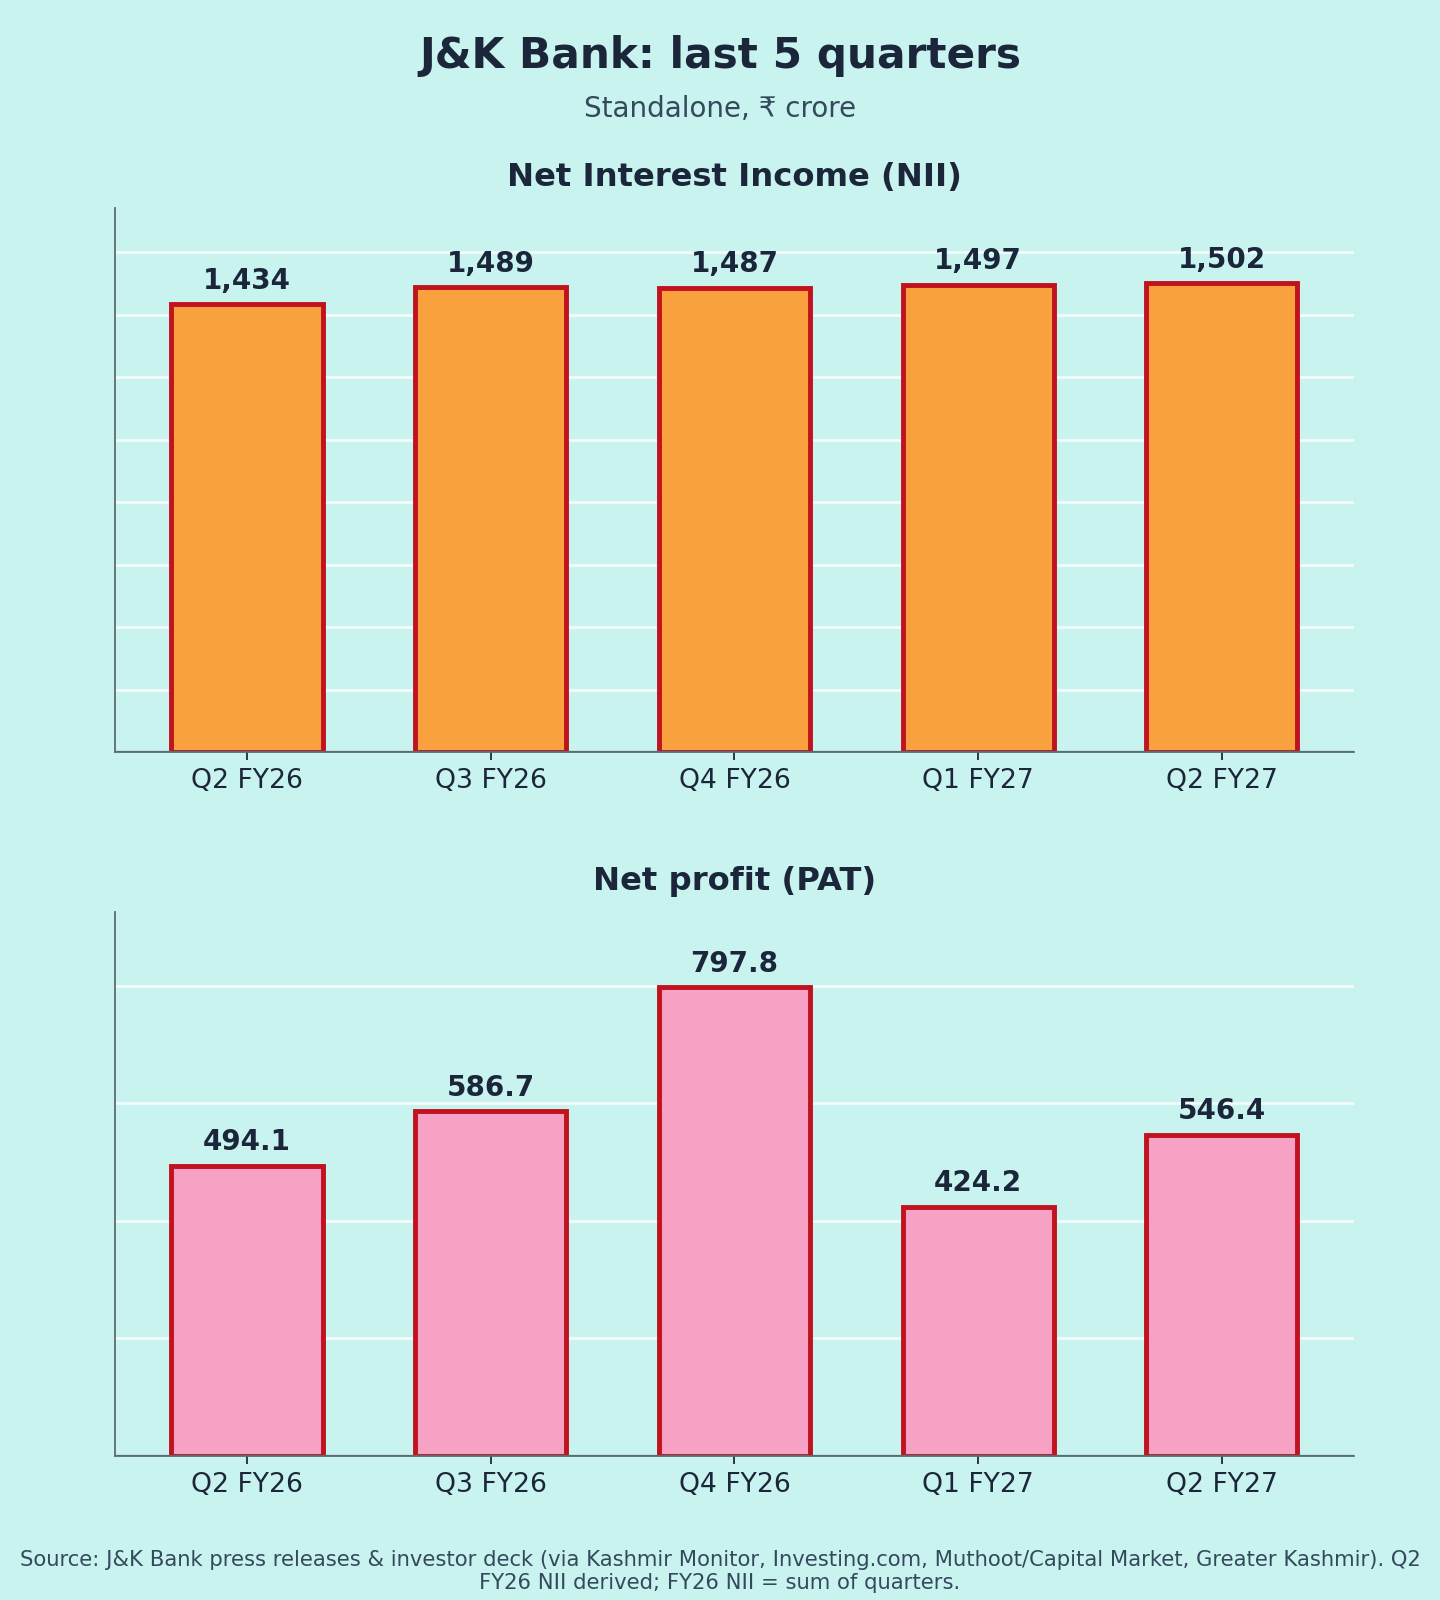
| NII | 1,502 (+4.7% YoY, +0.3% QoQ) | ~1,434 | 1,497 |
| NIM | 3.17% | 3.56% | 3.28% |
| Other income | 315 | 154 | ~214 |
| Operating profit | 789 (+26.7% YoY) | ~623 | 703 |
| PAT | 546 (+10.6% YoY, +28.8% QoQ) | 494 | 424 |
| GNPA / NNPA | 2.23% / 0.51% | 3.32% / 0.76% | 2.37% / 0.60% |
| PCR | 91.76% | – | 90.53% |
| Advances / deposits growth | +23.7% / +16.3% | – | ~+25% / +17% |
| CASA ratio | 41.97% | – | – |
| CD ratio | 74.2% | 69.2% | – |
| CRAR | 16.57% | 15.27% | – |
Sources: [1][2][3][4]. Q2 FY26 NII derived from the reported growth.
Source note: PTI/CNBC-TV18 show PAT growth as 10.5–11% [5][6]; the bank's release says 10.6% [1]. Consolidated PAT is ₹547 cr [7].
Quality of earnings
The profit growth did not come from lending income.
- NII rose only ~5% despite ~24% loan growth [1]. NIM fell 39 bps YoY to 3.17% as yield on advances dropped to 8.55% from 9.20% while funding costs barely moved [2].
- Other income doubled to ₹315 cr [1]. The release doesn't split it into treasury, recoveries or fees. Without that split, I treat part of it as less reliable (my view).
- Costs: opex was well controlled (+1.5% in H1); cost-to-income improved to 56.6% from 60.8% [1].
- Provisions: H1 PAT was flat YoY because higher provisions offset operating gains [2].
Base note: the +28.8% QoQ jump is off a weak Q1. Q1 profit fell 12.5% YoY, and even that included a ₹56 cr boost from a change in PSLC accounting [8][9].
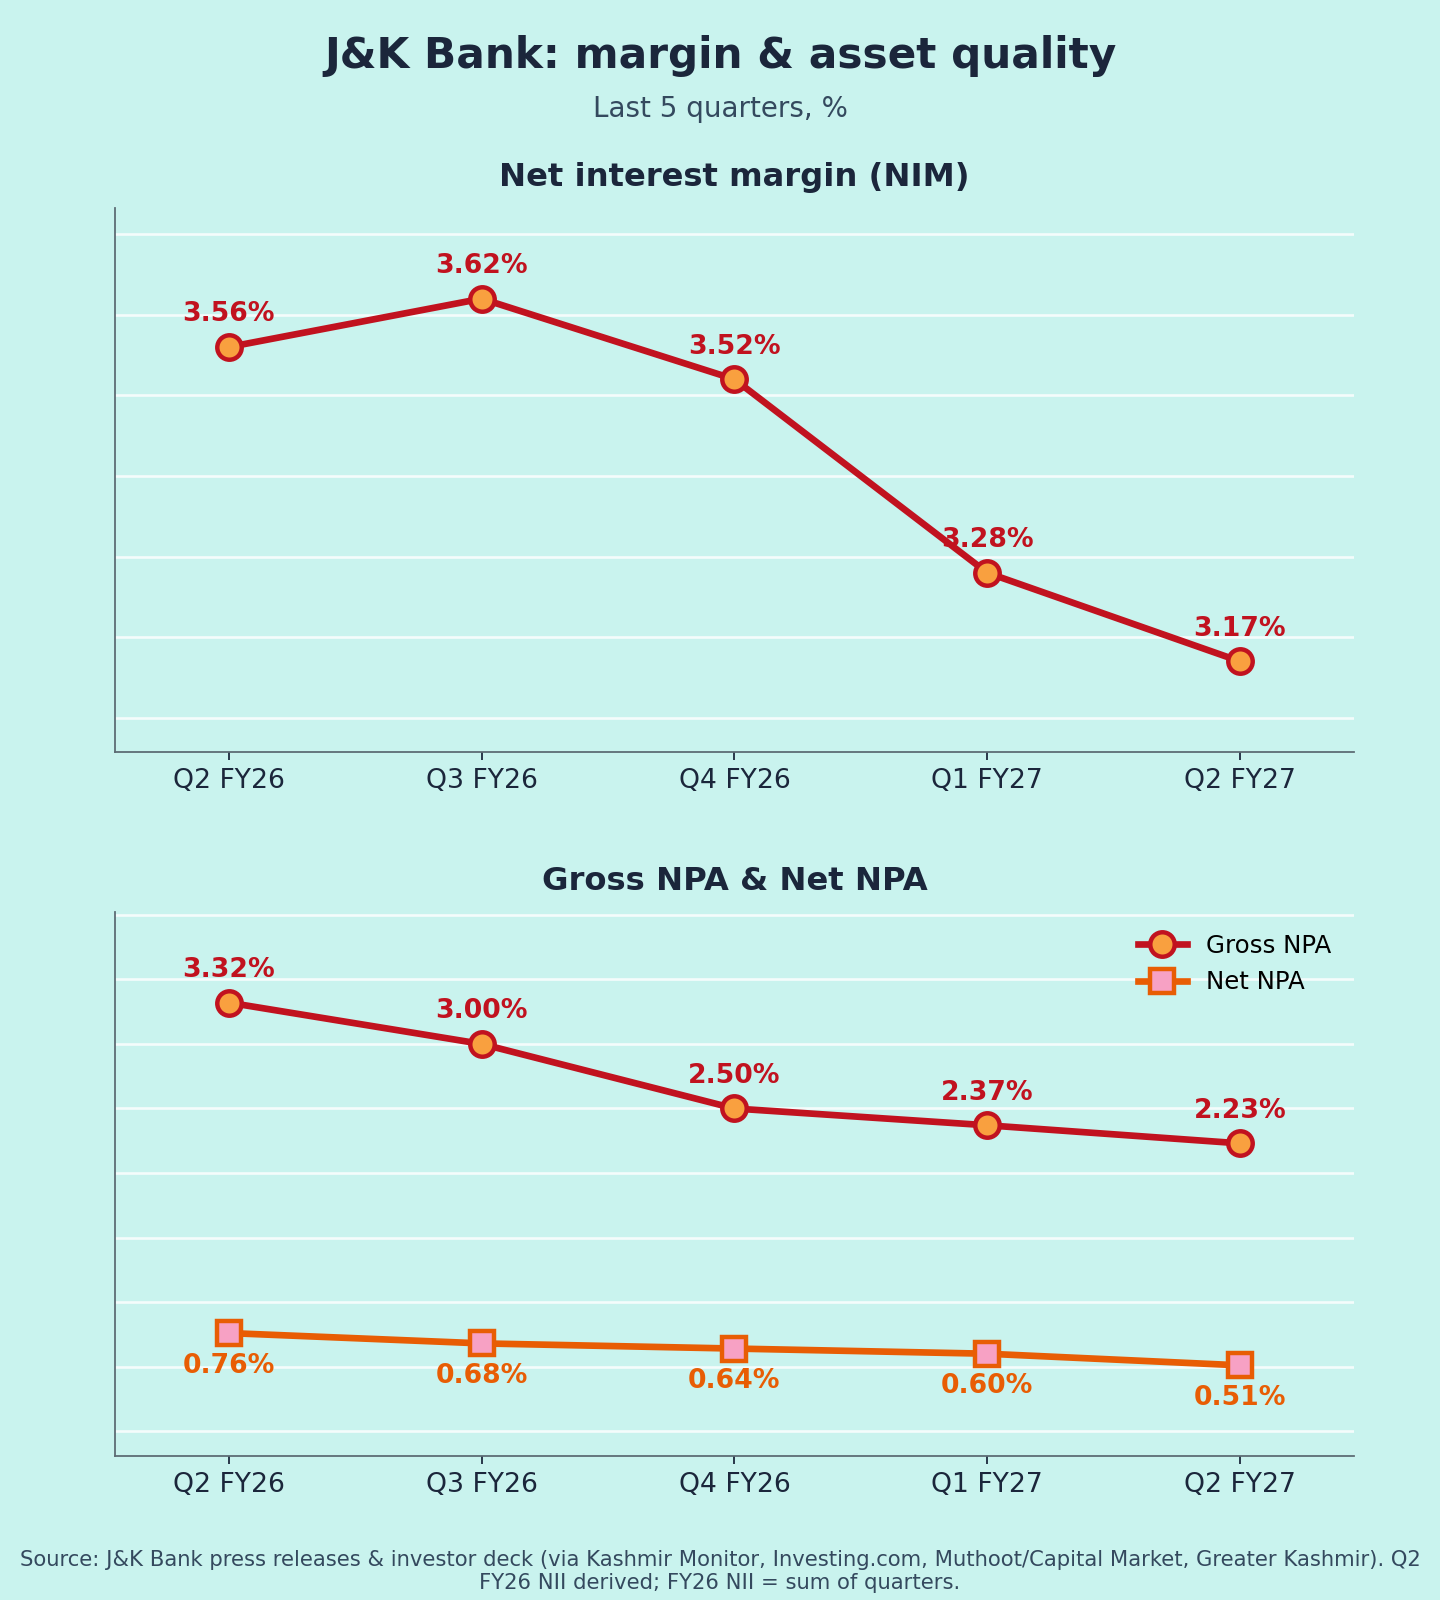
Margins and asset quality (Chart 3)
- NIM: 3.56% → 3.62% → 3.52% → 3.28% → 3.17% [2][10][11][3]. Down two quarters straight, after the repo-linked loan repricing and faster loan growth than deposits (interpretation).
- GNPA: 3.32% → 3.00% → 2.50% → 2.37% → 2.23%, the best in a decade. Annualised slippage was just 0.4% in H1 [1].
Guidance: what changed
- Credit growth: FY27 guidance raised to 14–18% [2], from 12% at the start of the year [9]. Deposit growth: now 12%+, from 10% [2][9].
- Asset quality: GNPA below 2%; no incremental credit cost for the rest of FY27, with provisions of ~₹70–85 cr a quarter [2][12].
- NIM: management expects "substantial improvement" over the next two quarters [2].
- CASA: target of 42% or better [2]. It was 45.7% in June 2025 [13].
- Vision 2030: total business of ₹5 lakh cr, vs ₹3.10 lakh cr now [1].
Positives
- Decade-best GNPA/NNPA and PCR [1]
- Strong loan growth; guidance raised [1][2]
- CRAR up to 16.57% [1]
Concerns
- NIM down 39 bps YoY [2]
- Profit leaning on other income [1]
- CASA ratio slipping; CD ratio rising [1][2]
- Loans growing faster than deposits; funding cost risk (my view)
Things to track in Q3 FY27
- NIM recovery as promised
- Other income composition
- Credit cost staying within ₹70–85 cr a quarter
- Deposit growth and CASA vs the 42% target
Not a buy/sell recommendation. Facts are sourced; opinions are labelled.
Sources [1] Kashmir Monitor – bank press release, 22 Oct · [2] Investing.com – Q2 slides · [3] J&K Bank – Q1 FY27 release · [4] Indian Opinion · [5] Daily Excelsior/PTI · [6] Whalesbook · [7] Free Press Journal – consolidated · [8] MarketsMojo – Q1 FY27 / PSU Connect · [9] CompoundingAI – Q1 FY27 · [10] Greater Kashmir – Q3 FY26 · [11] Muthoot/Capital Market – Q4 FY26 · [12] Investing.com – call transcript · [13] Business Standard – Q1 FY26 · [14] J&K Bank – FY25 deck · [15] J&K Bank – FY23 release
Charts:
(1) last 5 quarters NII & PAT [1][3][10][11];
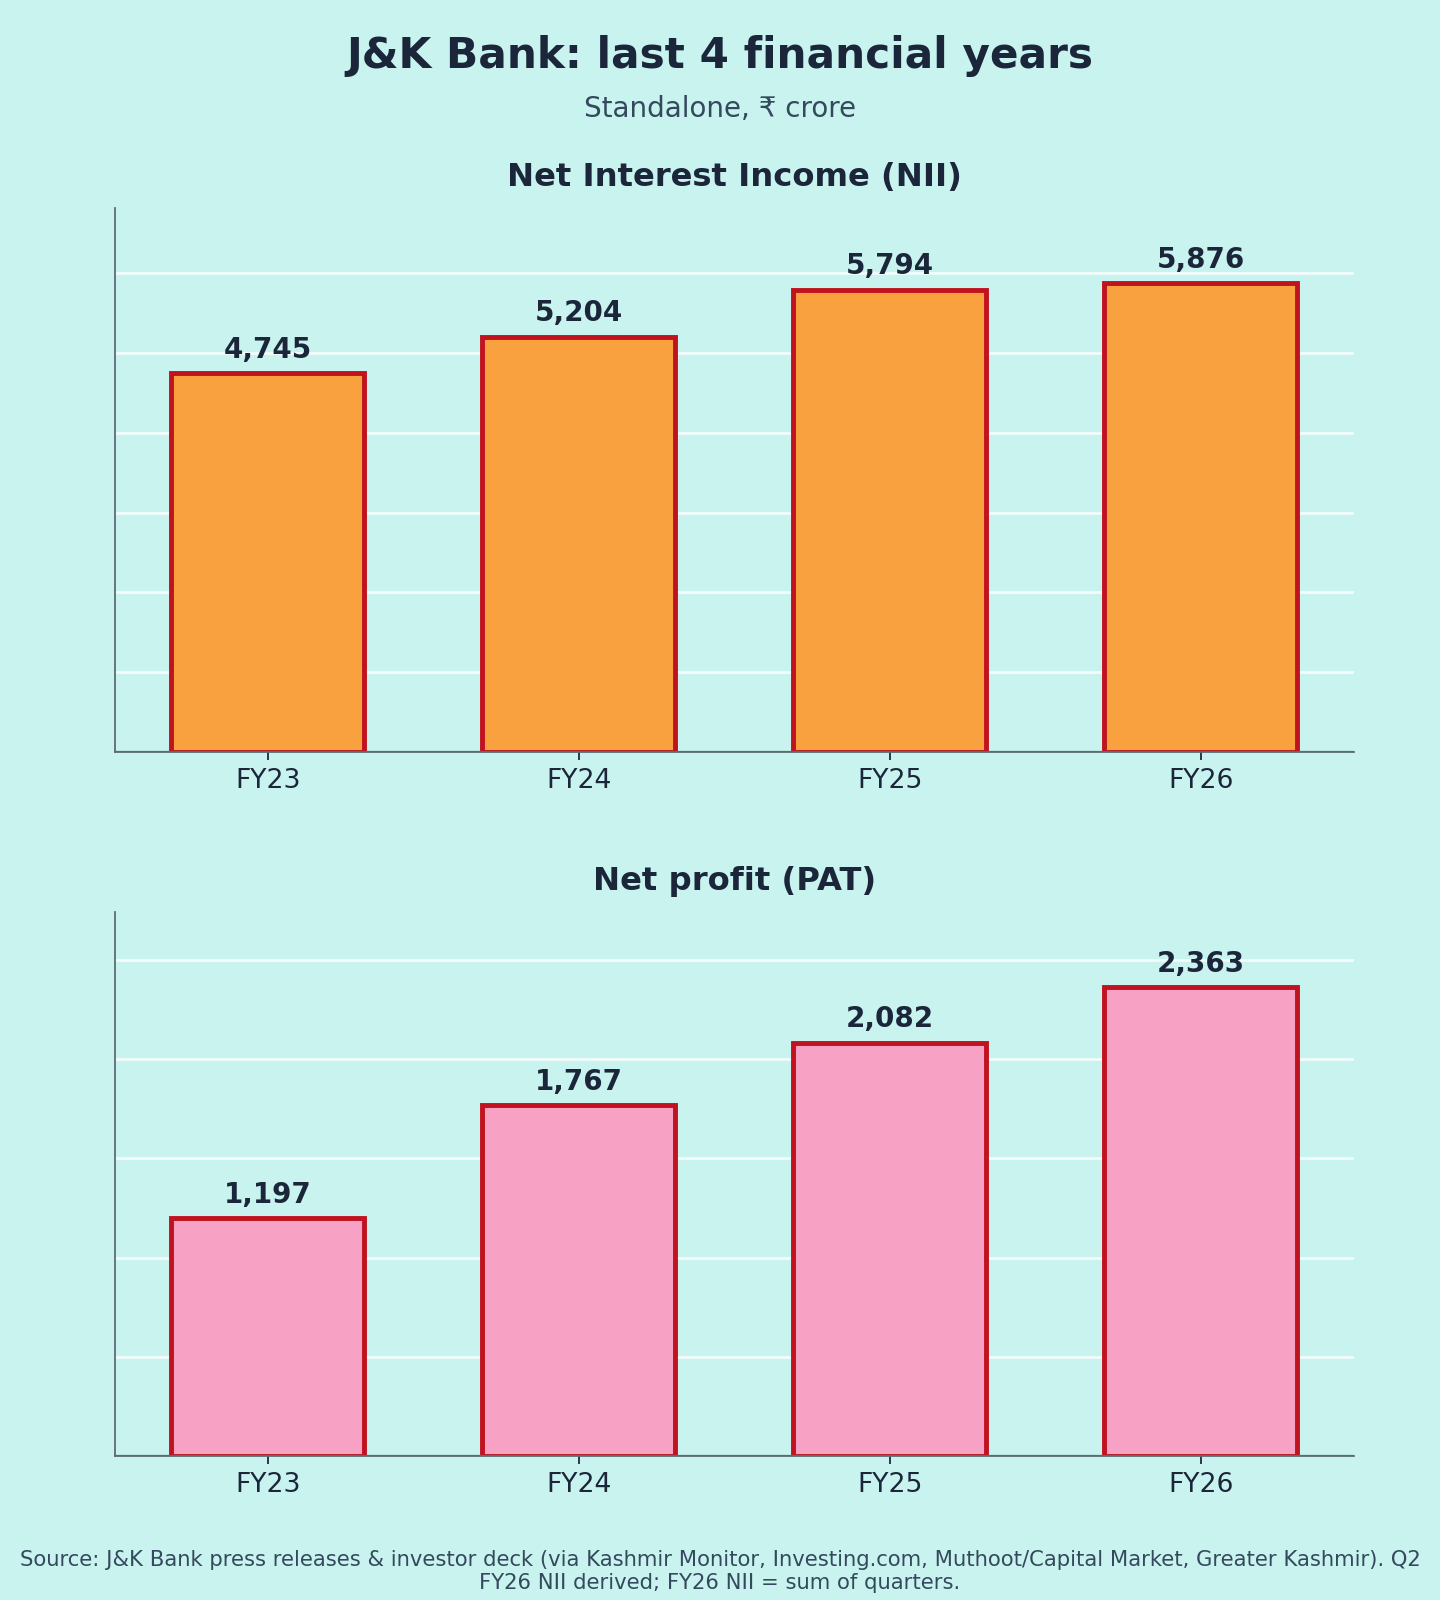
(2) FY23–FY26 NII & PAT [11][14][15] (FY26 NII summed from quarters);
(3) NIM, GNPA & NNPA [1][2][3][10][11].