SML Mahindra (SMLMAH): Q2 FY27 results analysis (quarter ended 30 Sep 2026)
Standalone figures, ₹ crore unless stated. Results released after market hours on 19 Oct 2026 [2][3]. EBITDA excludes other income. YoY/QoQ %, margins and ratios are my calculations from reported numbers.
| Metric | Q2 FY27 | YoY | QoQ |
| Revenue from ops | 669.8 | +20.7% | −30.1% |
| EBITDA | 28.5 | −32.0% | −71.5% |
| EBITDA margin | 4.3% | 7.6% | 10.4% |
| PBT | 15.9 | −44.0% | −81.4% |
| PAT | 11.7 | −44.4% | −81.6% |
| PAT margin | 1.7% | 3.8% | 6.6% |
| Other income / PBT | 10% | 7% | 1% |
Seasonality first
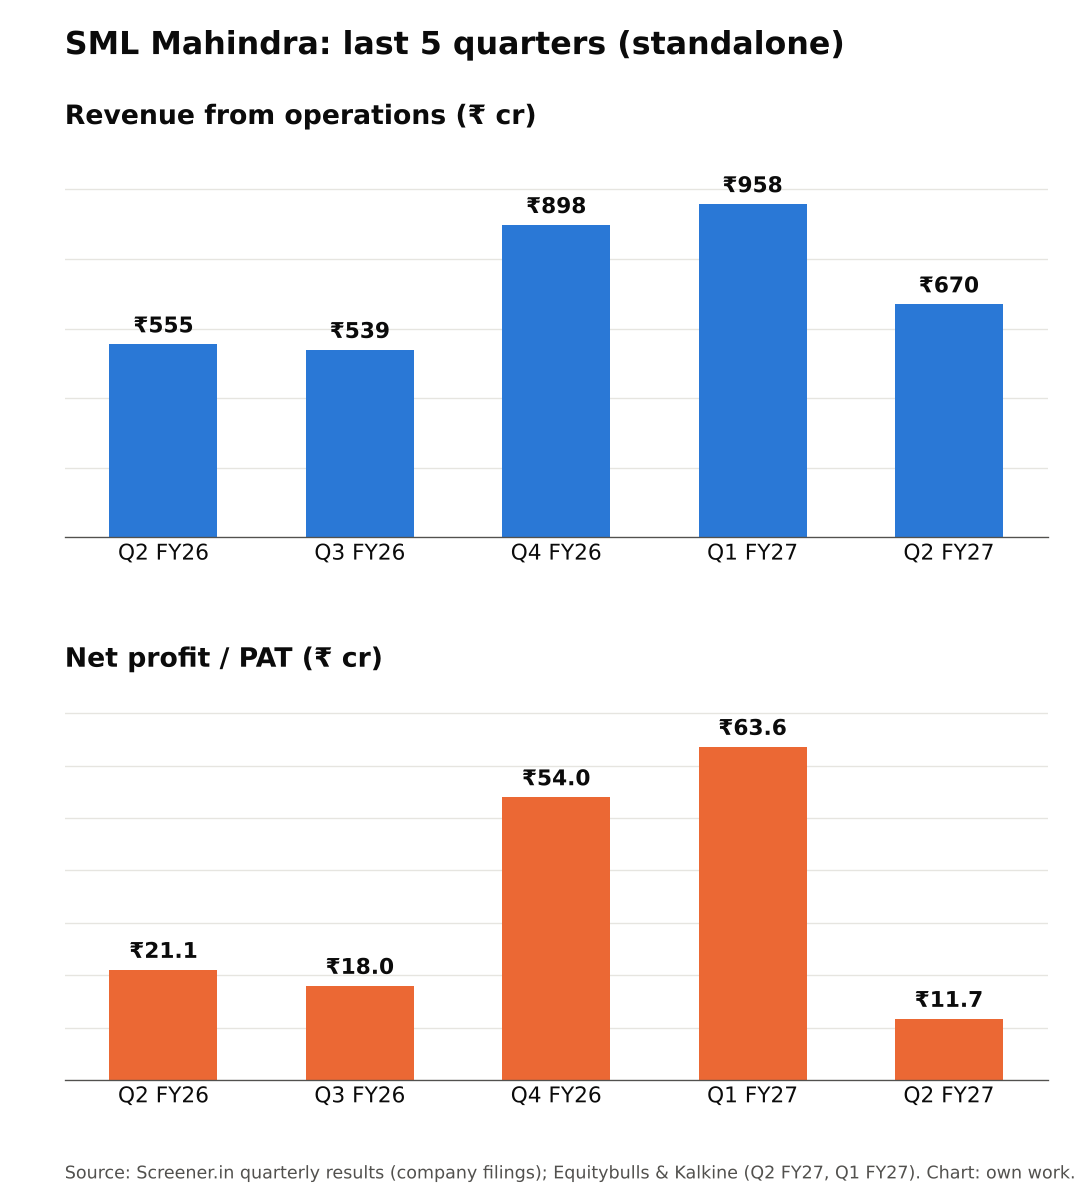
Q1 is seasonally SML's strongest quarter: Q1 FY26 revenue was ₹846 cr vs ₹555 cr in Q2 FY26 [3]. The filing coverage cites "seasonal cyclicality in commercial vehicle dispatches" [1]. So the −30% QoQ revenue and −72% QoQ EBITDA overstate the deterioration. YoY is the fair comparison, and it is still poor: revenue up 21%, but EBITDA down 32%.
Quality of earnings
The profit fall is operational. Other income is negligible at ₹1.6 cr [1]. Finance cost fell to ₹0.9 cr from ₹2.9 cr, and D&A was flat at ₹13.4 cr [1]. The tax rate is a normal ~26% [1]. No exceptional item is reported.
Expenses rose faster than revenue: total expenses +24% vs revenue +21% [1]. Coverage of the filing attributes this mainly to higher raw-material consumption, with steel the key input [4]. Employee cost rose 18.5% YoY to ₹67 cr [1].
Base effect: Q2 FY26 was not an unusually strong base (7.6% margin) [3]. The YoY margin drop of ~330 bps is real.
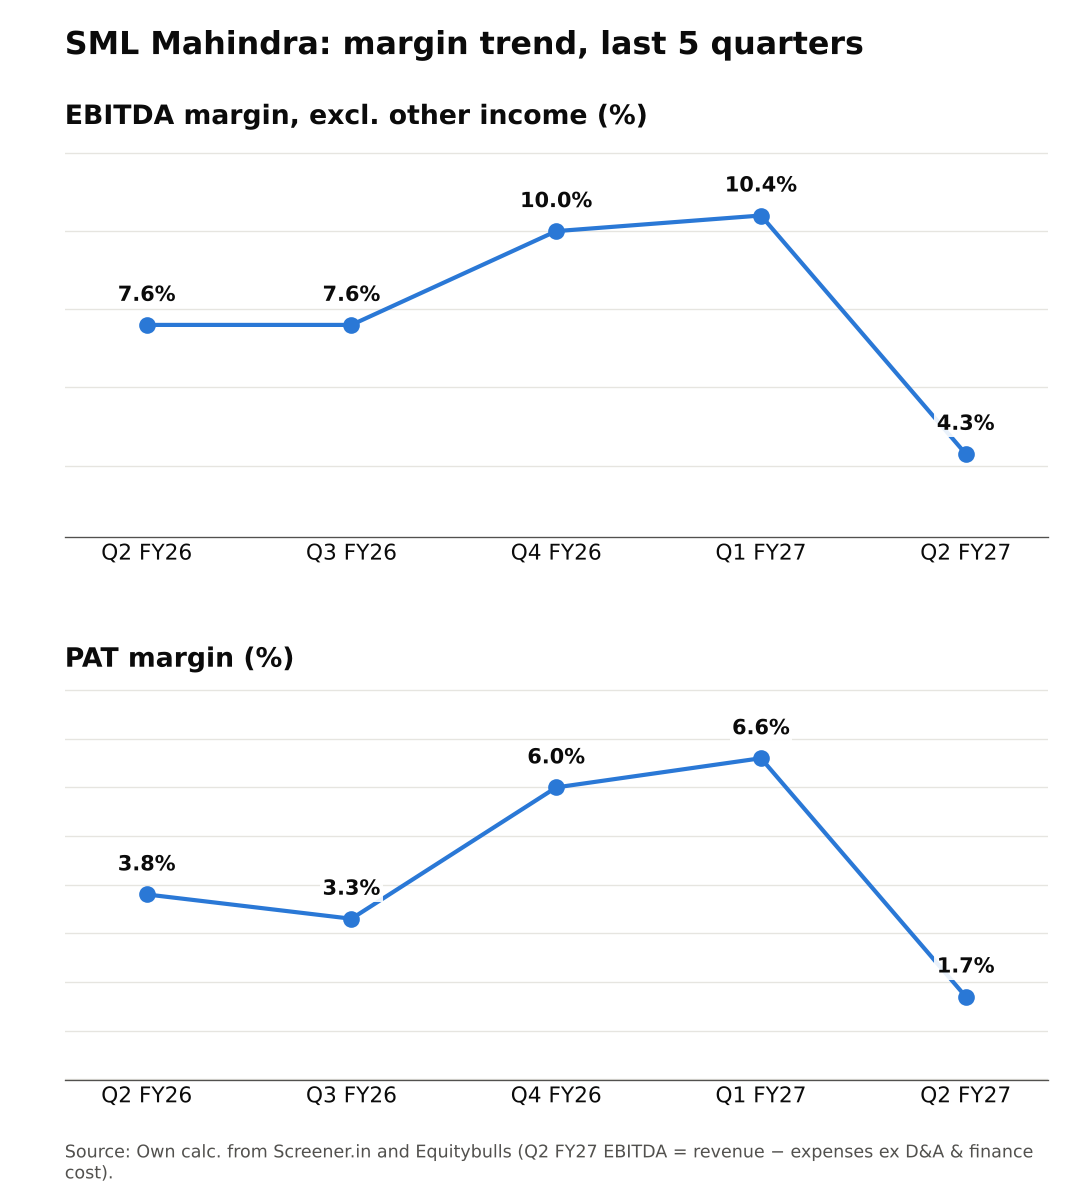
Margins (Chart 3)
EBITDA margin over five quarters: 7.6% → 7.6% → 10.0% → 10.4% → 4.3% [3]. Q2 FY27 is the lowest in the series. I couldn't find management commentary breaking down the drop between steel, pricing/discounts and mix. Without volumes and price data, it is hard to separate cost pressure from pricing (interpretation).
Management commentary / guidance
I found no Q2 earnings call or numeric guidance. The key strategic item is the July 2026 deal:
- MTBD acquisition: SML will buy Mahindra & Mahindra's Truck & Bus Division for ₹525 cr via slump sale. That division had a turnover of ₹2,989 cr, roughly 1x SML's FY26 revenue [6][3].
- Timeline: Closing is expected by 31 Jan 2027 [6]. Q2 numbers exclude it [4].
- Long-term targets (from the July call):A ₹12,500 cr business by FY31 [6]
- Market share from ~6% (FY26) to 10–12% by FY31 [6]
- No margin guidance given [6]
- Volumes: September sales were 1,124 units vs 950 a year ago [7]. Another report shows 1,071 units (likely domestic only) [8]; I couldn't reconcile the two.
Positives
- Revenue +21% YoY; September volumes up ~18% [1][7]
- Almost debt-free (finance cost ₹0.9 cr) [1]
- MTBD deal roughly doubles scale with M&M backing [6]
Concerns
- EBITDA margin at a five-quarter low [3]
- Cost growth outpacing revenue [1]
- Integration of a business as large as SML itself; deal is a related-party transaction [6]
- Limited disclosure: no Q2 call or quantified margin guidance (my view)
Things to track in Q3 FY27
- EBITDA margin recovery toward the 7–10% range
- Steel prices and any price hikes
- MTBD closing by Jan 2027, and the pro-forma numbers
- Monthly volumes, Oct–Dec
Not a buy/sell recommendation. Facts are sourced; opinions are labelled.
Sources [1] Equitybulls – Q2 FY27 P&L · [2] IANS, 19 Oct · [3] Screener.in · [4] Kalkine · [5] ScanX · [6] ScanX – MTBD deal & call, Jul 2026 · [7] Sahi – Sep sales · [8] Sahi – Sep production/sales · [9] MarketsMojo, 21 Oct · [10] HDFC Sky – market holidays · [11] Moneycontrol via TradingView, 21 Oct
Charts: (1) last 5 quarters revenue & PAT [1][3][4];
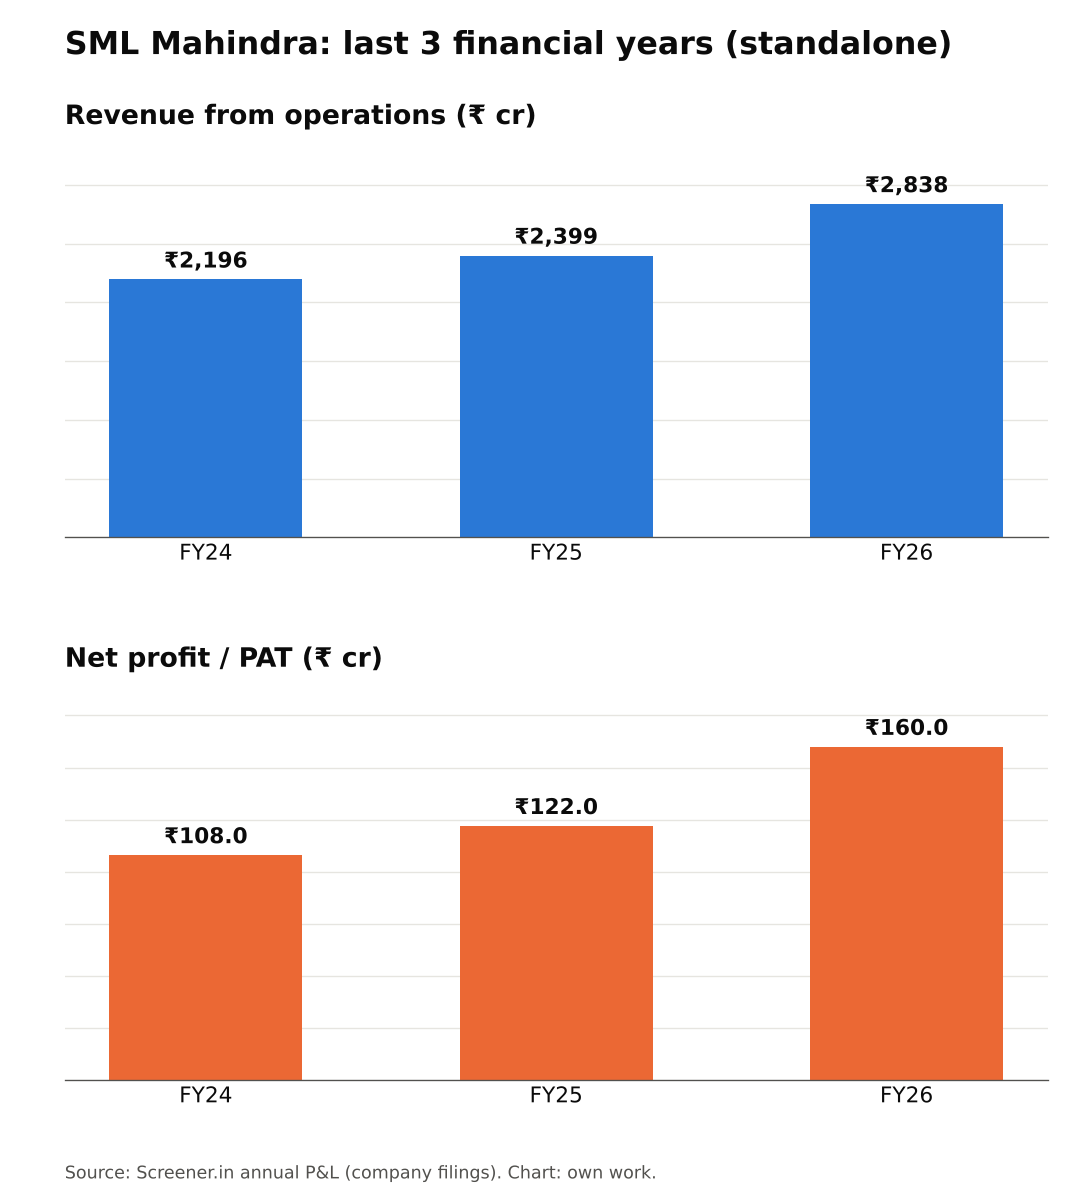
(2) FY24–FY26 revenue & PAT [3];
(3) EBITDA and PAT margin (own calc. from [1][3]).