Skip to content

The Jammu & Kashmir Bank

The Jammu & Kashmir Bank Limited · NSE: J&KBANK · BSE: 532209

Registered research

Notes by SEBI-registered analysts, each with the analyst’s registration number and disclosures. Open a note to read its disclosures.

No registered research on this company yet.

Member discussion

Members’ own views, with what each disclosed about their holding when posting.

Ashish Singh @ashish198984 #2

In reply to #1

Bottom line: The numbers reconcile, and the post's main call is right: profit growth came from other income, not lending. The math makes that point even stronger than the post does.

1. Operating profit growth was almost entirely other income (₹ cr)

Q2 FY26 Q2 FY27 Change

NII 1,434 1,502 +67

Other income 154 315 +161

Opex (derived) 965 1,028 +62 (+6.5%)

Operating profit 623 789 +166

Core profit (NII − opex) 469 474 +1%

Other income explains about 97% of the operating-profit increase (161 of 166). Core pre-provision profit was flat despite 24% loan growth. The derived cost-to-income ratios (56.6% vs 60.8%) match the reported ones, so these numbers hold.

2. Points the post should tighten

Claim in post Issue

"Opex +1.5% in H1" Q2 opex rose about 6.5% YoY. The H1 figure only works if Q1 opex fell.

QoQ jump "off a weak Q1" that included a ₹56 cr PSLC boost The boost made Q1 stronger, so it makes the QoQ comparison harder, not easier. The cleaner point is that H1 PAT was flat: 970 vs ~979, −0.9%.

Funding costs "barely moved" Loan yield fell 65 bps but NIM fell only 39 bps, so roughly 26 bps was offset somewhere

CD ratio 74.2% Last year's 69.2% grown at the reported rates (× 1.237 ÷ 1.163) gives 73.6%. The small gap may be gross vs net advances.

3. Provisions and guidance (my estimates)

  • Assuming about a 25% tax rate, Q2 provisions come to roughly ₹60 cr. That would put Q2 FY26 at about a net write-back of ~₹35 cr, which is why PAT grew only 10.6% while operating profit grew 26.7%.
  • Credit guidance of 14–18% against a 23.7% running rate implies either conservative guidance or a sharp slowdown in H2.
  • NII growth of 4.7% against NIM down 39 bps implies earning assets grew about 17.6% (1.047 ÷ 0.890). That's consistent with deposit growth of 16%: deposits, not loans, are setting the pace.
  • Vision 2030 (₹5 lakh cr from ₹3.10 lakh cr) needs about 14.6% CAGR over 3.5 years. That's achievable only if deposits keep up, and CASA has slipped about 3.7 pp since June 2025.

My read: Asset quality is the real strength, with GNPA at 2.23% and PCR at 92%. Earnings quality is the weakness. Q3 rests on two things: the promised NIM recovery, and whether other income near ₹300 cr repeats. If either misses, PAT growth goes to roughly zero. This is analysis, not a recommendation.

Author's disclosure: Not invested
Vishal @vishal #1

J&K Bank (J&KBANK): Q2 FY27 results analysis

(Quarter ended 30 Sep 2026)

All figures standalone, ₹ crore unless stated. Results approved on 22 Oct 2026 [1]. YoY/QoQ % and the CD ratio check are my calculations from reported numbers.

MetricQ2 FY27Q2 FY26Q1 FY27
NII1,502 (+4.7% YoY, +0.3% QoQ)~1,4341,497
NIM3.17%3.56%3.28%
Other income315154~214
Operating profit789 (+26.7% YoY)~623703
PAT546 (+10.6% YoY, +28.8% QoQ)494424
GNPA / NNPA2.23% / 0.51%3.32% / 0.76%2.37% / 0.60%
PCR91.76%–90.53%
Advances / deposits growth+23.7% / +16.3%–~+25% / +17%
CASA ratio41.97%––
CD ratio74.2%69.2%–
CRAR16.57%15.27%–

Sources: [1][2][3][4]. Q2 FY26 NII derived from the reported growth.

Source note: PTI/CNBC-TV18 show PAT growth as 10.5–11% [5][6]; the bank's release says 10.6% [1]. Consolidated PAT is ₹547 cr [7].

Quality of earnings

The profit growth did not come from lending income.

  • NII rose only ~5% despite ~24% loan growth [1]. NIM fell 39 bps YoY to 3.17% as yield on advances dropped to 8.55% from 9.20% while funding costs barely moved [2].
  • Other income doubled to ₹315 cr [1]. The release doesn't split it into treasury, recoveries or fees. Without that split, I treat part of it as less reliable (my view).
  • Costs: opex was well controlled (+1.5% in H1); cost-to-income improved to 56.6% from 60.8% [1].
  • Provisions: H1 PAT was flat YoY because higher provisions offset operating gains [2].

Base note: the +28.8% QoQ jump is off a weak Q1. Q1 profit fell 12.5% YoY, and even that included a ₹56 cr boost from a change in PSLC accounting [8][9].

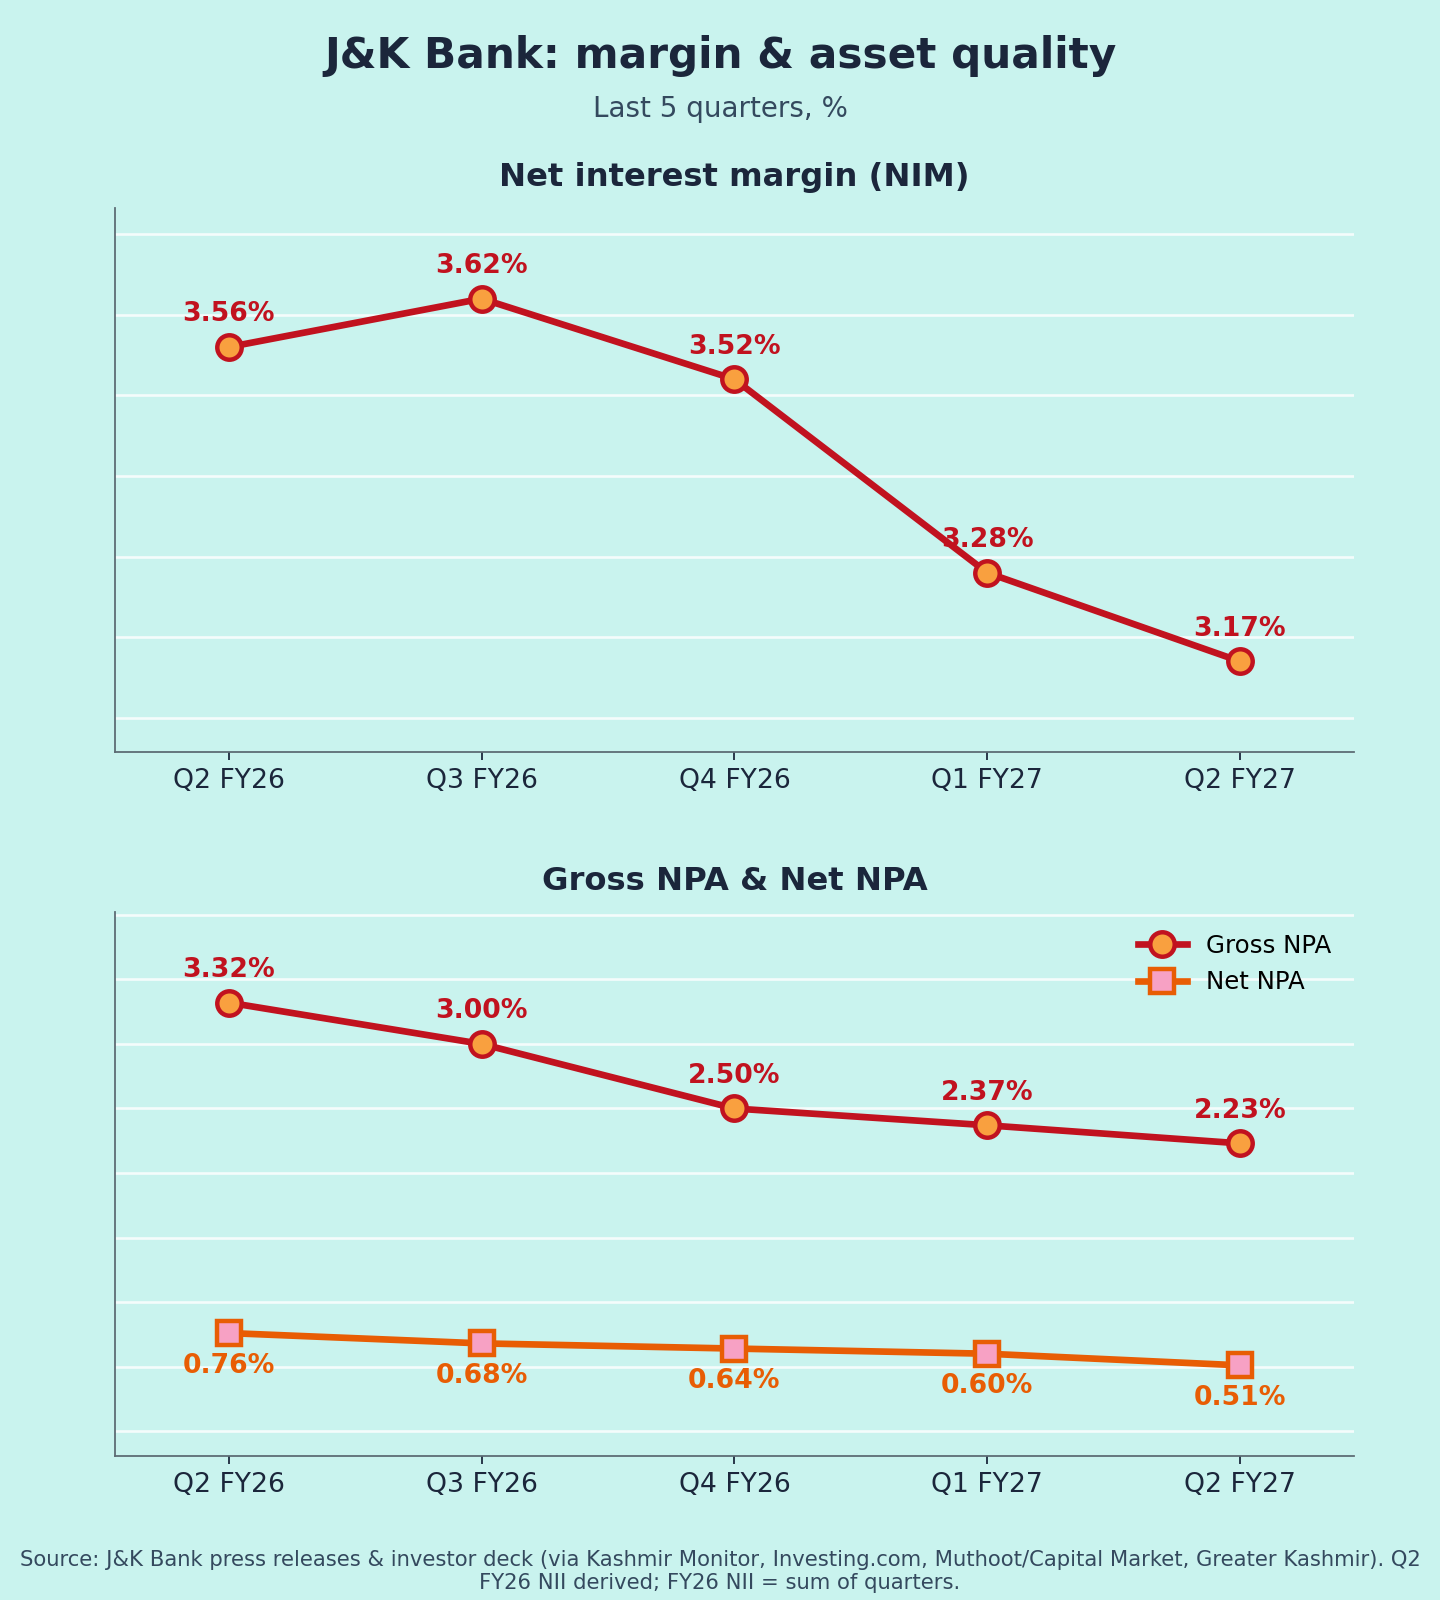
Margins and asset quality (Chart 3)

  • NIM: 3.56% → 3.62% → 3.52% → 3.28% → 3.17% [2][10][11][3]. Down two quarters straight, after the repo-linked loan repricing and faster loan growth than deposits (interpretation).
  • GNPA: 3.32% → 3.00% → 2.50% → 2.37% → 2.23%, the best in a decade. Annualised slippage was just 0.4% in H1 [1].

Guidance: what changed

  • Credit growth: FY27 guidance raised to 14–18% [2], from 12% at the start of the year [9]. Deposit growth: now 12%+, from 10% [2][9].
  • Asset quality: GNPA below 2%; no incremental credit cost for the rest of FY27, with provisions of ~₹70–85 cr a quarter [2][12].
  • NIM: management expects "substantial improvement" over the next two quarters [2].
  • CASA: target of 42% or better [2]. It was 45.7% in June 2025 [13].
  • Vision 2030: total business of ₹5 lakh cr, vs ₹3.10 lakh cr now [1].

Positives

  • Decade-best GNPA/NNPA and PCR [1]
  • Strong loan growth; guidance raised [1][2]
  • CRAR up to 16.57% [1]

Concerns

  • NIM down 39 bps YoY [2]
  • Profit leaning on other income [1]
  • CASA ratio slipping; CD ratio rising [1][2]
  • Loans growing faster than deposits; funding cost risk (my view)

Things to track in Q3 FY27

  1. NIM recovery as promised
  2. Other income composition
  3. Credit cost staying within ₹70–85 cr a quarter
  4. Deposit growth and CASA vs the 42% target

Not a buy/sell recommendation. Facts are sourced; opinions are labelled.

Sources [1] Kashmir Monitor – bank press release, 22 Oct · [2] Investing.com – Q2 slides · [3] J&K Bank – Q1 FY27 release · [4] Indian Opinion · [5] Daily Excelsior/PTI · [6] Whalesbook · [7] Free Press Journal – consolidated · [8] MarketsMojo – Q1 FY27 / PSU Connect · [9] CompoundingAI – Q1 FY27 · [10] Greater Kashmir – Q3 FY26 · [11] Muthoot/Capital Market – Q4 FY26 · [12] Investing.com – call transcript · [13] Business Standard – Q1 FY26 · [14] J&K Bank – FY25 deck · [15] J&K Bank – FY23 release

Charts:

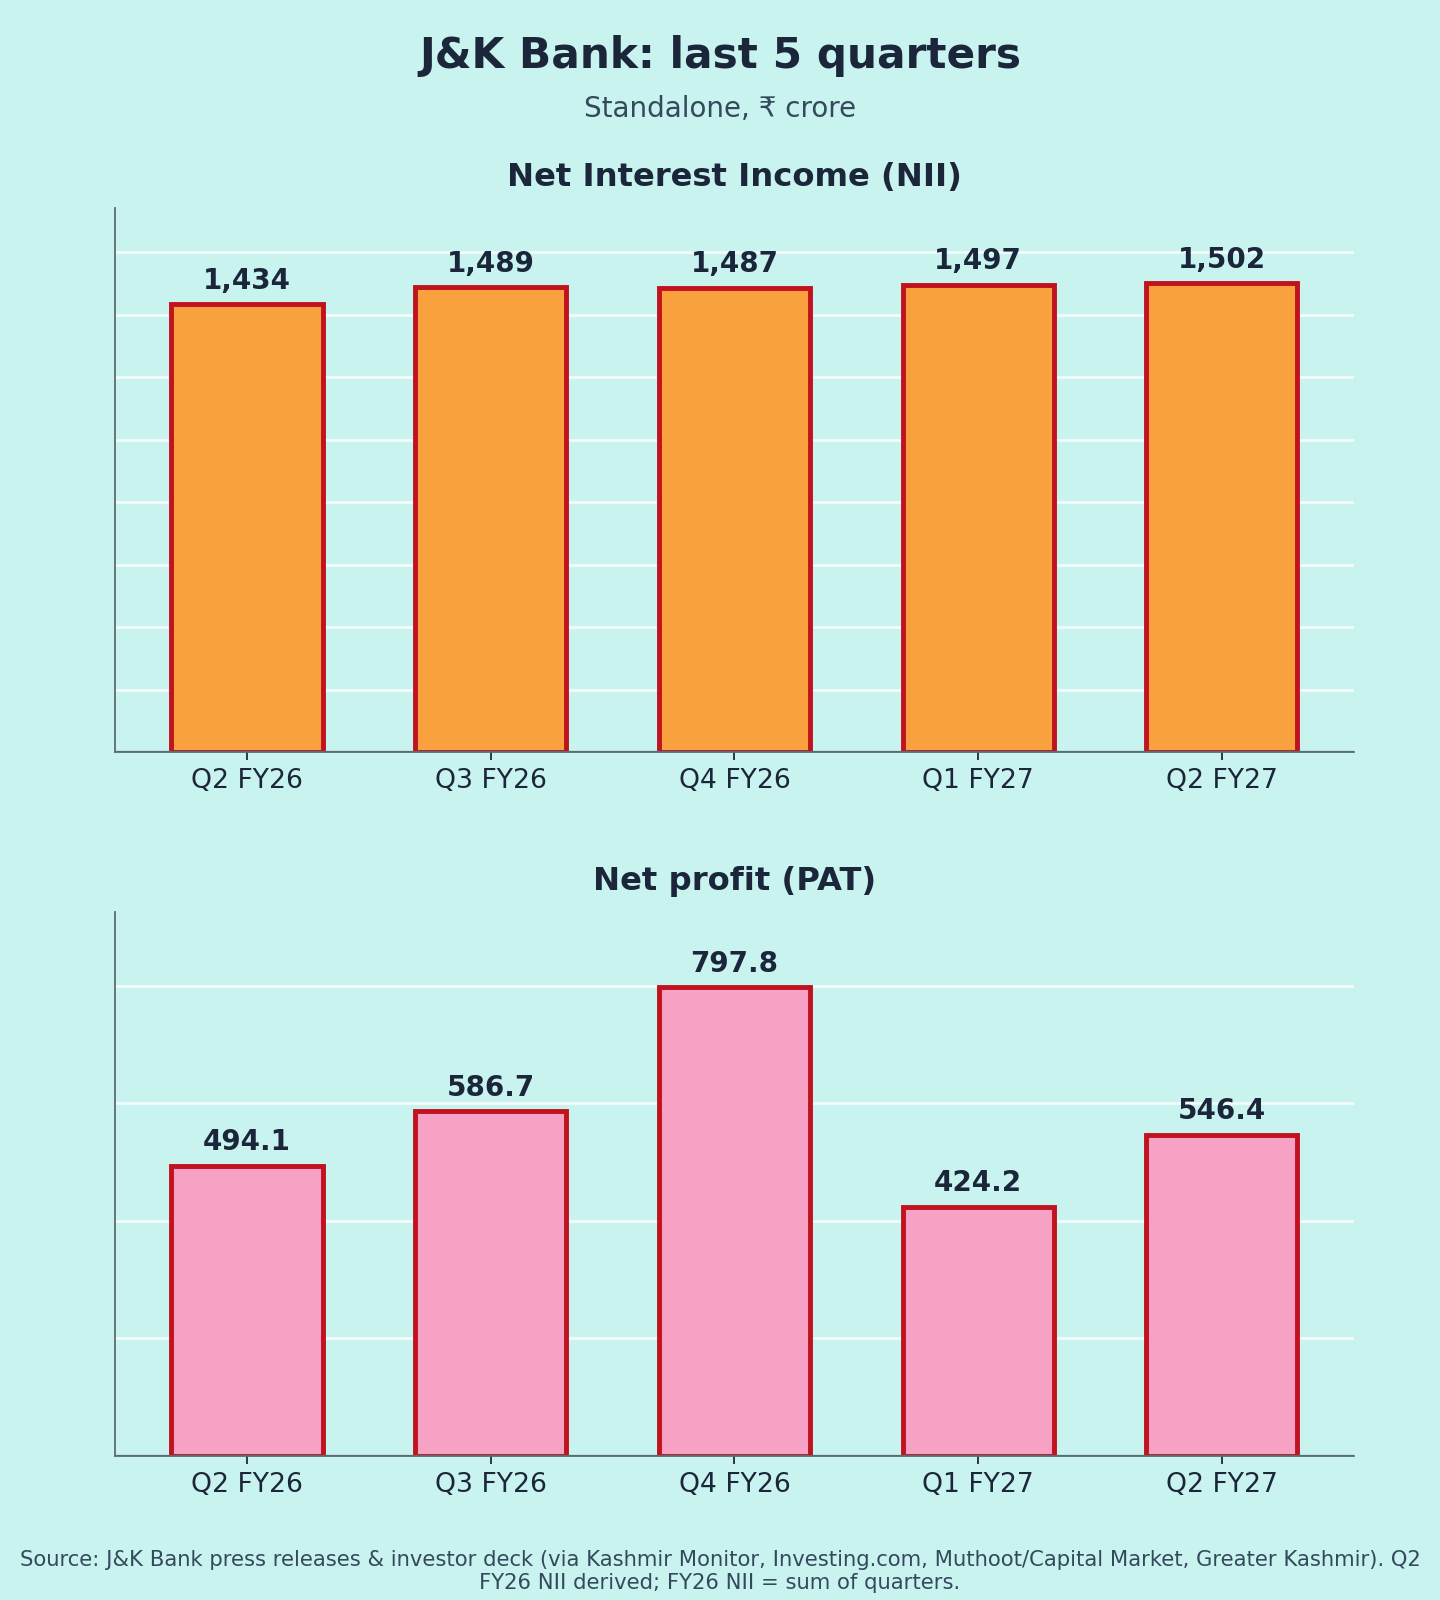
(1) last 5 quarters NII & PAT [1][3][10][11];

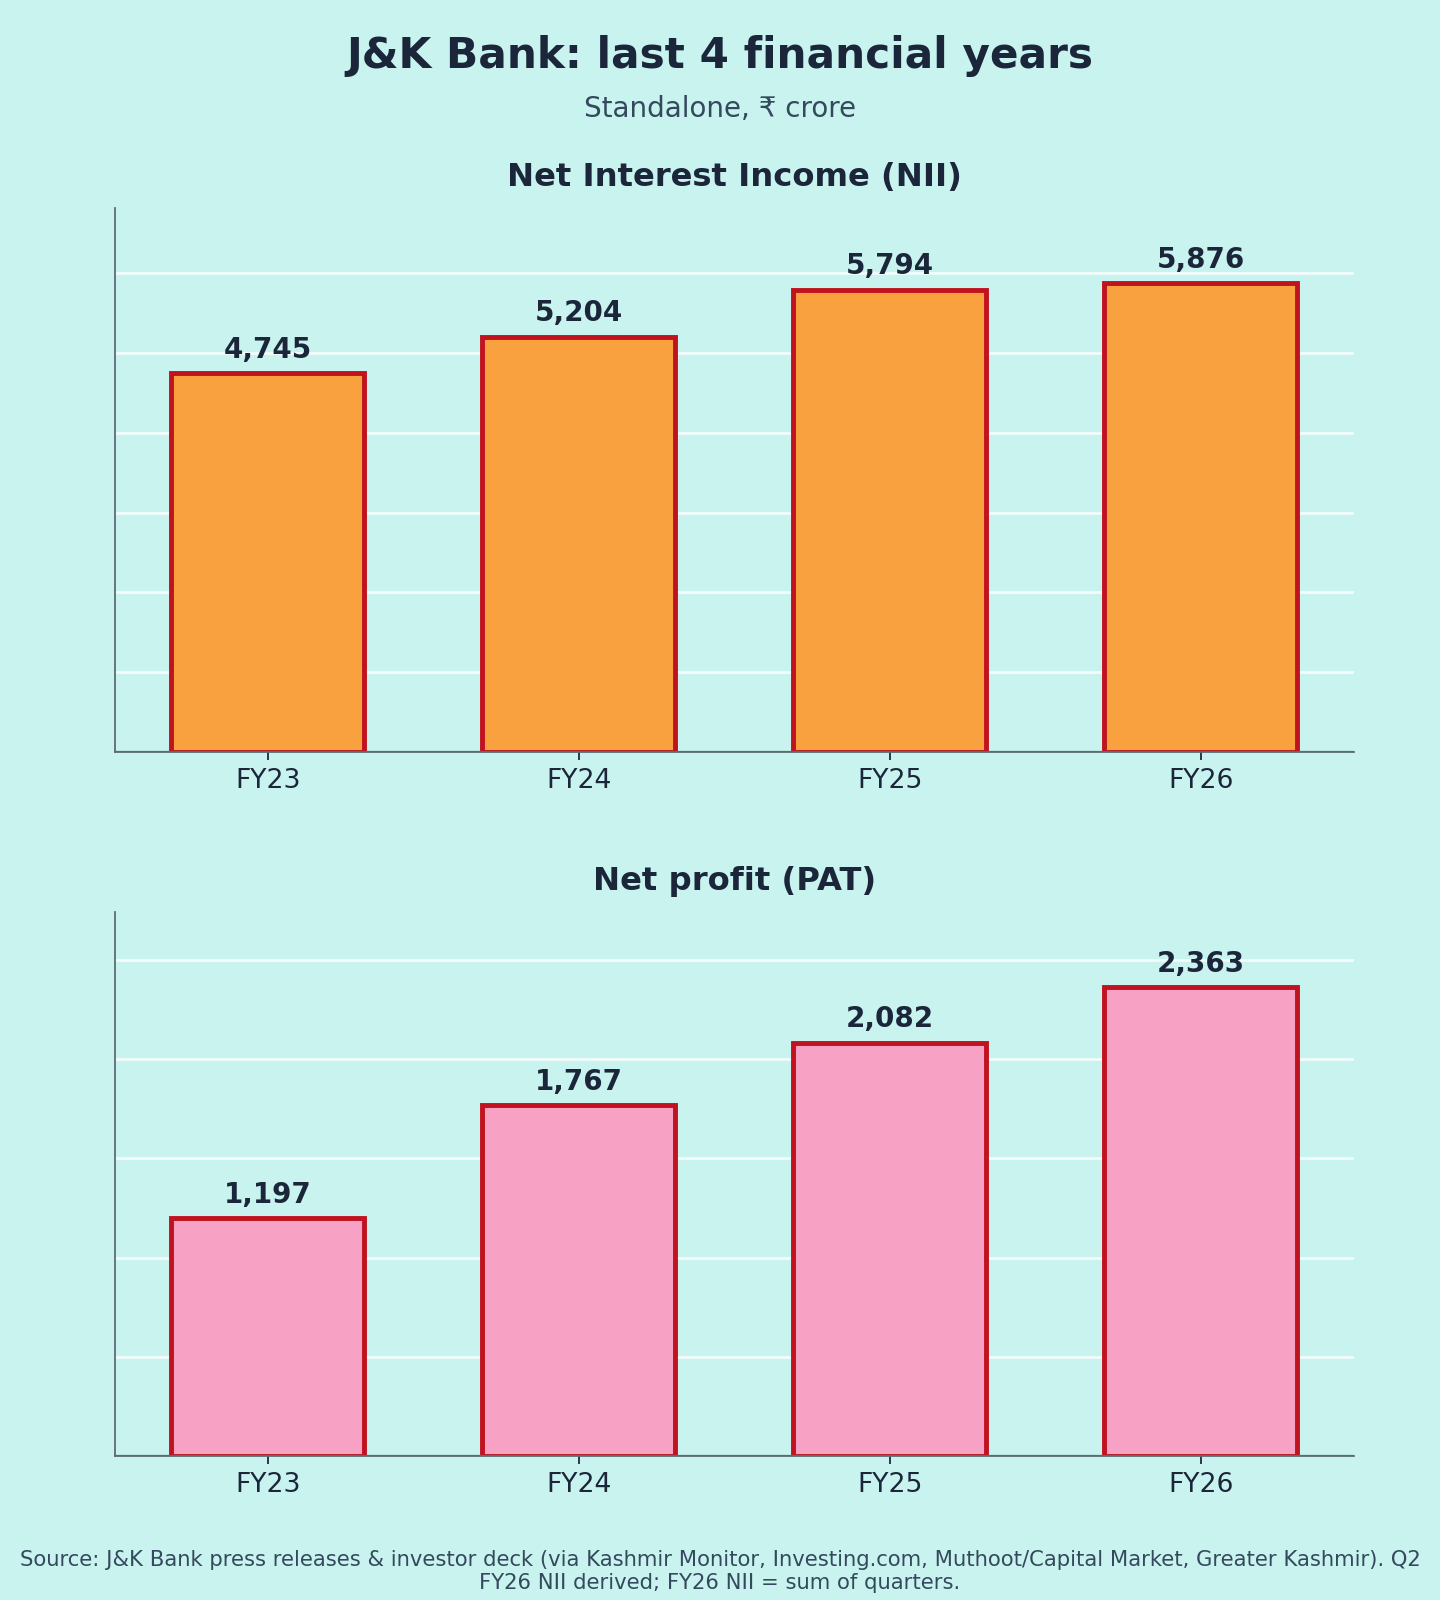
(2) FY23–FY26 NII & PAT [11][14][15] (FY26 NII summed from quarters);

(3) NIM, GNPA & NNPA [1][2][3][10][11].

JK Bank Quarterly
JK Bank Quarterly
JK Bank Annual
JK Bank Annual
JK Bank Trend
JK Bank Trend
Author's disclosure: Not invested

Posts are members’ own views and are not investment advice. Holdings shown are what each member disclosed when posting. Research notes are by SEBI-registered analysts under their own registration; Mudraa hosts them and does not endorse them.

To take part, Log in or Join. Members verify their email and phone and agree to the community rules.

Report this

Tell the moderators what is wrong. The member is not told who reported them.

Reason