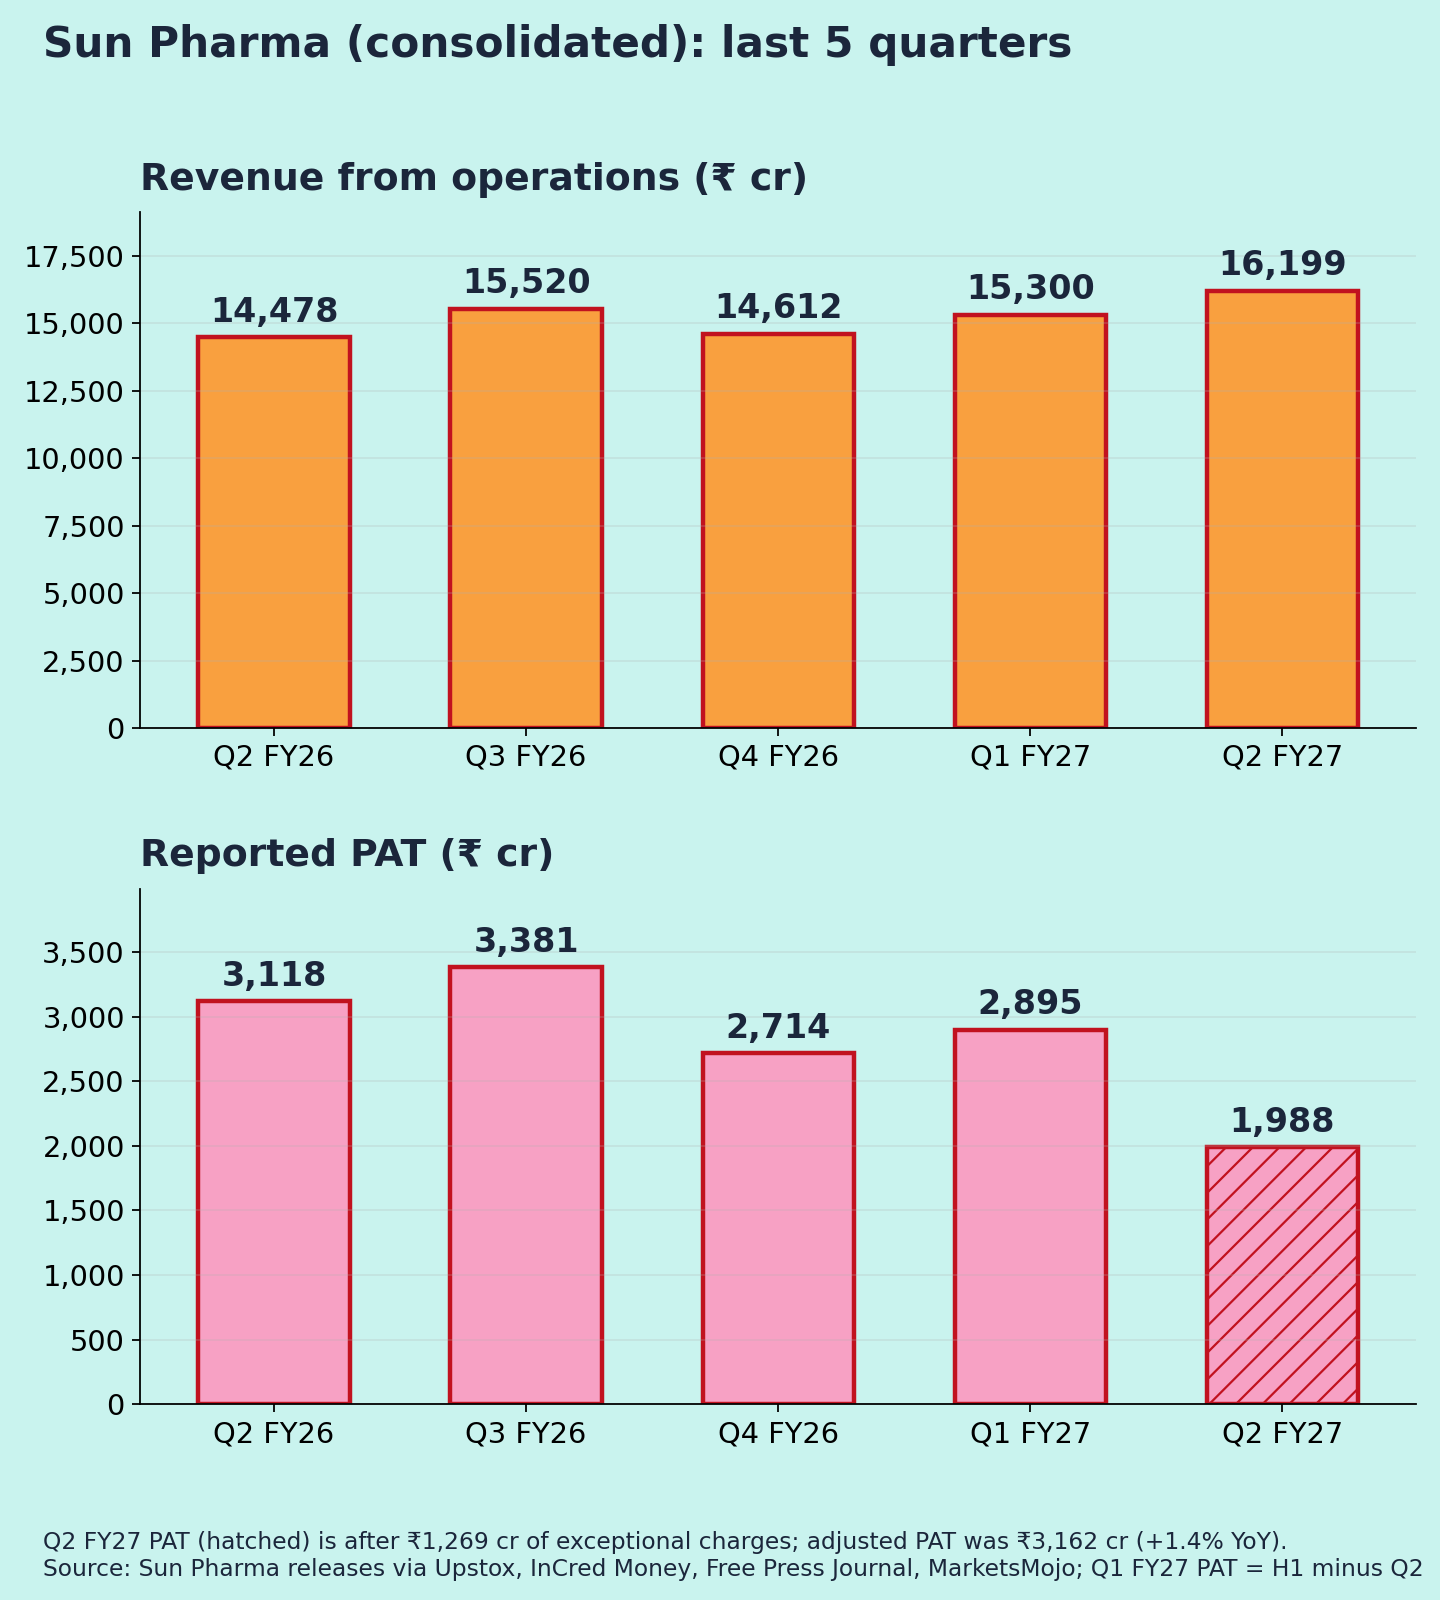
All figures consolidated, ₹ crore unless stated. Results released on 30 Oct 2026. YoY/QoQ % and margins are my calculations from reported numbers.
| Metric | Q2 FY27 | YoY | QoQ |
| Revenue from ops | 16,198.7 | +11.9% | +5.9% |
| EBITDA | 4,744 | +4.8% | +7.4% |
| EBITDA margin | 29.3% | 31.3% | 28.9% |
| Exceptional items | (1,268.8) | – | – |
| PAT (reported) | 1,988.5 | −36.2% | −31.3% |
| PAT (adjusted, excl. one-offs) | 3,162 | +1.4% | +2.3% |
| PAT margin (reported) | 12.3% | 21.5% | 18.9% |
| R&D spend | 778 (4.8% of sales) | – | – |
For margin rows, the YoY and QoQ columns show the prior-period value. Q1 FY27 figures are derived from H1 minus Q2.
Quality of earnings
The headline profit fall is a one-off. Exceptional charges of ₹1,269 cr hit the quarter. They mainly cover a US generic-drug pricing antitrust settlement and costs linked to the Organon acquisition. A ₹95 cr tax benefit partly offset them. Adjusted profit rose just 1.4%.
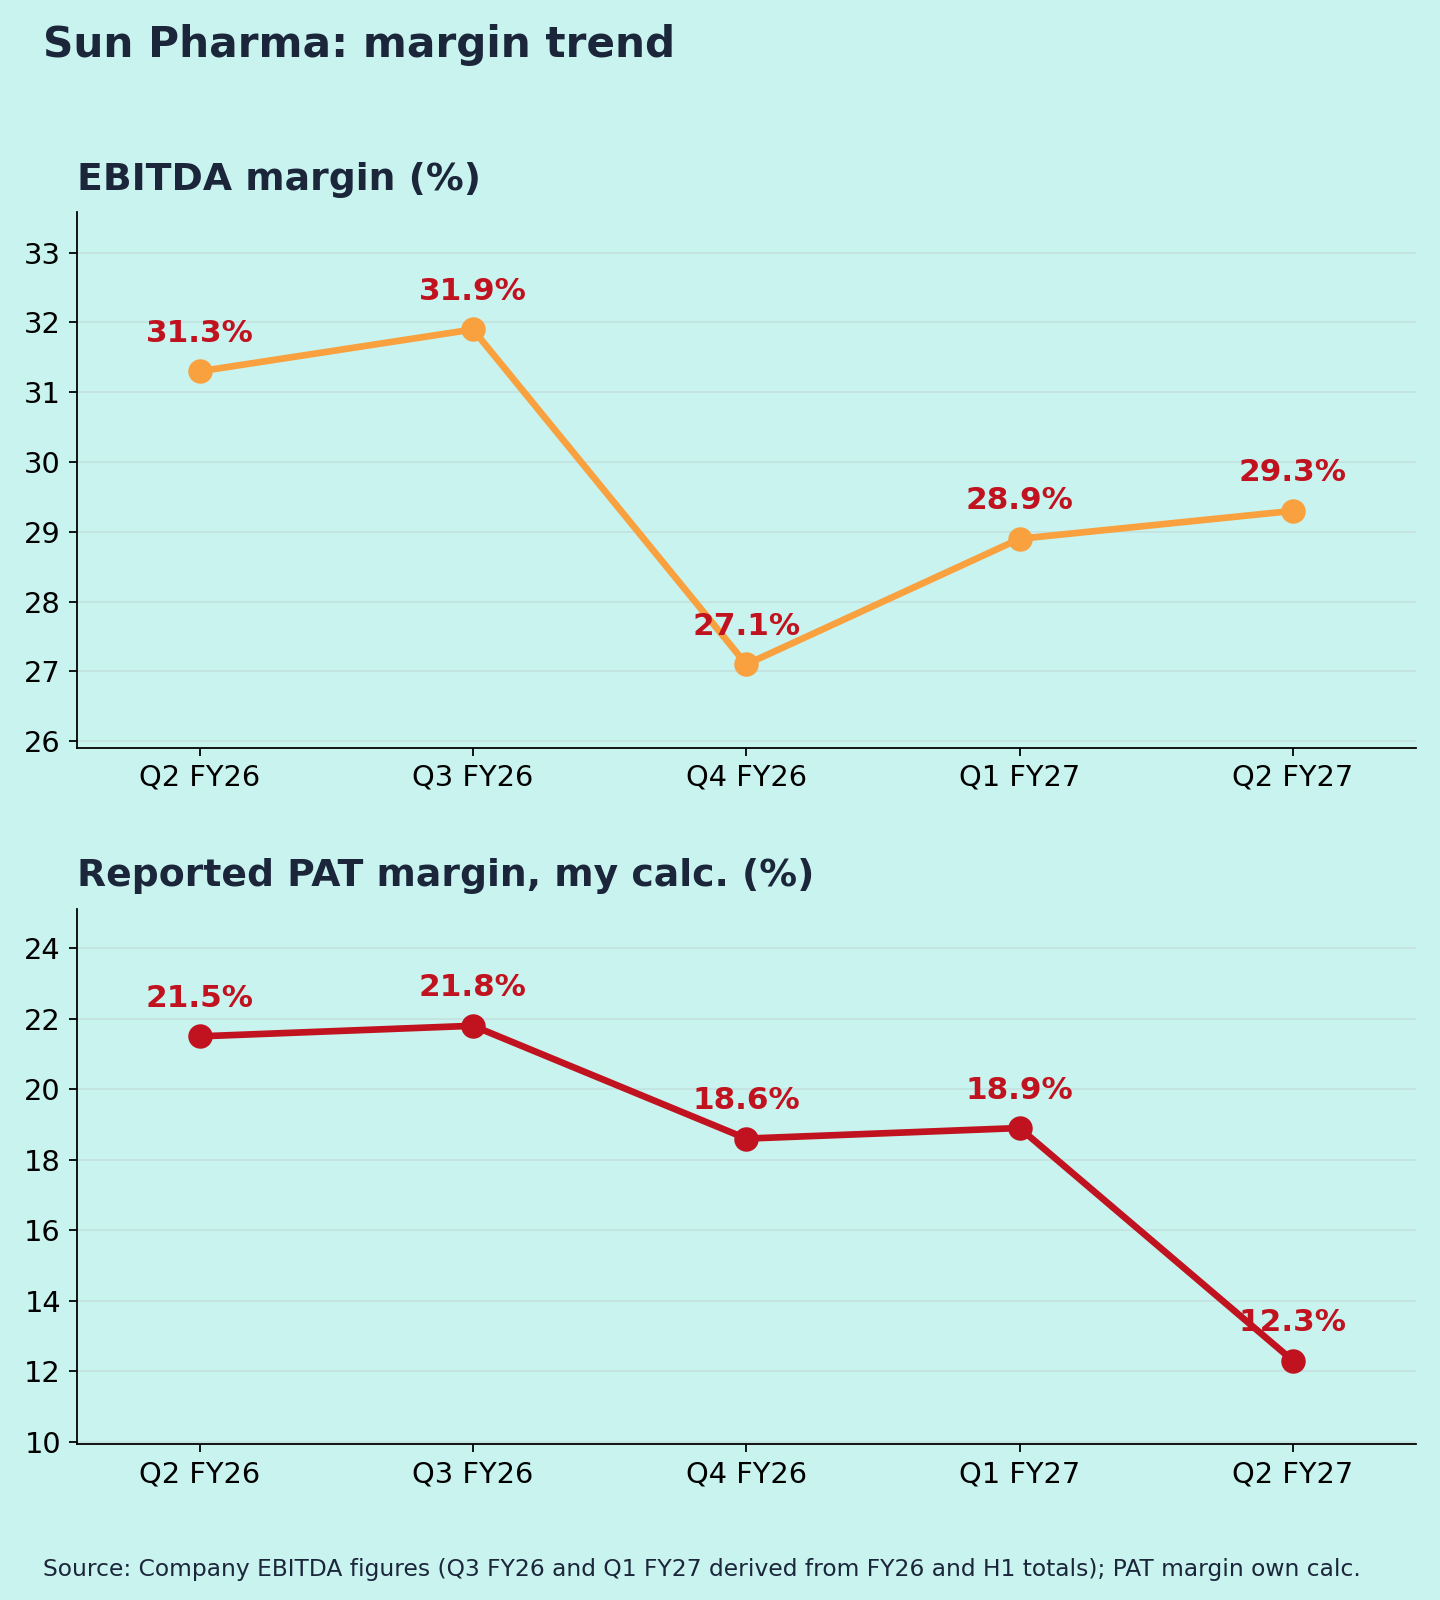
The bigger question is margins. Revenue grew 12% but EBITDA only 5%, so the margin fell 200 bps to 29.3%.
By region:
- India formulations: +17.3% to ₹5,552 cr, now 34.5% of sales. This is the growth engine.
- US formulations: $455 mn, −8.2%. Price erosion on generic lenalidomide (a cancer drug) is hurting [5].
- Global Innovative Medicines (specialty brands): +6.9%, 21.1% of sales. That is slower than FY26's +16% [6].
- Emerging markets / Rest of World: +7.6% / +3.1% in dollars.
Base effect: Q2 FY26 was a strong quarter (31.3% margin), so part of the margin decline is a high base.
Margins (Chart 3)
EBITDA margin over five quarters: 31.3% → 31.9% → 27.1% → 28.9% → 29.3%. The Q3 FY26 and Q1 FY27 figures are derived from full-year and H1 totals. The level has shifted lower since Q4 FY26. The likely causes are the US generic pressure and a mix tilting toward India (interpretation).
R&D fell to 4.8% of sales, from 6.7% in Q4 FY26 [1][6]. R&D spend tends to be lumpy, so lower R&D flattered the margin this quarter (my view).
Guidance: what changed
- Revenue: FY27 guidance is high single-digit consolidated growth [9]. H1 is running at about 11%, ahead of that.
- Organon acquisition: still expected to complete in Q4 FY27 [9][5]. Deal costs are already showing up in exceptional items.
- Pre-result estimates: consensus revenue was about ₹15,766 cr and adjusted PAT about ₹3,085–3,118 cr. Revenue beat; adjusted PAT was in line.
Positives
- India business growing 17%, ahead of the market [3]
- Revenue ahead of guidance and estimates [9][10]
- Adjusted profit steady despite US pressure [2]
Concerns
- US generics shrinking (−8%) [1]
- Specialty growth slowing to single digits [3]
- Repeated legal settlement charges (my view) [2][12]
- Organon integration risk once the deal closes [9]
Things to track in Q3 FY27
- US sales: is lenalidomide erosion bottoming?
- Specialty (innovative medicines) growth
- EBITDA margin vs the 29–31% range
- Organon closing timeline and financing
Not a buy/sell recommendation. I am not a SEBI-registered analyst. Facts are sourced; opinions are labelled.
Sources [1] Upstox, 30 Oct 2026 · [2] InCred Money – Q2 FY27 · [3] Multibagg – segment details · [4] Goodreturns · [5] Whalesbook · [6] Sun Pharma – Q4 FY26 press release · [7] Free Press Journal – Q4 FY26 · [8] Angel One – FY26 · [9] AlphaSpread – Q4 FY26 call · [10] Multibagg – estimates · [11] Evening market wrap, 30 Oct 2026 (this series) · [12] Business Standard – FY25 settlement charge · [13] Business Standard/PTI – FY24 · [14] ChartAlert – FY26 · [15] MarketsMojo – Q3/Q4 FY26
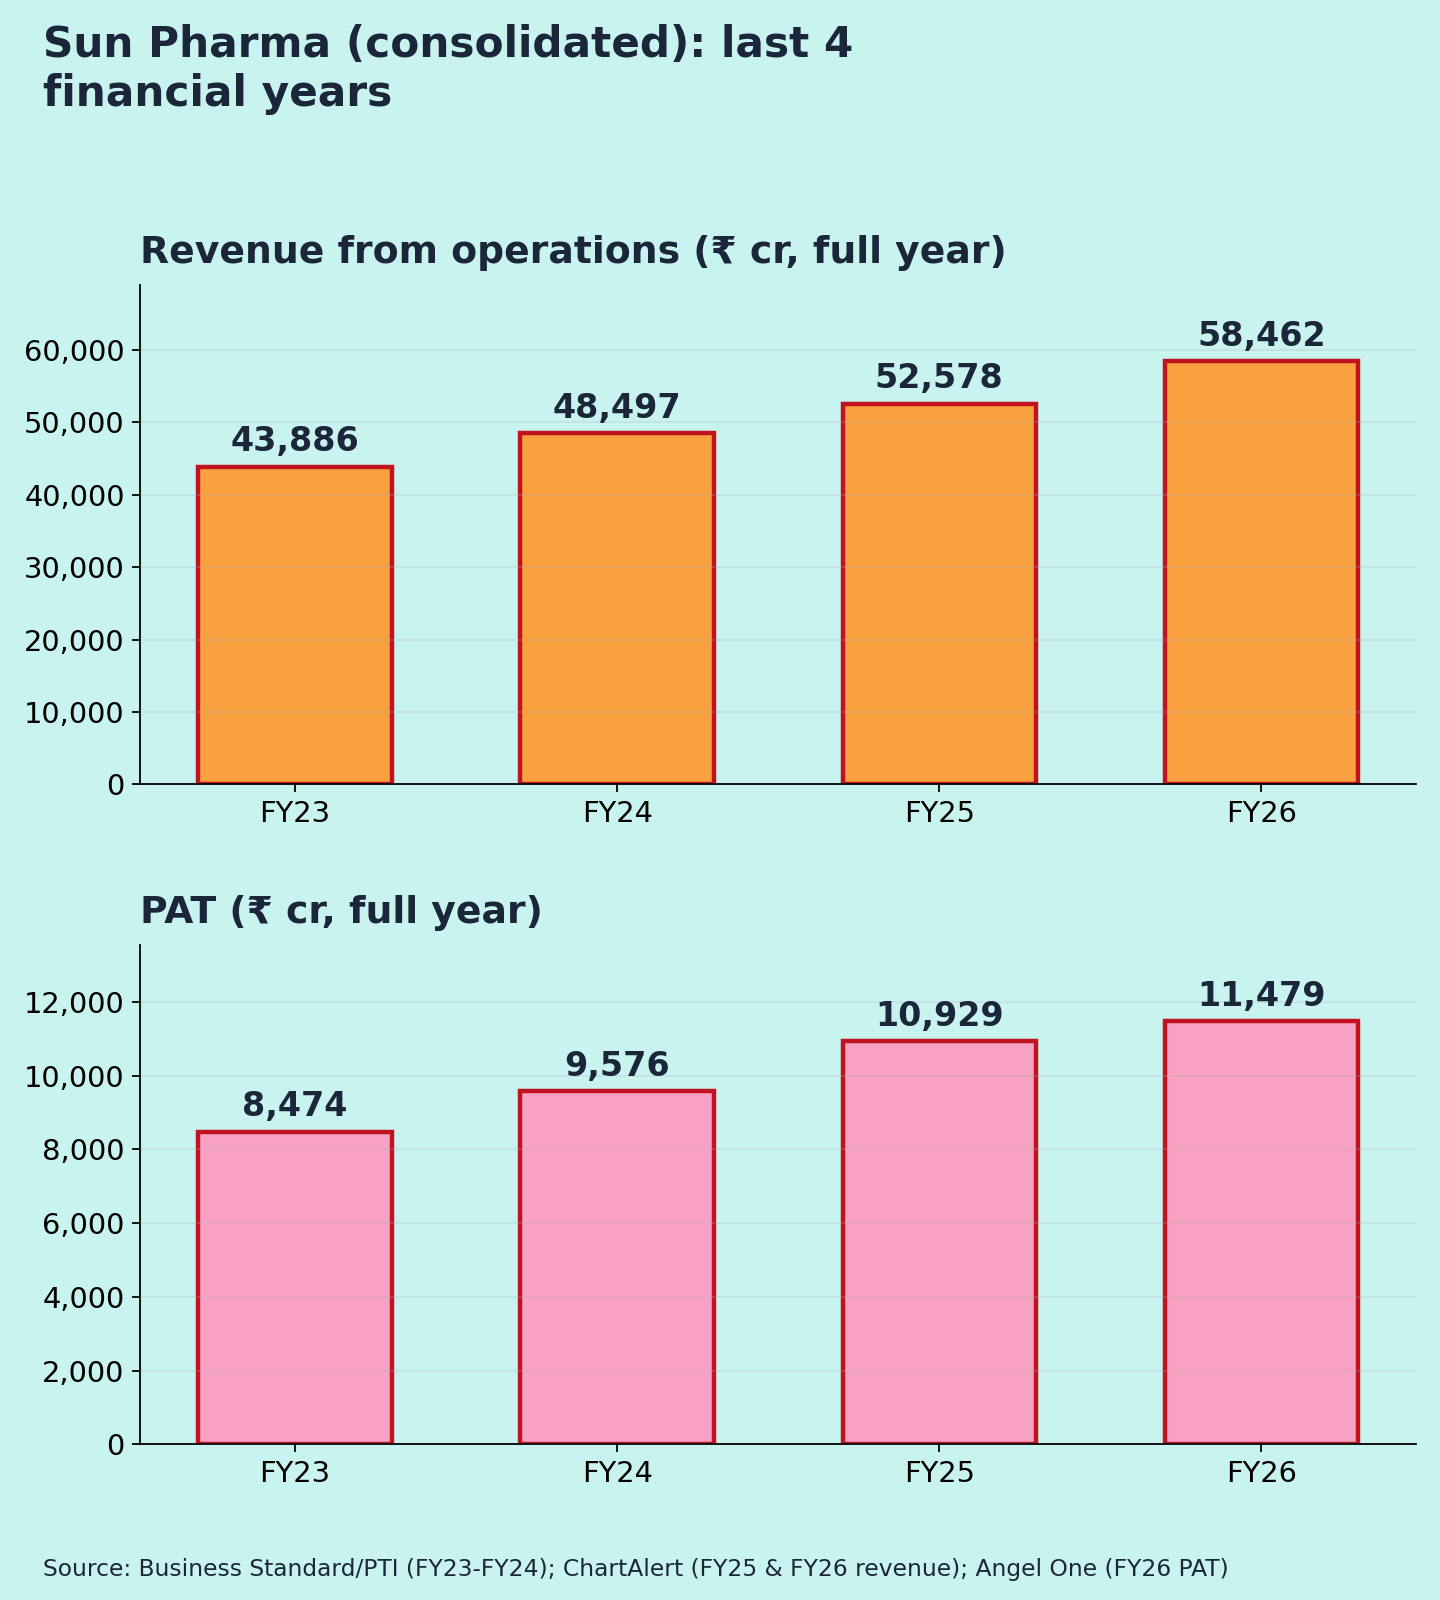
Charts: (1) last 5 quarters revenue & reported PAT [1][2][7][15]; (2) FY23–FY26 revenue & PAT [8][13][14]; (3) EBITDA margin [1][7][8] (Q3 FY26 and Q1 FY27 derived) and PAT margin (own calc.).