Consolidated figures, ₹ crore. Results were filed on 4 Nov 2026.
At the time of writing, coverage of the filing gives revenue, PAT and the dividend.
Q2 EBITDA, other income and tax aren't covered yet. EPS marked "≈" is derived. YoY/QoQ % and margins are my calculations.
| Metric | Q2 FY27 | YoY | QoQ |
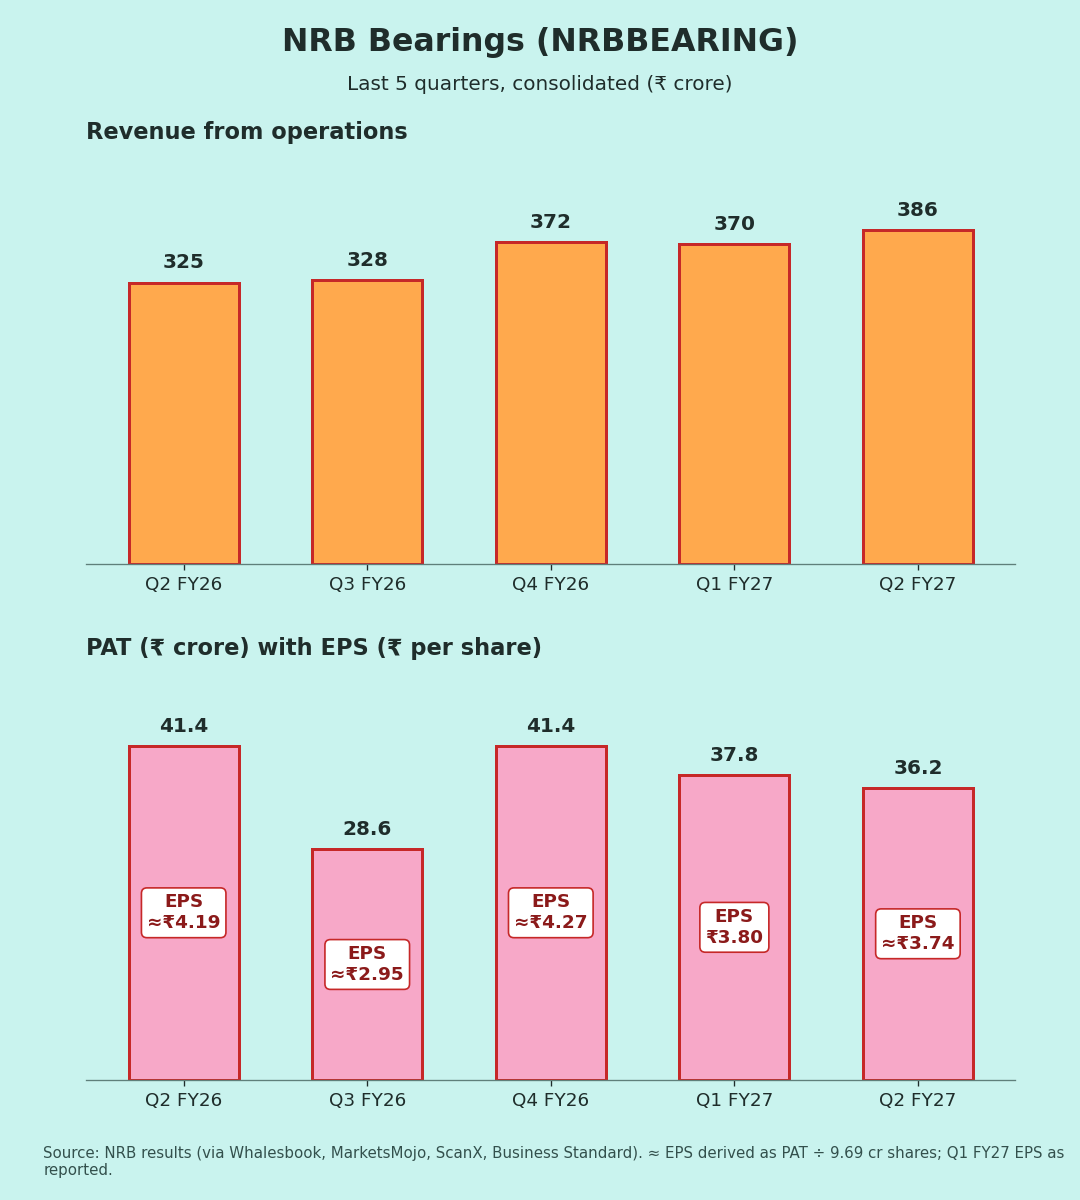
| Revenue from ops | 386.4 | +18.8% | +4.6% |
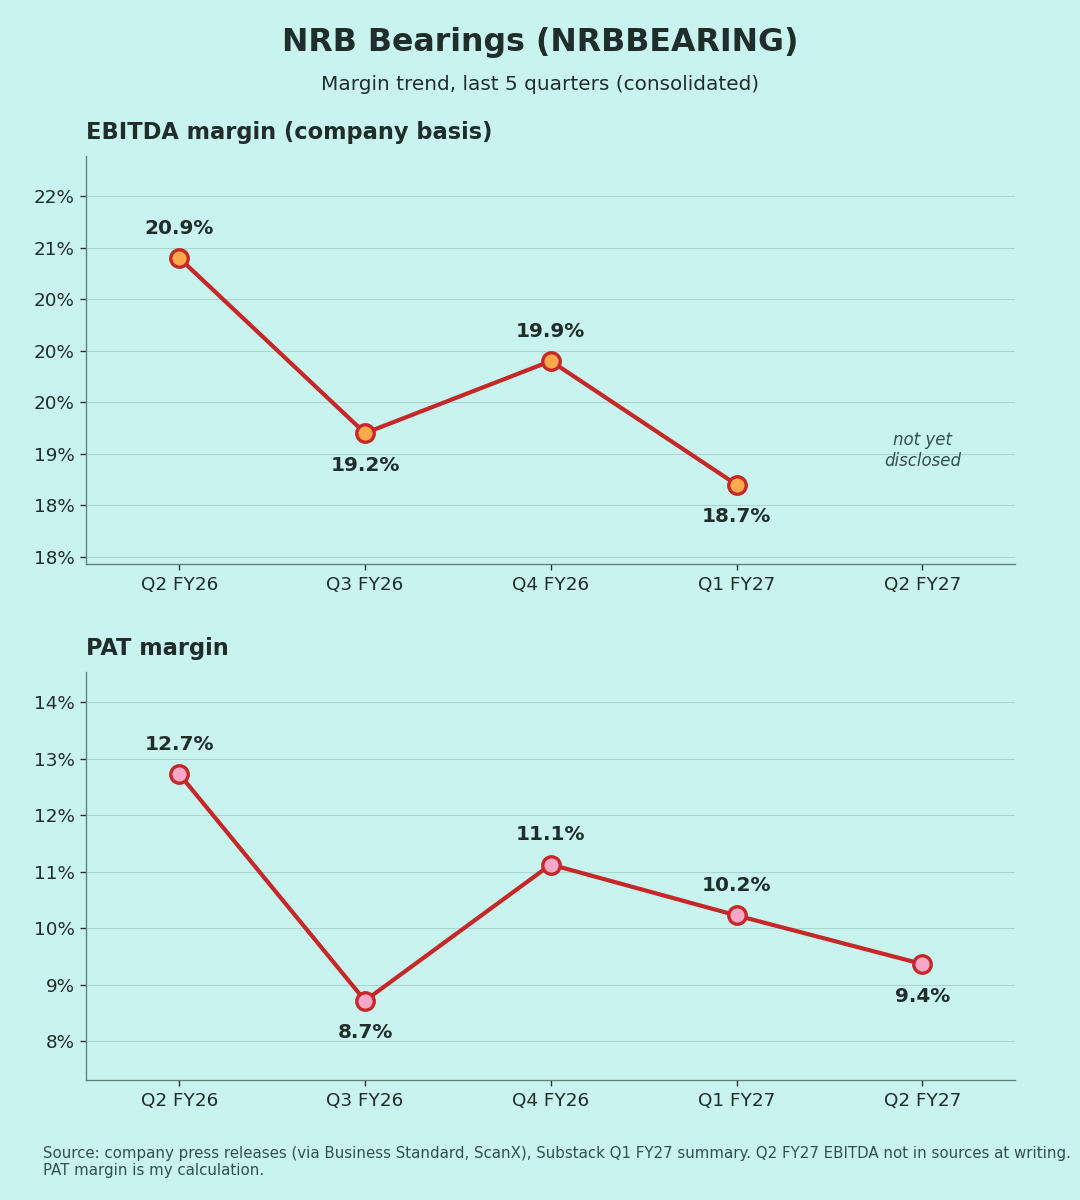
| EBITDA margin | not yet available | 20.9% | 18.7% |
| PAT | 36.2 | −12.5% | −4.0% |
| PAT margin | 9.4% | 12.7% | 10.2% |
| EPS (₹) | ≈3.74 | ≈4.19 | 3.80 |
| H1 FY27 revenue / PAT | 755.9 / 74.0 | +19% / ~flat | – |
Year-ago and last-quarter values are shown for EBITDA margin, PAT margin and EPS.
Quality of earnings
Revenue grew 19%, but PAT fell 12.5% [1]. Coverage of the filing points to rising operating costs [1]. In Q1, management named electricity and logistics as the cost pressure points [3]. The Q2 EBITDA line isn't available yet, so I can't say how much of the drop is at the operating level and how much is below it. Readers, please add in reply if you have the numbers.
The quarter was already softening:
- Q1 FY27: revenue grew 19% but EBITDA only ~14%, and the margin slipped to 18.7% from 19.6% [5].
- Q2 FY27: the gap widened, with profit now falling despite higher sales.
Base effect: Q2 FY26 was a strong quarter, with a 20.9% EBITDA margin and PAT up 15% YoY [2]. That high base adds to the YoY fall.
H1 revenue is up 19%, while H1 PAT is roughly flat at ~₹74 cr against ~₹74 cr a year ago (my calculation from [1][3]).
Margins (Chart 3)
EBITDA margin over four reported quarters: 20.9% → 19.2% → 19.9% → 18.7% [2][4][5]. Q2 FY27 is not yet available. PAT margin fell from 12.7% to 9.4% over the year (my calculation).
Guidance: what changed
- Long-term: ₹2,500 cr+ revenue by 2031, with a first-phase ₹200 cr capex announced in Nov 2025 [2].
- Q1 FY27 commentary: a ₹1,100 cr order pipeline, ~₹400 cr capex and a ₹3,000 cr longer-term revenue vision [5], plus EBITDA margin of 18–20% over the long term [3].
- My reading: Q2's lower profit sits below the momentum those targets imply. Margin data for Q2 will show whether the 18–20% band still holds.
- Industrial bearings: about 14% of revenue in Q1, up from 11%. Aerospace, defence and robotics are newer areas [5].
- Dividend: interim ₹2.50 per share, record date 11 Nov.
Positives
- Revenue +19% YoY, the highest quarterly revenue in the series
- Industrial share rising (as of Q1)
- Low debt: net debt-to-equity 0.06 at end-FY26
Concerns
- PAT down despite strong sales growth [1]
- Two quarters of margin pressure [3][5]
- Q2 cost breakdown not yet available (my view)
Things to track in Q3 FY27
- EBITDA margin vs the 18–20% long-term band
- Electricity, logistics and raw-material costs
- Order pipeline conversion and capex progress
- Industrial and new-segment share of revenue
Not a buy/sell recommendation. I am not a SEBI-registered analyst. Facts are sourced; opinions are labelled.
Sources [1] Whalesbook – Q2 FY27 filing, 4 Nov 2026 · [2] Business Standard – Q2 FY26 · [3] ScanX – Q1 FY27 results · [4] MarketsMojo – Q4 FY26 quarterly table · [5] Substack (R. Vaidyanathan) – Q1 FY27 analysis · [6] ScanX – FY26 results & EBITDA · [7] ICICI Direct – Q2 FY26 note (FY23–FY25) · [8] ICICI Direct – Q4 FY26 summary
Charts:
(1) last 5 quarters revenue, PAT and EPS
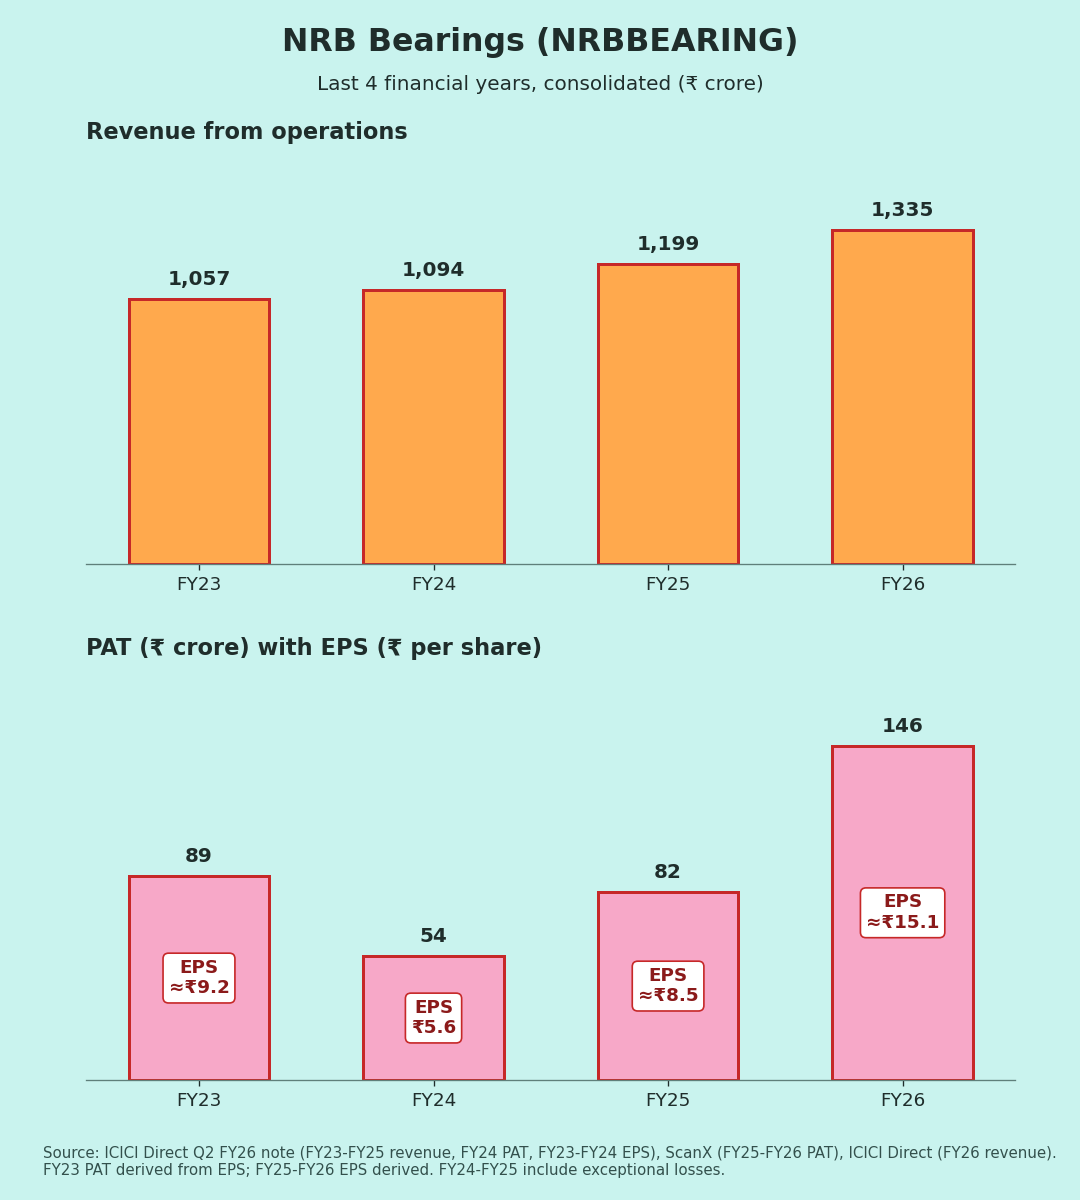
(2) FY23–FY26 revenue, PAT and EPS , with FY23 PAT and FY25–FY26 EPS derived
(3) EBITDA margin and PAT margin (own calc.).