Mastek (MASTEK): Q2 FY27 results analysis
(Quarter ended 30 Sep 2026)
All figures consolidated, ₹ crore unless stated. Results released around 4:15 PM on 23 Oct 2026, after market close. EBITDA is the company's "operating EBITDA". YoY/QoQ % and ratios are my calculations.
| Metric | Q2 FY27 | YoY | QoQ |
| Revenue from ops | 1,018.7 | +8.3% | +3.4% |
| Operating EBITDA | 146.2 | −0.1% | −3.9% |
| EBITDA margin | 14.4% | 15.6% | 15.4% |
| PAT (reported) | 105.7 | +8.5% | −0.2% |
| PAT excl. net exceptional gain (approx.) | ~95 | ~−2% | ~−10% |
| PAT margin (on revenue) | 10.4% | 10.4% | 10.7% |
| Other income | 11.7 | – | – |
For margin rows, the YoY and QoQ columns show the prior-period value. "PAT excl. gain" simply subtracts the ₹10.7 cr net exceptional gain, without adjusting for tax (my rough calculation).
Quality of earnings
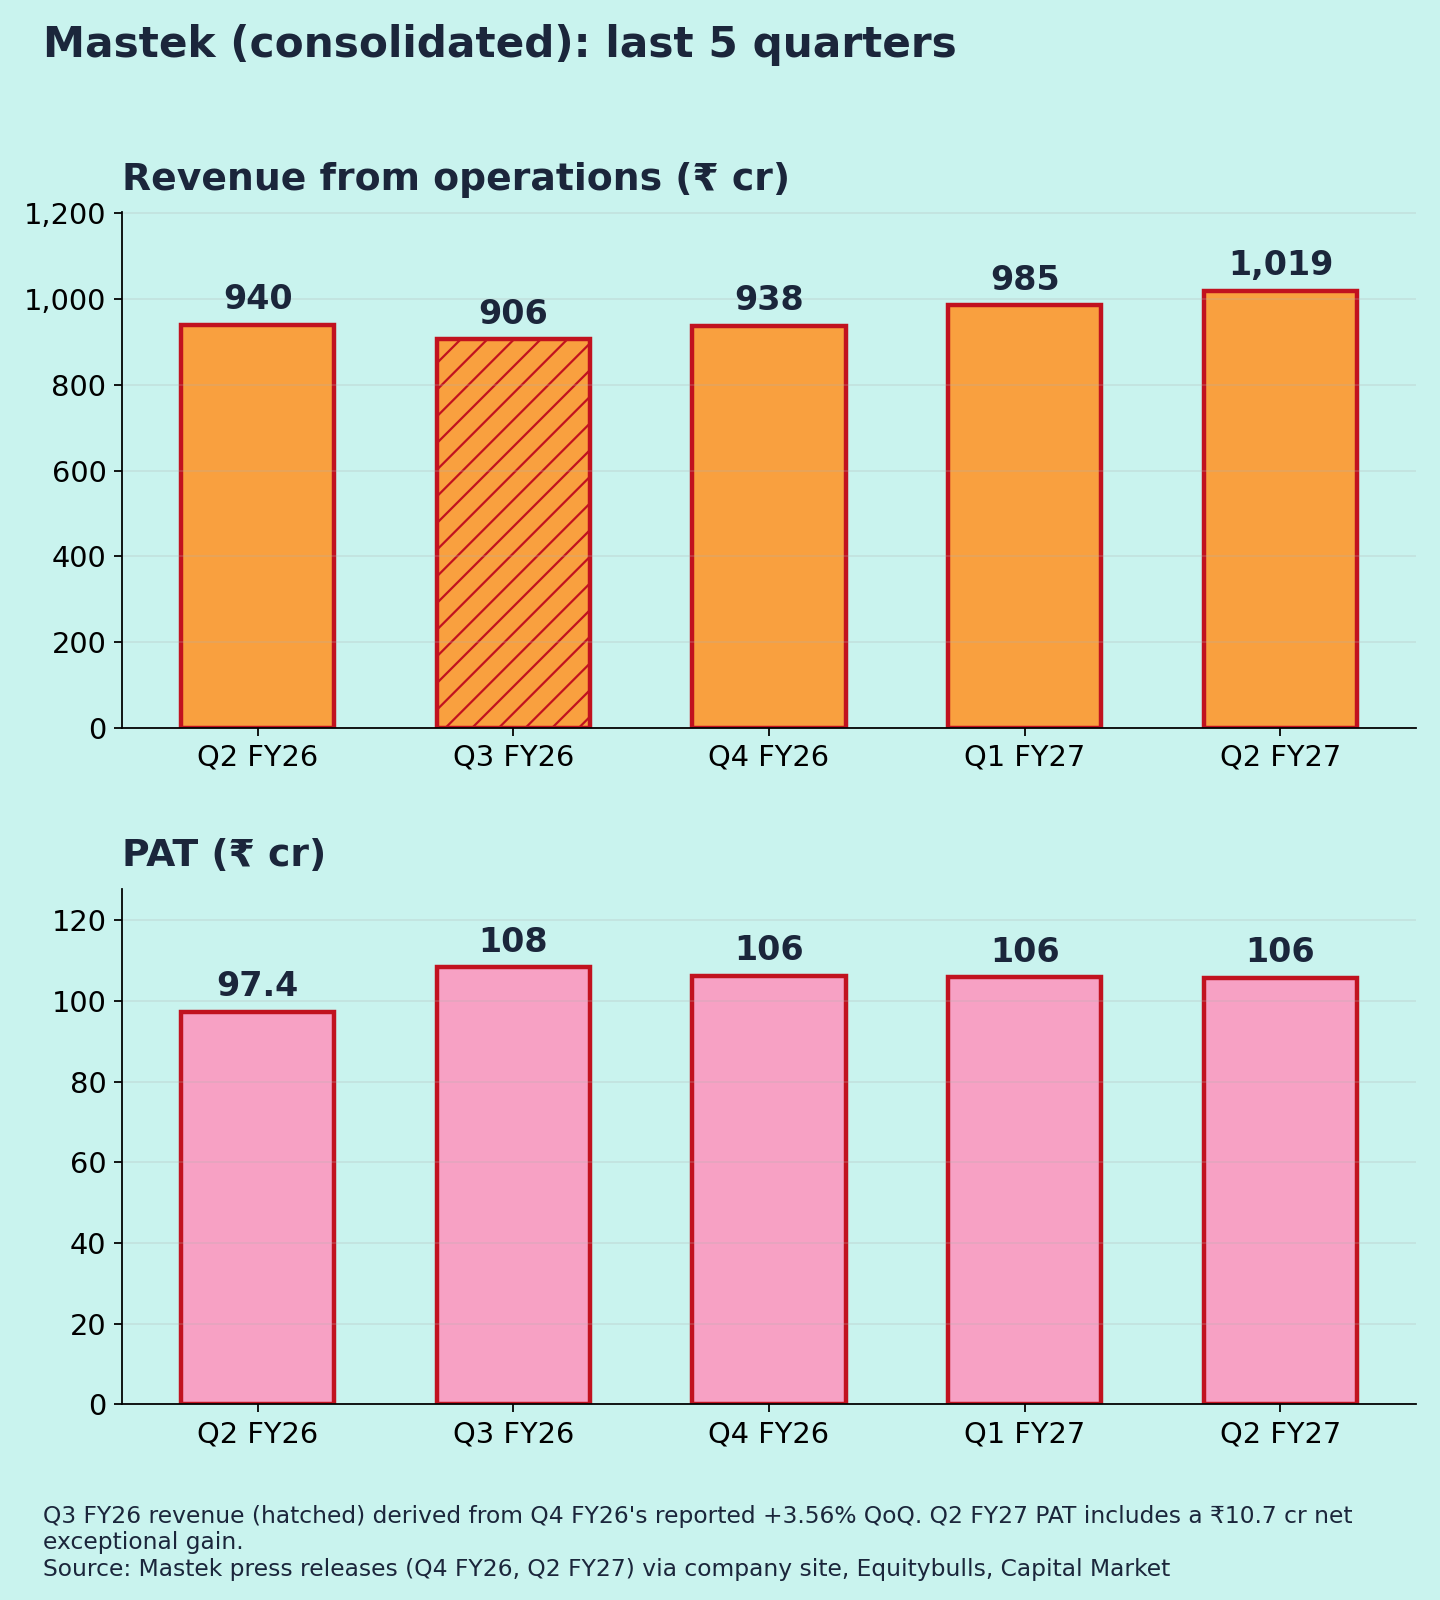
The headline profit is helped by a one-off. A net exceptional gain of ₹10.7 cr supported PAT [2]. It came from property gains, partly offset by restructuring write-offs [3]. The company completed a ₹60 cr sale of a Chennai property during the year [8]. Without the gain, profit was roughly flat to slightly down YoY (my calculation).
- Other income: ₹11.7 cr (total income ₹1,030.4 cr [4] minus revenue).
- Currency: constant-currency growth was 2.4% QoQ [4], against 3.4% in rupees. Part of the growth came from a weaker rupee (my reading).
- Concentration: UK & Europe is 67.8% of revenue [11].
Base effect: Q2 FY26 was a normal quarter (15.6% margin) [1]. The YoY margin decline of ~120 bps is real.
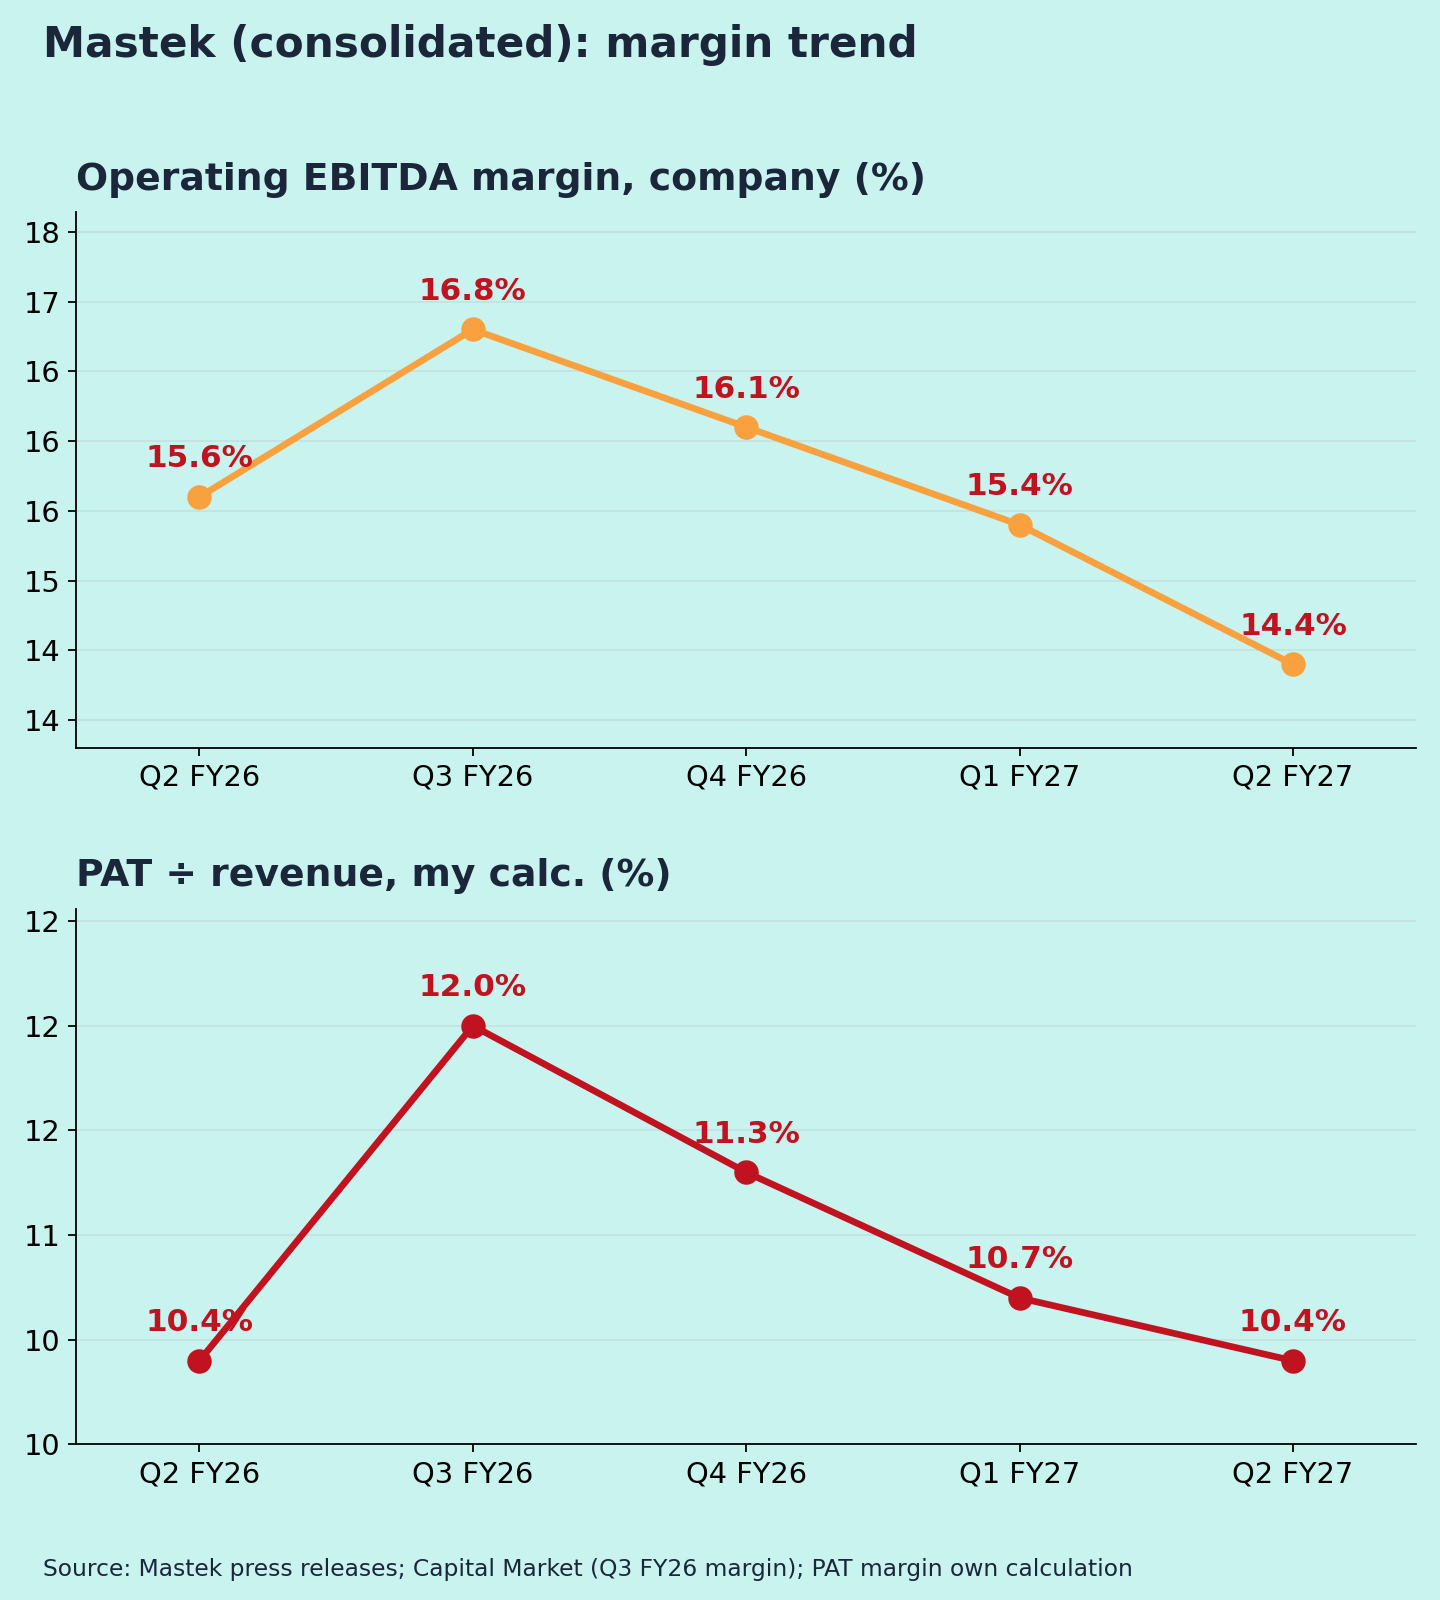
Margins (Chart 3)
Operating EBITDA margin over five quarters: 15.6% → 16.8% → 16.1% → 15.4% → 14.4%. That is three quarters of decline. Management attributes Q2 to annual salary increments. Q1 had also absorbed wage hikes and ESOP costs.
Guidance: what changed
- Growth: after Q1, management said FY27 would beat FY26 [7]. It expected a return to sequential growth from Q2, with a ramp-up in H2 [10]. Q2 delivered +3.4% in rupees and +2.4% in constant currency [4], so it is on track.
- Order backlog: ₹2,935.2 cr at end-Q1, +25% YoY [7]. I couldn't find the Q2 figure in the coverage available.
- AI deals: 53 new AI deals signed in Q2 [4].
- Margins: no numeric margin guidance in the coverage I found.
Positives
- Sequential growth resumed, as guided [4][10]
- Strong AI deal momentum [4]
- Backlog up 25% YoY at end-Q1 [7]
Concerns
- EBITDA margin down for three straight quarters [1][5]
- Profit flat once the one-off gain is excluded (my calculation)
- Heavy dependence on the UK & Europe [11]
Things to track in Q3 FY27
- EBITDA margin recovery after the increment impact
- Constant-currency growth: does the H2 ramp-up arrive?
- Q2 and Q3 order backlog
- Any further restructuring costs
Not a buy/sell recommendation. I am not a SEBI-registered analyst. Facts are sourced; opinions are labelled.
Sources [1] Equitybulls – Mastek Q2 FY27 press release · [2] Multibagg – Q2 FY27 results · [3] Whalesbook – exceptional items · [4] Investywise – Q2 FY27 presentation · [5] Muthoot/Capital Market – Q4 FY26 · [6] Mastek – Q4 FY26 press release · [7] Sahi – Q1 FY27 outlook · [8] Sahi – Chennai property sale · [9] Mastek – Q4 FY24 press release · [10] Quartr – Q1 FY27 summary · [11] Multibagg – Q2 FY27 summary · [12] Trade Brains – market live, 23 Oct
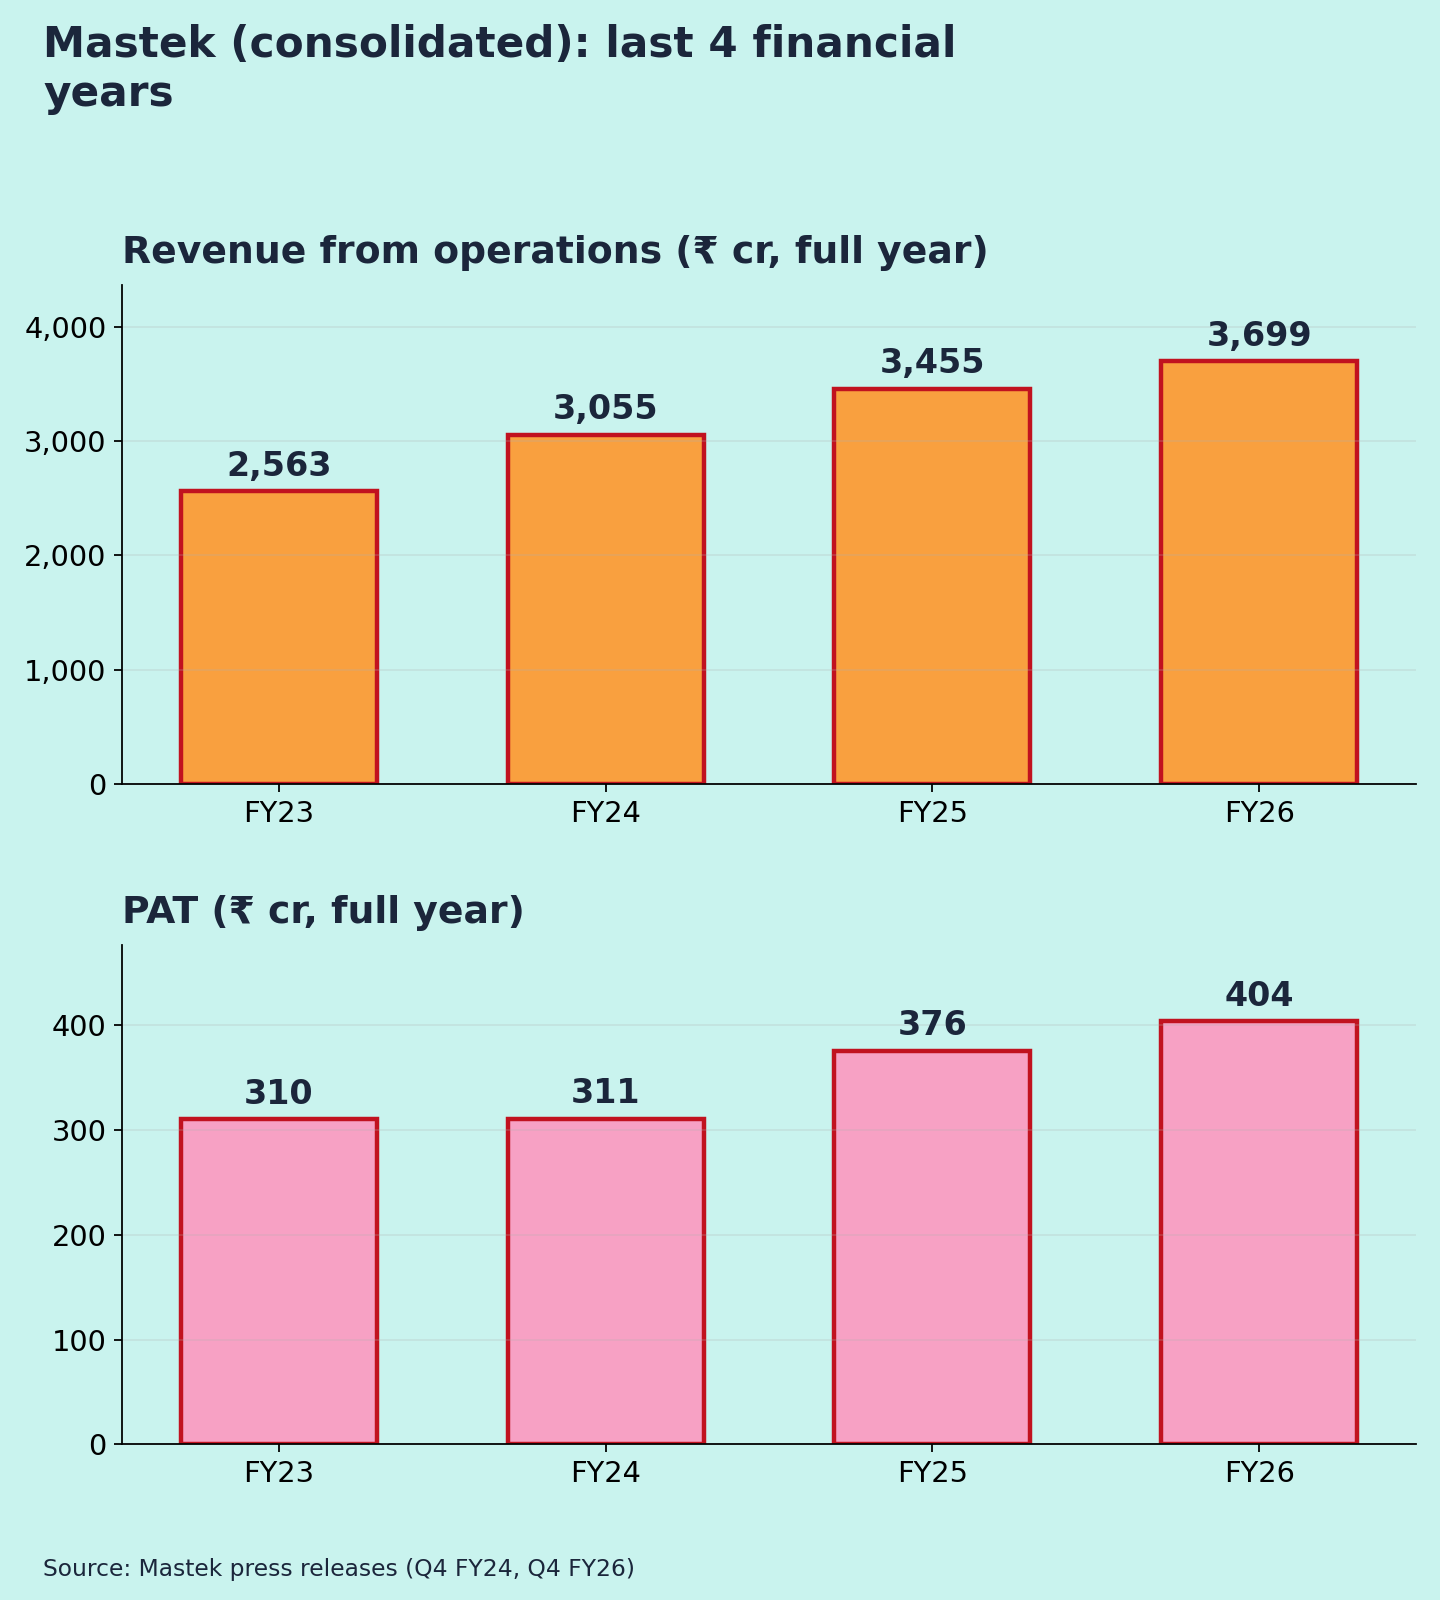
Charts: (1) last 5 quarters revenue & PAT (Q3 FY26 revenue derived from Q4's reported +3.56% QoQ); (2) FY23–FY26 revenue & PAT ; (3) operating EBITDA margin and PAT margin (own calc.).