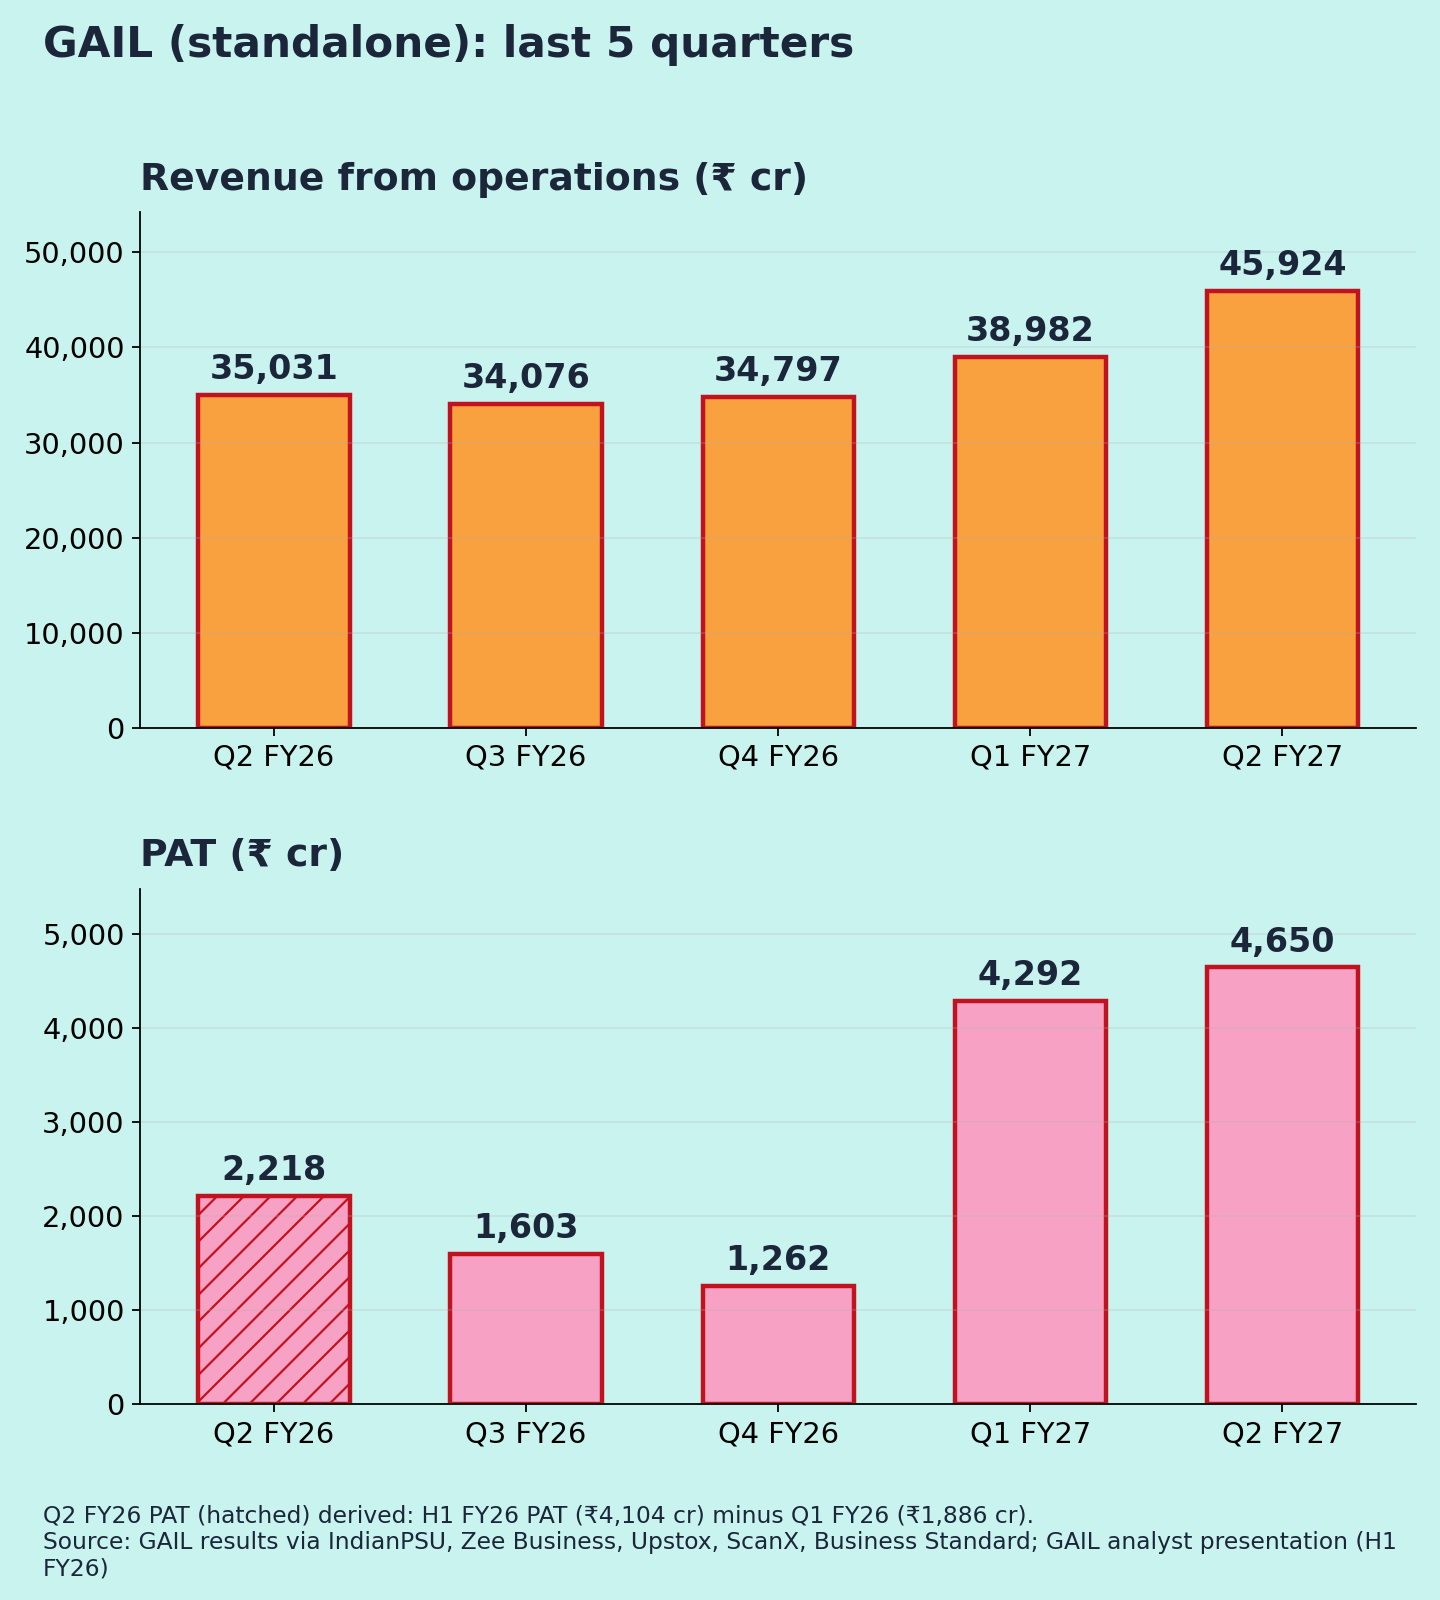
All figures standalone, ₹ crore unless stated. GAIL's segment data and most coverage use this basis; consolidated figures are noted where relevant. Results released on 30 Oct 2026. YoY/QoQ % and margins are my calculations.
| Metric | Q2 FY27 | YoY | QoQ |
| Revenue from ops | 45,923.6 | +31.1% | +17.8% |
| EBITDA | 6,412 | n.a. | ~+0.3% |
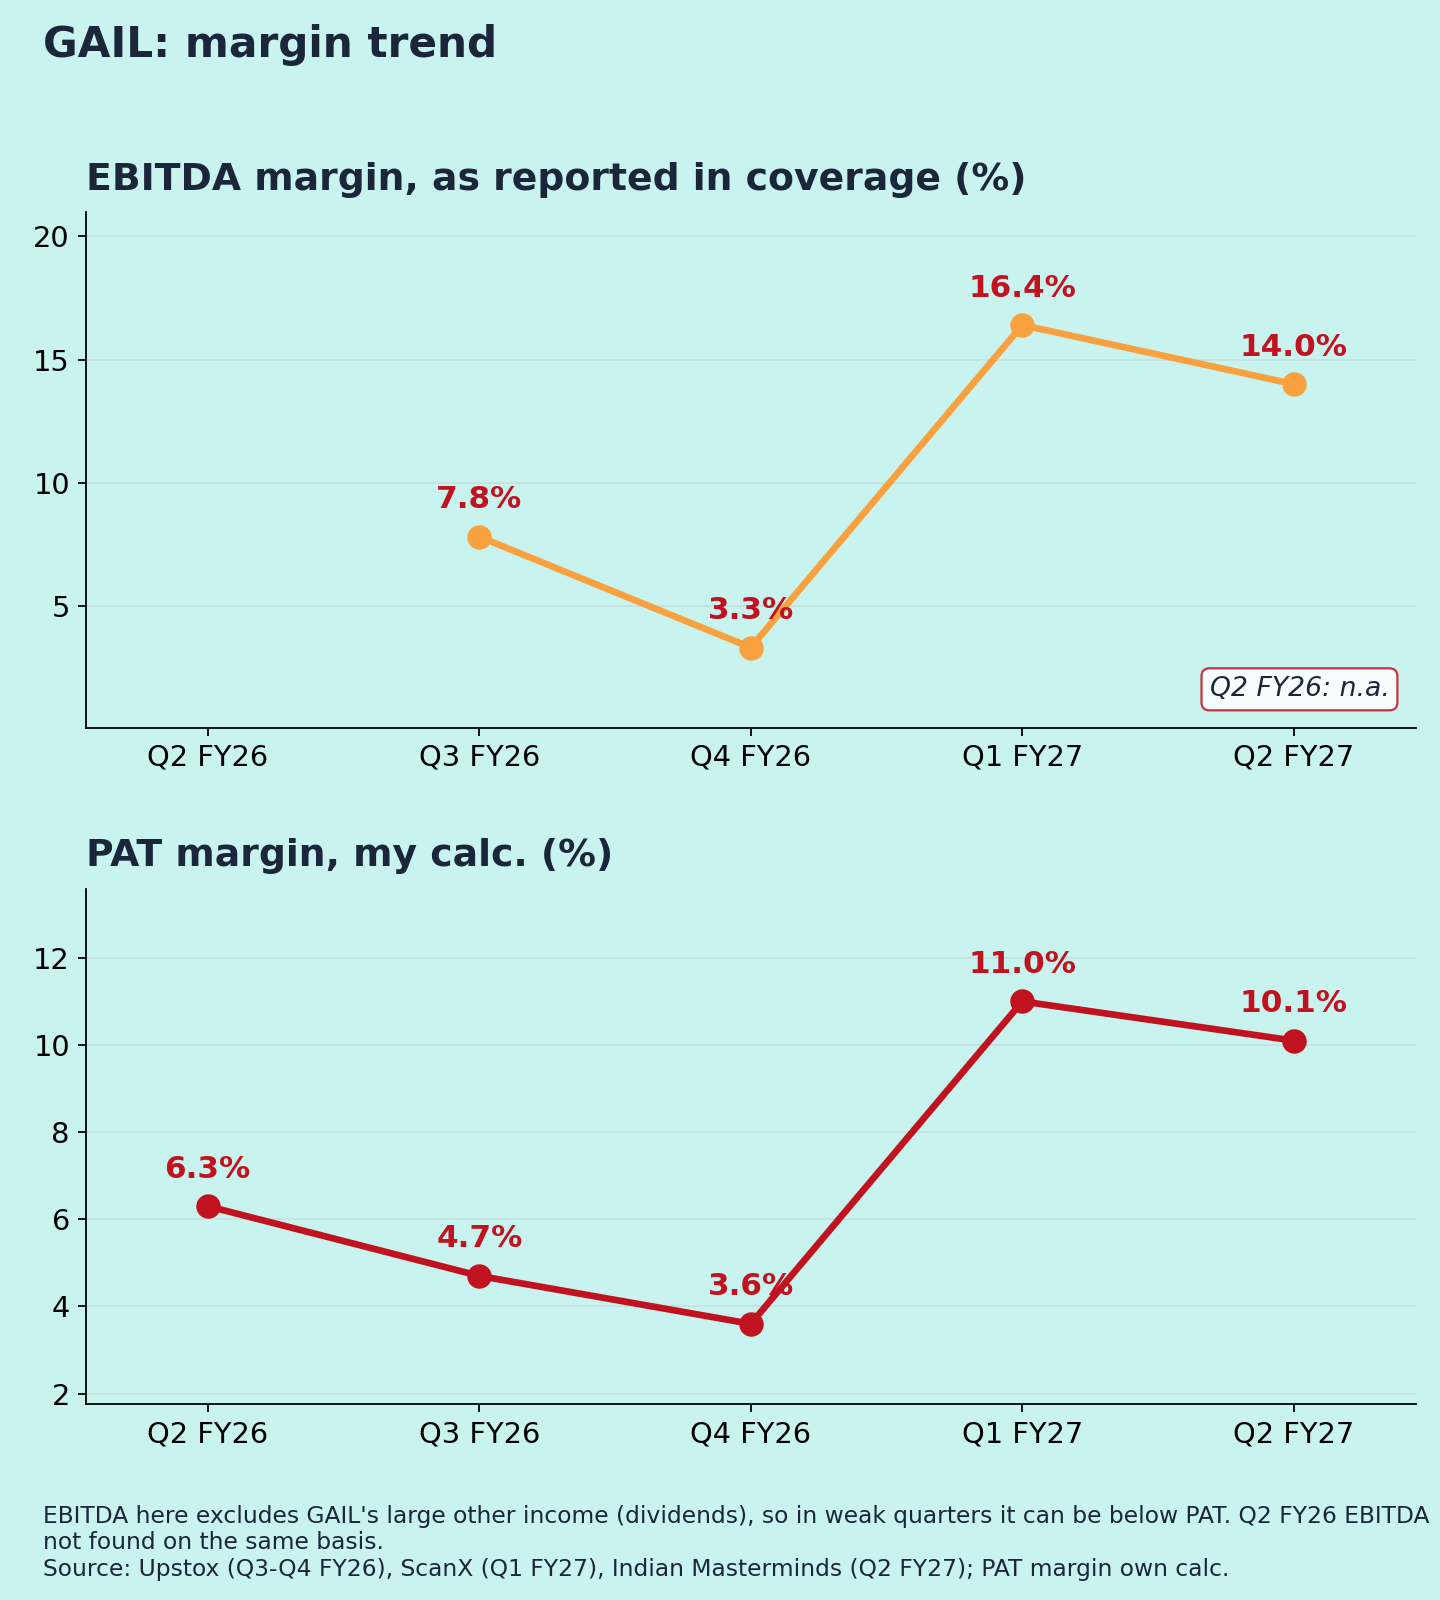
| EBITDA margin | 14.0% | n.a. | 16.4% |
| PBT | 5,838 | – | +1.1% |
| PAT | 4,650.2 | +110% | +8.3% |
| PAT margin | 10.1% | 6.3% | 11.0% |
| Consolidated PAT | 4,719.7 | +139% | – |
For margin rows, the YoY and QoQ columns show the prior-period value. Q2 FY26 standalone PAT (₹2,218 cr) is derived from H1 FY26 (₹4,104 cr) minus Q1 FY26 (₹1,886 cr).
Quality of earnings
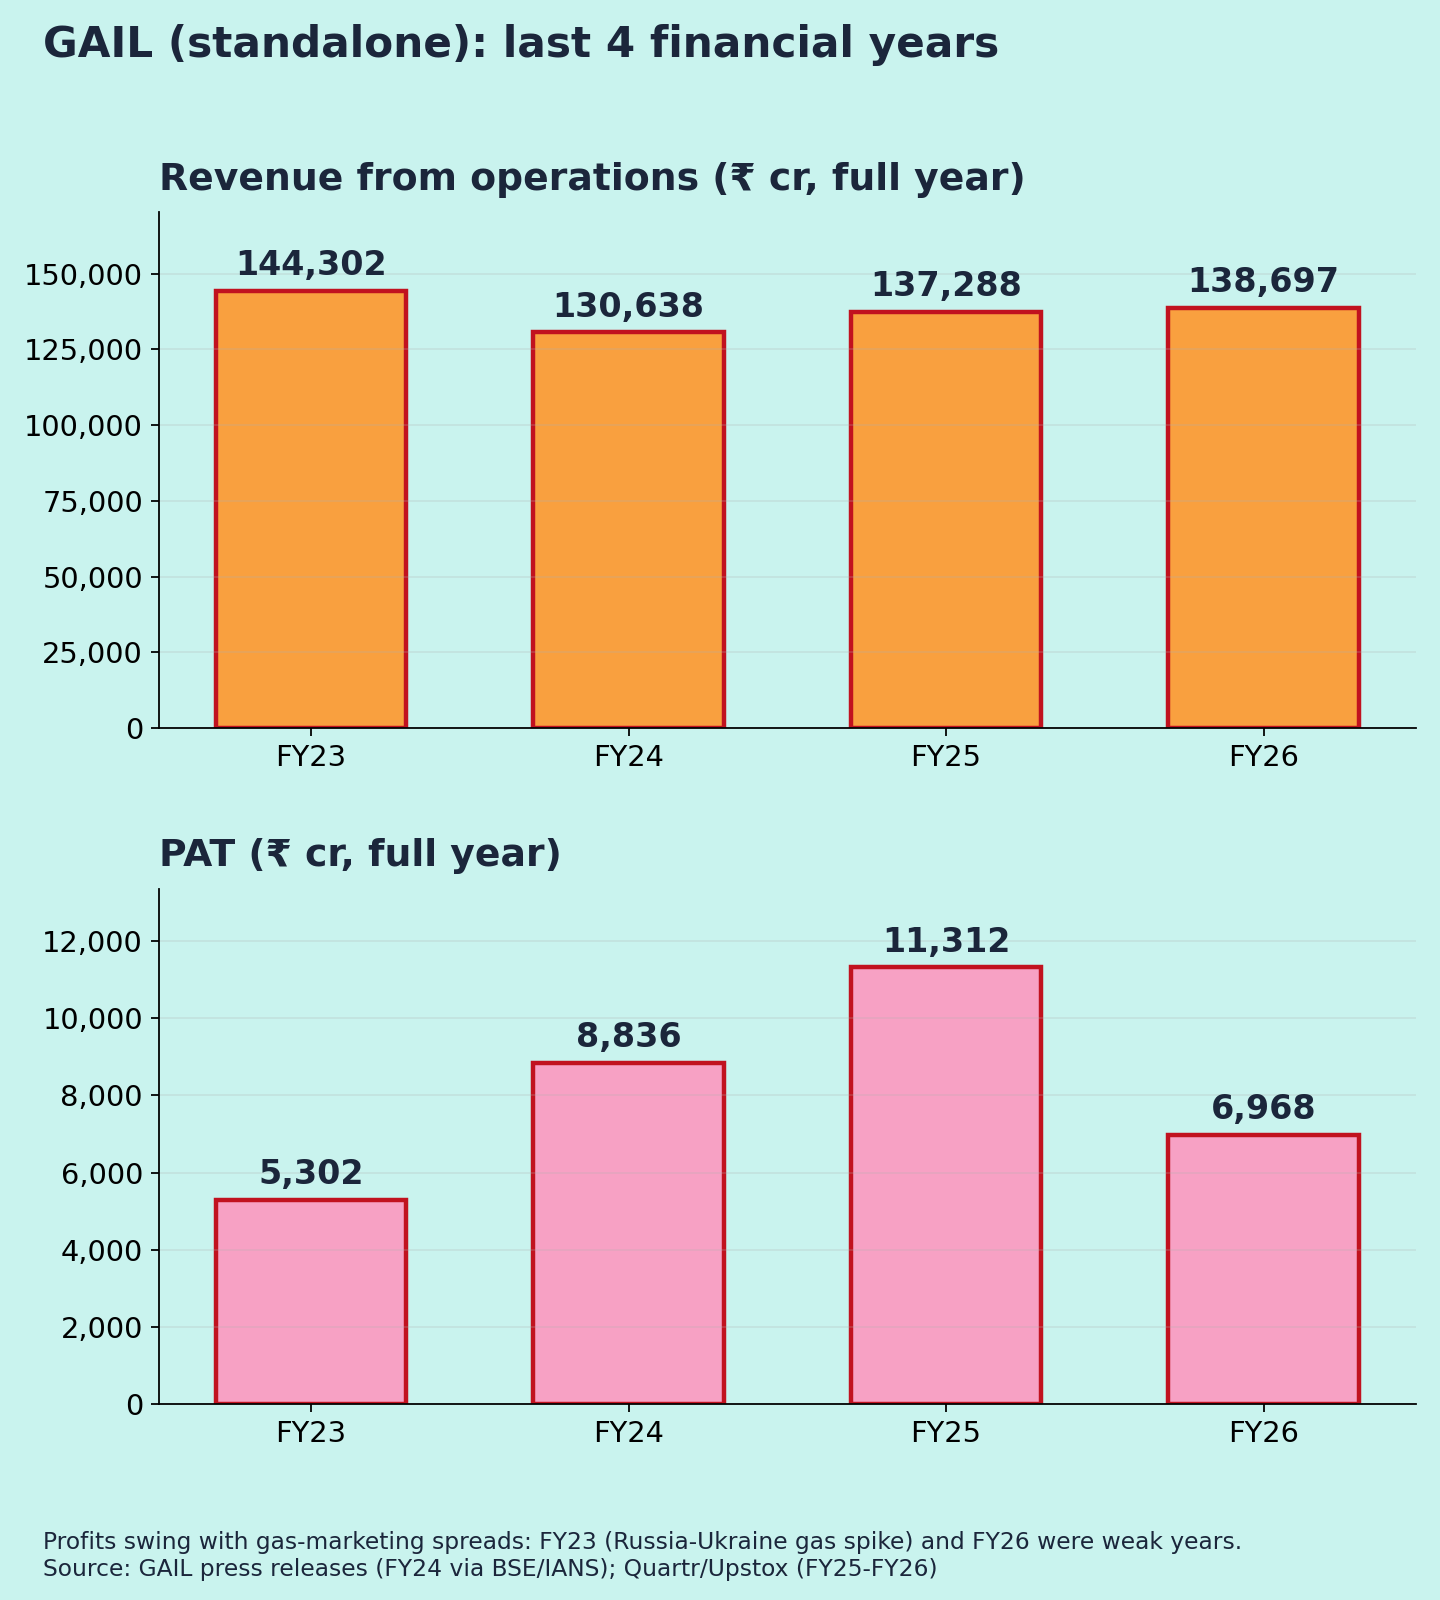
Profit more than doubled YoY, but most of that is a weak base. FY26 was a poor year: standalone PAT fell 38%, as gas-marketing spreads shrank and petrochemicals made losses [6][9].
The quarter beat estimates comfortably: PAT of ₹4,650 cr against ₹3,110 cr expected [3].
QoQ, the picture is flatter:
- Revenue +18%, mostly from natural gas marketing (₹41,226 cr vs ₹34,438 cr) [3]. Higher LNG prices amid the West Asia disruption likely lifted the rupee value of sales (interpretation).
- EBITDA barely moved (~₹6,412 cr) [4], so the margin dipped to 14.0% from 16.4% [10].
- Other segments: transmission revenue rose to ₹3,311 cr from ₹3,042 cr. LPG and liquid hydrocarbons fell to ₹1,834 cr [3].
In H1, gas marketing earned ₹6,766 cr of segment profit, against ₹3,709 cr from regulated transmission [11]. So earnings depend heavily on the more volatile trading business (my view).
Margins (Chart 3)
EBITDA margin, as reported in coverage: n.a. → 7.8% → 3.3% → 16.4% → 14.0% [10][12][4]. PAT margin (my calculation): 6.3% → 4.7% → 3.6% → 11.0% → 10.1%.
These figures exclude GAIL's large other income (mainly dividends from investee companies). So in weak quarters, EBITDA can be lower than PAT [12]. The sharp recovery since Q1 FY27 reflects better gas-marketing spreads (interpretation).
Management commentary
- GAIL Gas IPO: the board gave in-principle approval to list GAIL Gas, its city gas subsidiary, diluting up to 25% [5].
- Guidance: no numeric guidance in the coverage I found.
- H1 volumes: transmission 126 MMSCMD, gas marketing 95 MMSCMD, petrochemical sales 226 TMT [5].
- Projects: investment in a heating unit at the Ratnagiri LNG terminal by June 2027 [4].
Positives
- Profit well above estimates
- Strong sequential revenue growth
- GAIL Gas IPO could unlock value (my view)
Concerns
- Earnings depend on volatile gas-marketing spreads
- EBITDA flat QoQ despite 18% revenue growth
- LPG and liquid hydrocarbons revenue declining
Things to track in Q3 FY27
- Gas-marketing spreads as LNG prices move
- Transmission volumes and tariff revisions
- Petrochemical segment profitability
- GAIL Gas IPO timeline
Not a buy/sell recommendation. Facts are sourced; opinions are labelled.
Sources [1] IndianPSU, 30 Oct 2026 · [2] Asianet/ANI – PBT, H1 · [3] Zee Business – segments, estimates · [4] Indian Masterminds – EBITDA · [5] Kotak Neo – GAIL Gas IPO, volumes, price · [6] Upstox – Q4 FY26 / FY26 · [7] GAIL – analyst presentation, Oct 2025 (H1 FY26) · [8] GAIL – Q1 FY26 investor presentation · [9] ChartAlert – FY26 · [10] ScanX – Q1 FY27 · [11] InvestyWise – H1 segment results · [12] Multibagg – Q4 FY26 · [13] GAIL – FY24 press release · [14] Quartr – FY26 summary · [15] ScanX – Q4 FY26 / Q3 FY26
Charts: (1) last 5 quarters revenue & PAT [1][6][7][8][10][15]; (2) FY23–FY26 revenue & PAT [13][14]; (3) EBITDA margin as reported in coverage [4][10][12] and PAT margin (own calc.).