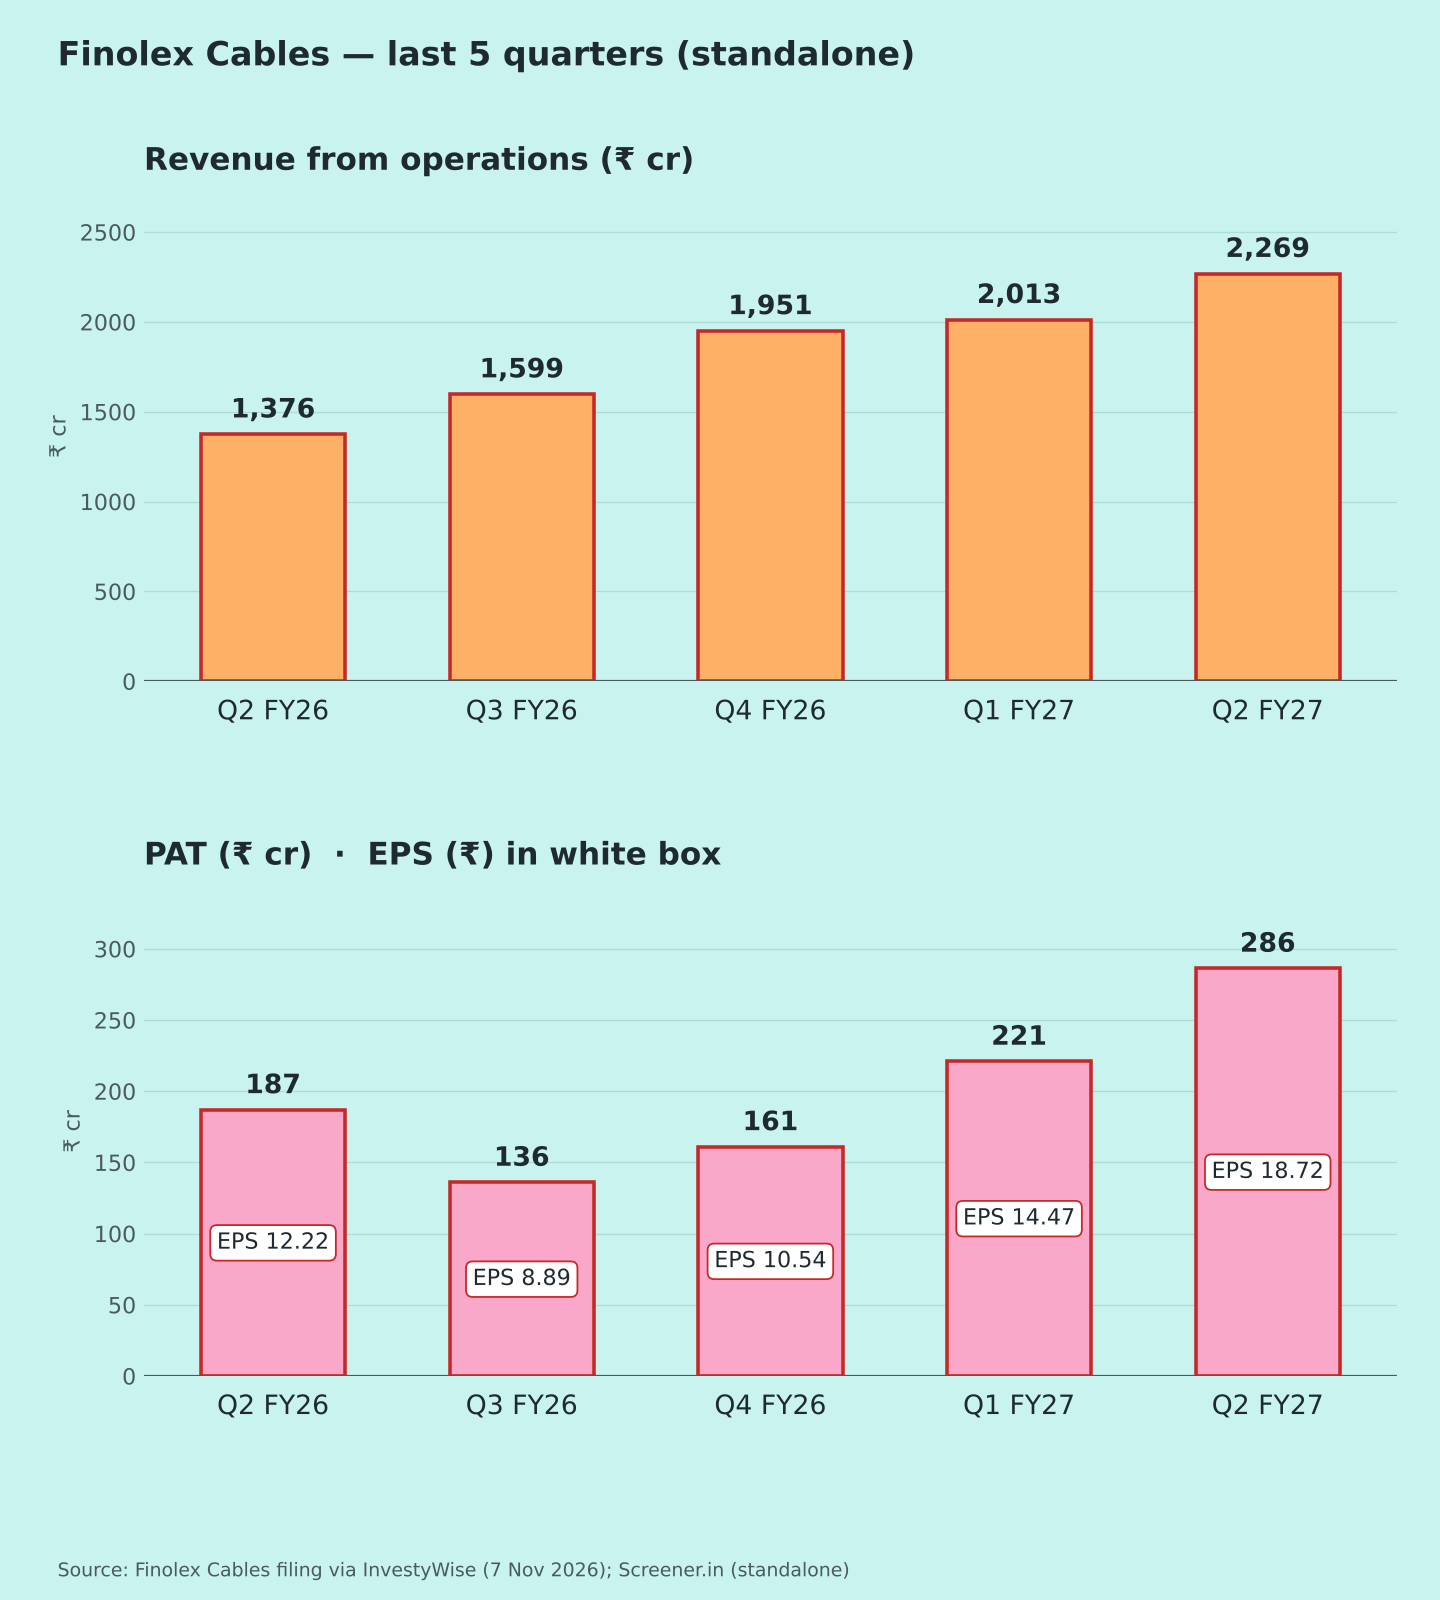
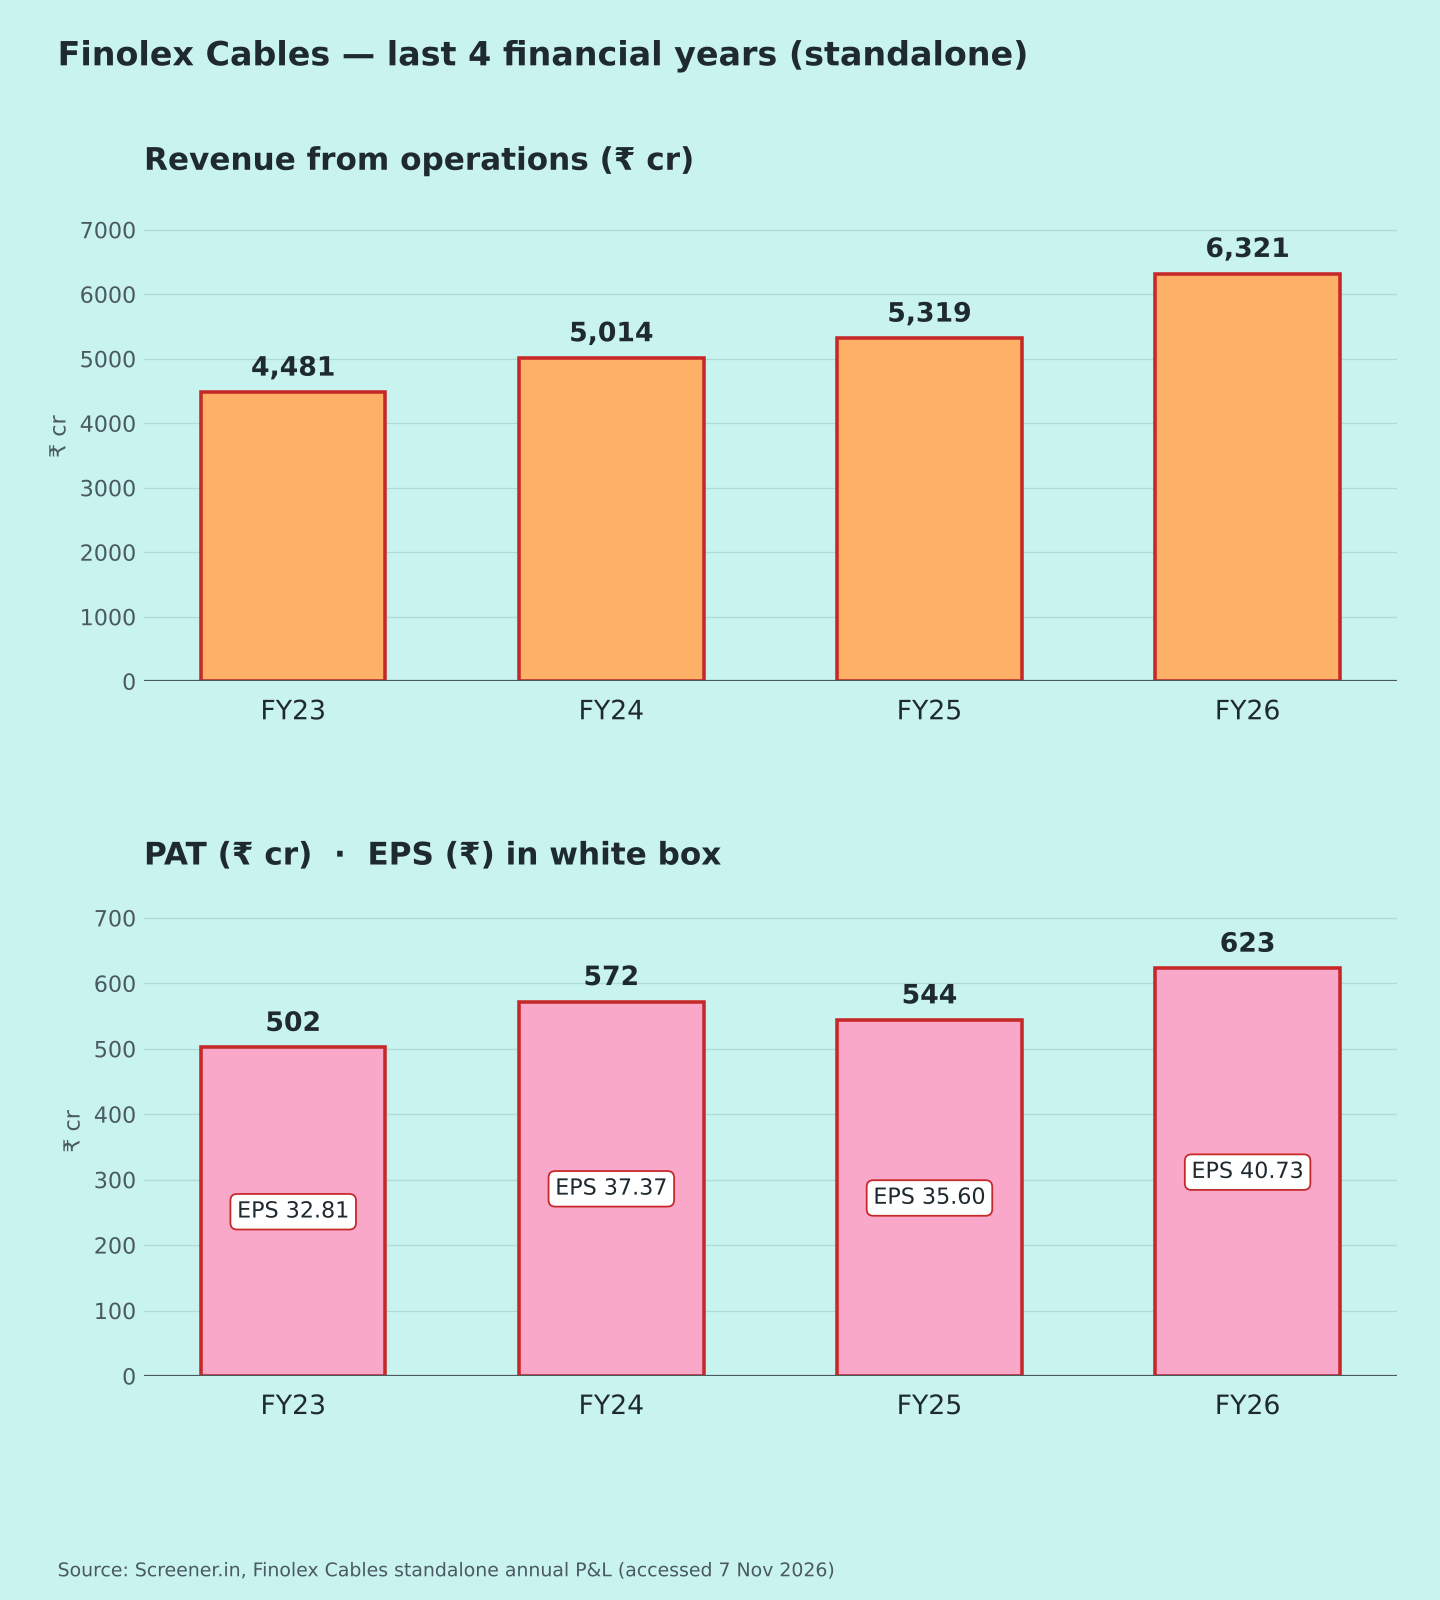
Standalone figures, ₹ crore. These are the company's headline figures and match the history used. Results announced 7 Nov 2026 [1]. PAT = standalone PAT. EBITDA is left out: Q2 depreciation wasn't in coverage. Instead, I use "core profit" (PBT minus other income), which every quarter has. Q2 other income is derived.
| Metric | Q2 FY27 | YoY | QoQ |
| Revenue from ops | 2,269.3 | +64.9% | +12.7% |
| Other income (≈ derived) | ≈88.7 | ≈−19% | ≈+74% |
| PBT | 374.65 | +56.8% | +35.3% |
| Core profit: PBT excl. other income (≈) | ≈286 | ≈+122% | ≈+27% |
| PAT | 286.34 | +53.1% | +29.6% |
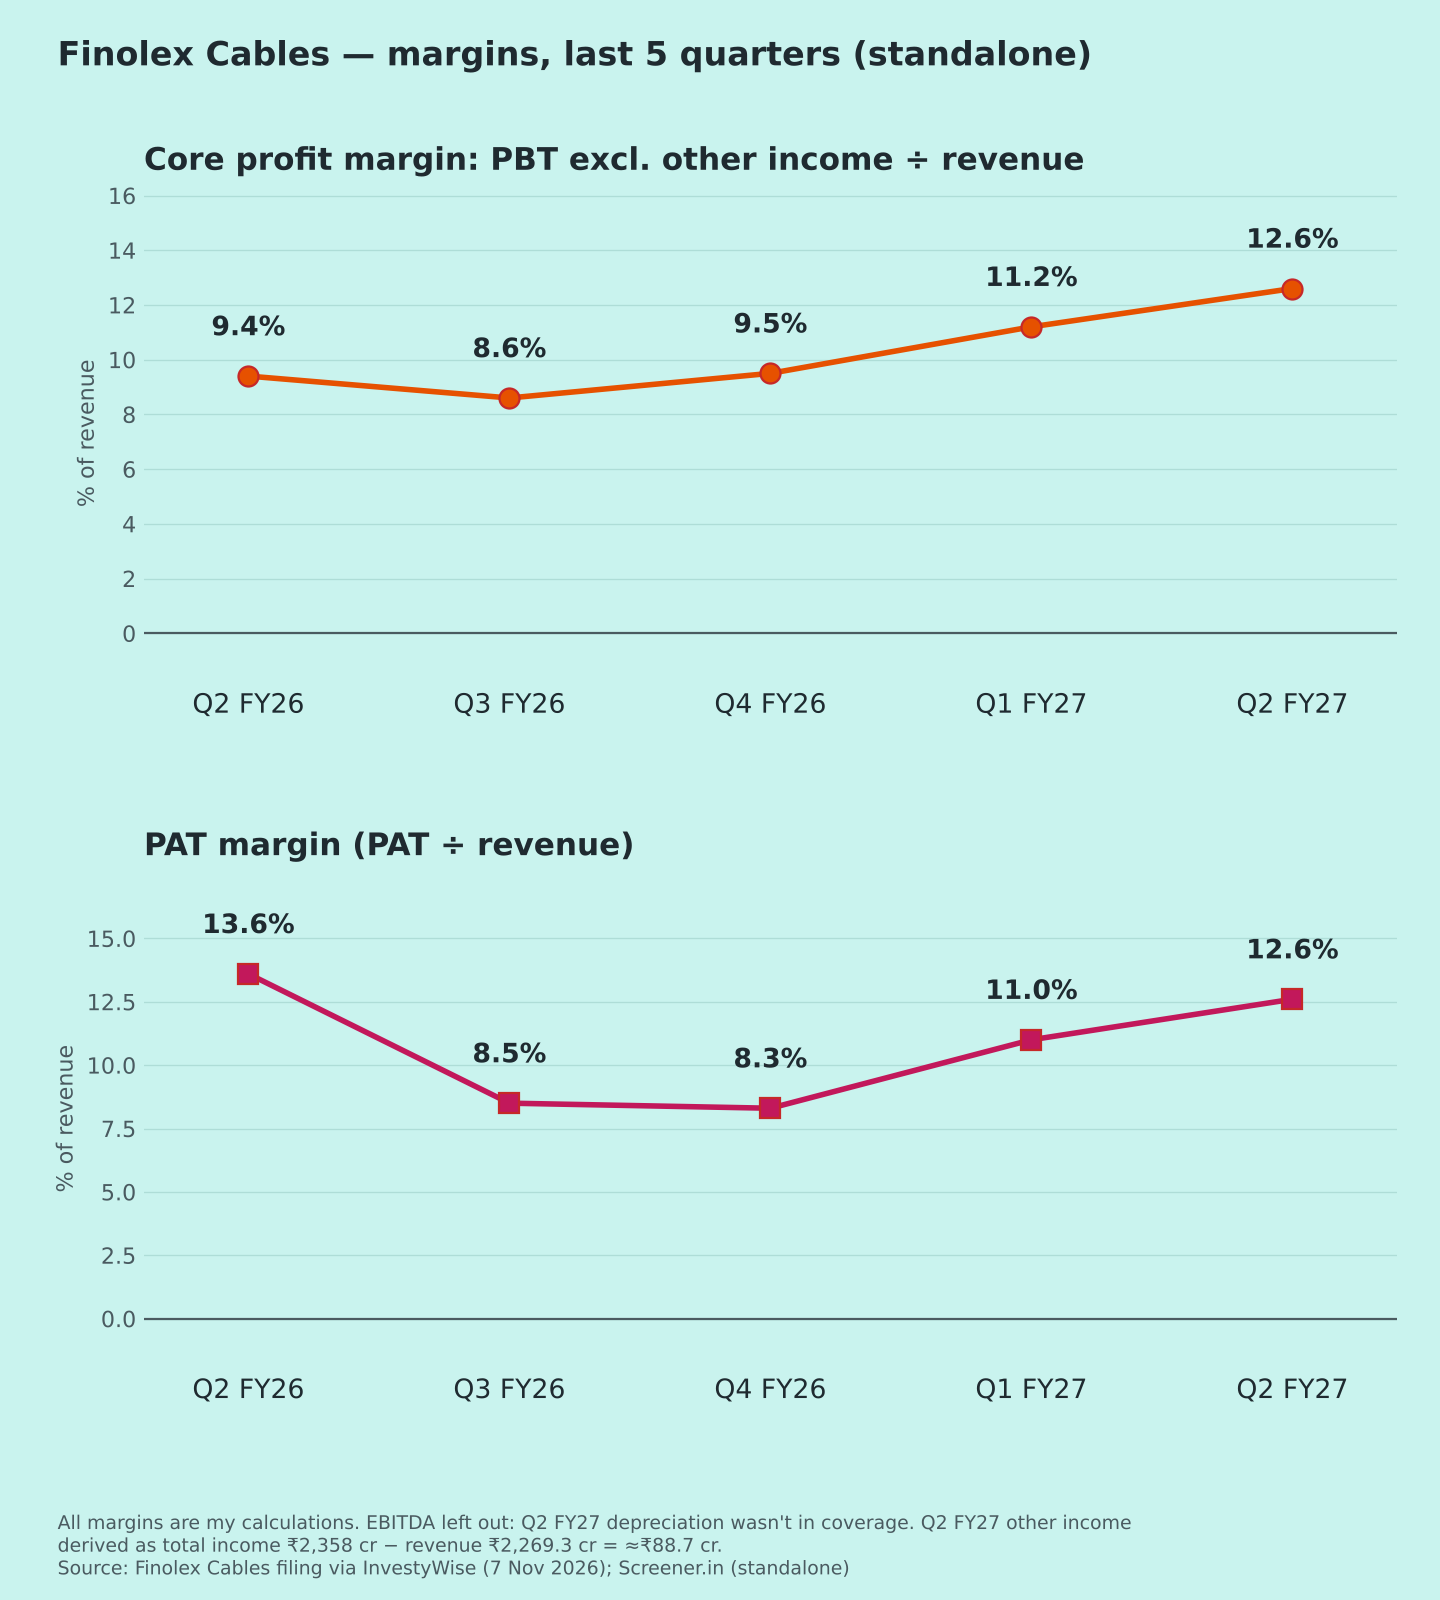
| PAT margin | 12.6% | 13.6% | 11.0% |
| EPS (₹) | 18.72 | +53.2% | +29.4% |
| Other income / PBT (≈) | ≈23.7% | 46.0% | 18.4% |
Margin and ratio rows show year-ago and last-quarter values. ≈ derived: other income = total income ₹2,358 cr − revenue ₹2,269.3 cr. % changes are my calculations. Sources: [1][2]
Source notes: InvestyWise's headline says "Q2 2026" [1], but the quarter is Q2 FY27 (Jul–Sep 2026). Consolidated PAT is ₹272.92 cr (EPS ₹17.85) [1]. The gap to standalone isn't explained in coverage. It may be the share of the Finolex J-Power associate's results; that is my guess and is unconfirmed.
Quality of earnings
- Core profit more than doubled. A year ago, other income of ₹110 cr made up 46% of PBT [2]. Excluding other income, profit rose about 122% (my calculation). Headline PAT growth (+53%) actually understates the operating improvement.
- Revenue growth probably includes copper prices. Revenue rose 65%. Cables are copper-heavy, so part of this is likely metal-price pass-through (my view); coverage gives no volume split.
- What drove it [1]: electrical cables grew on auto, agriculture, industrial and solar demand. Communication cables (mainly optic fibre) grew faster, with better margins.
- Tax rate: about 23.6% (my calculation), a normal level.
Margins (Chart 3)
Core profit margin: 9.4% → 8.6% → 9.5% → 11.2% → 12.6% (my calculation). It has risen three quarters in a row.
Capex timeline
The fibre draw facility is "on track", with full capacity of 4 million fibre-km now expected in FY27 [1]. Earlier coverage expected the preform and fibre plants by March 2026 [4]. So the timeline has slipped.
Segments
Segment figures weren't in coverage yet, so there's no segment chart. I can add it once the filing is covered.
Positives
- Core profit more than doubled (my calculation)
- Optic-fibre volumes and margins up [1]
Concerns
- Copper-price swings can distort revenue and margins (my view)
- Fibre capacity timeline slipped [1][4]
Things to track in Q3 FY27
- Volume vs price split of revenue growth
- Core margin above 12%
- Fibre draw facility ramp-up
- Associate (J-Power) impact on consolidated profit
Not a buy/sell recommendation. I am not a SEBI-registered analyst. Facts are sourced; opinions are labelled.
Sources [1] InvestyWise – board outcome & results · [2] Screener.in – standalone · [3] Trendlyne – Finolex Cables announcements · [4] ScanX – Finolex Cables news
Charts: (1) 5 quarters revenue & PAT with EPS [1][2]; (2) FY23–FY26 [2]; (3) margins [1][2]; (4) headline [1][2].