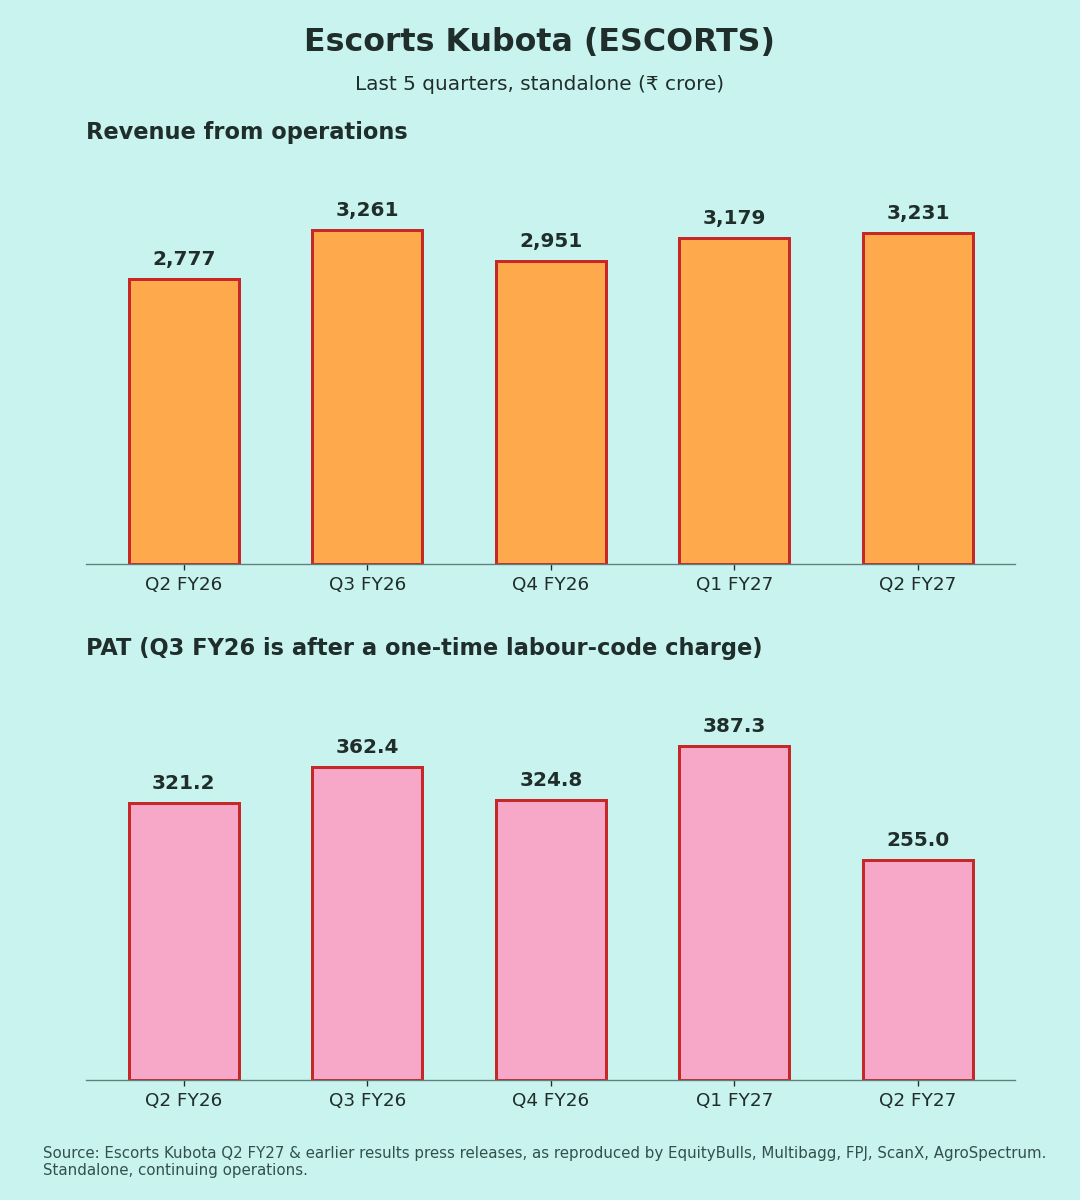
All are Standalone figures, ₹ crore. The company's press release gave EBITDA and segment data on a standalone basis, so I am using that. consolidated PAT was ₹250.2 cr. Results were declared on 2 Nov 2026. YoY/QoQ %, margins and ratios are my calculations.
| Metric | Q2 FY27 | YoY | QoQ |
| Revenue from ops | 3,231.4 | +16.3% | +1.7% |
| EBITDA (ex-other income) | 292.4 | −19.5% | −17.7% |
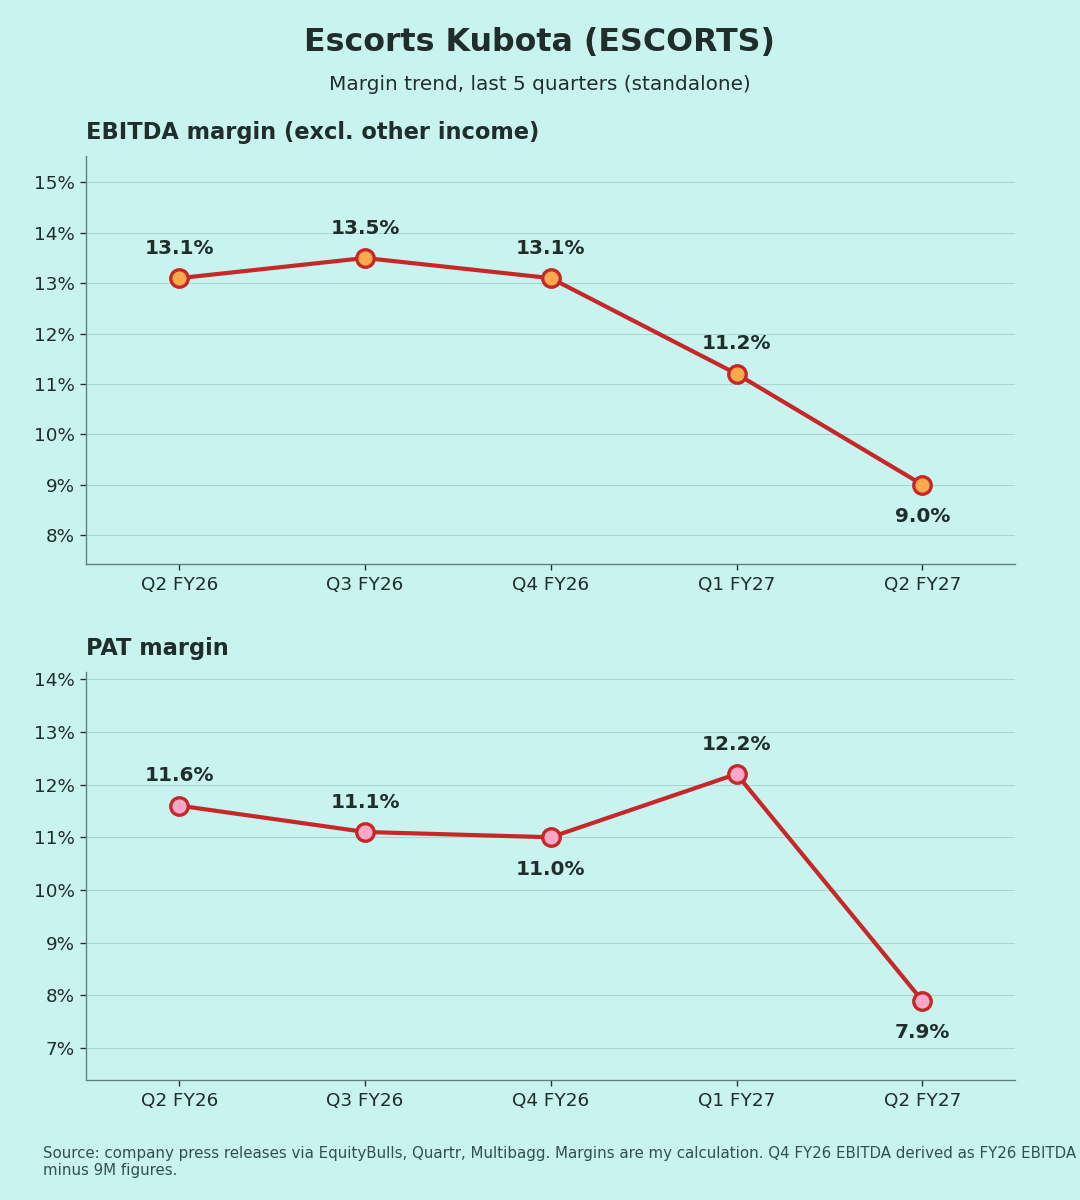
| EBITDA margin | 9.0% | 13.1% | 11.2% |
| PBT | 344.0 | −20.2% | −30.3% |
| PAT | 255.0 | −20.6% | −34.1% |
| PAT margin | 7.9% | 11.6% | 12.2% |
| Other income / PBT | 35.7% | 31.0% | 42.0% |
Margin and ratio rows show the last-year and last-quarter values.
Quality of earnings
Sales grew, profit fell. Tractor volumes were almost flat (+0.4%), yet agri revenue rose 10.6%. My reading is that price hikes and product mix did the work, not more tractors.
Other income (₹122.9 cr) was over a third of PBT (my calculation from total income). That is why PBT is higher than EBITDA. Without it, PBT would be about ₹221 cr.
The tax rate was a normal ~26%. Q2 had no exceptional item. H1 FY26 did include one-time gains (Railway business sale, land sale), so the reported half-year PAT is not comparable [1].
Base effect: the Q2 FY26 margin (13.1%) was normal, not unusually high [1]. The YoY fall is real, not a base illusion.
Margins (Chart 3)
EBITDA margin over five quarters: 13.1% → 13.5% → 13.1% → 11.2% → 9.0%. Management blames high commodity costs and product mix [1].
The two segments moved in opposite directions [2]:
- Agri Machinery EBIT margin: 12.8% → 7.8%
- Construction Equipment EBIT margin: 3.8% → 7.9%, helped by higher volumes (+53.9%)
Guidance: what changed
- Margin recovery: In August, the CFO said he expected commodity costs to start reversing in Q4 [5]. Now management says margins should improve gradually from Q4 and return "closer to normal" only in FY28 [1]. My reading: the start date is unchanged, but full recovery now looks a year away.
- Industry outlook: In August, FY27 tractor industry growth was raised to mid-single digits, from a ±2–3% range [5]. No update in the press release.
- Pricing: Price hikes were taken in August, and another across brands from November [11][12].
- Earnings call: Held at 5 PM on 2 Nov [15]; not covered here. Readers who attended, please add.
Positives
- Revenue +16% YoY; H1 revenue +21.9%
- Construction Equipment revenue +58.6% with margin doubled
- H1 PAT before exceptional items up 2.2%
Concerns
- Agri margin down 500 bps in a year
- September tractor sales fell 16.7% YoY (festive timing shift)
- Other income is a large share of profit (my view)
- Recovery depends on commodity prices settling
Things to track in Q3 FY27
- Agri EBIT margin after the November price hike
- Tractor volumes, Oct–Dec (October: 16,921 tractors [16])
- Steel and other input costs
- Whether Construction Equipment holds ~8% margin
Not a buy/sell recommendation. Facts are sourced; opinions are labelled.
Sources [1] EquityBulls – Q2 FY27 press release, 2 Nov 2026 · [2] Multibagg – segment results · [3] Free Press Journal – total income · [4] Investing.com – Q1 FY27 slides · [5] Autocar Pro – Q1 FY27 call · [6] Quartr – Q3 FY26 summary · [7] AgroSpectrum – Q4 FY26 · [8] ScanX – FY26 results · [9] Company – FY24 press release · [10] BSE – FY24 presentation · [11] Sahi – August price hike · [12] Sahi – November price hike · [13] TractorJunction – Q2 volumes · [14] FilingReader – Kubota India merger · [15] Multibagg – Sep sales & call schedule · [16] EquityBulls – October sales
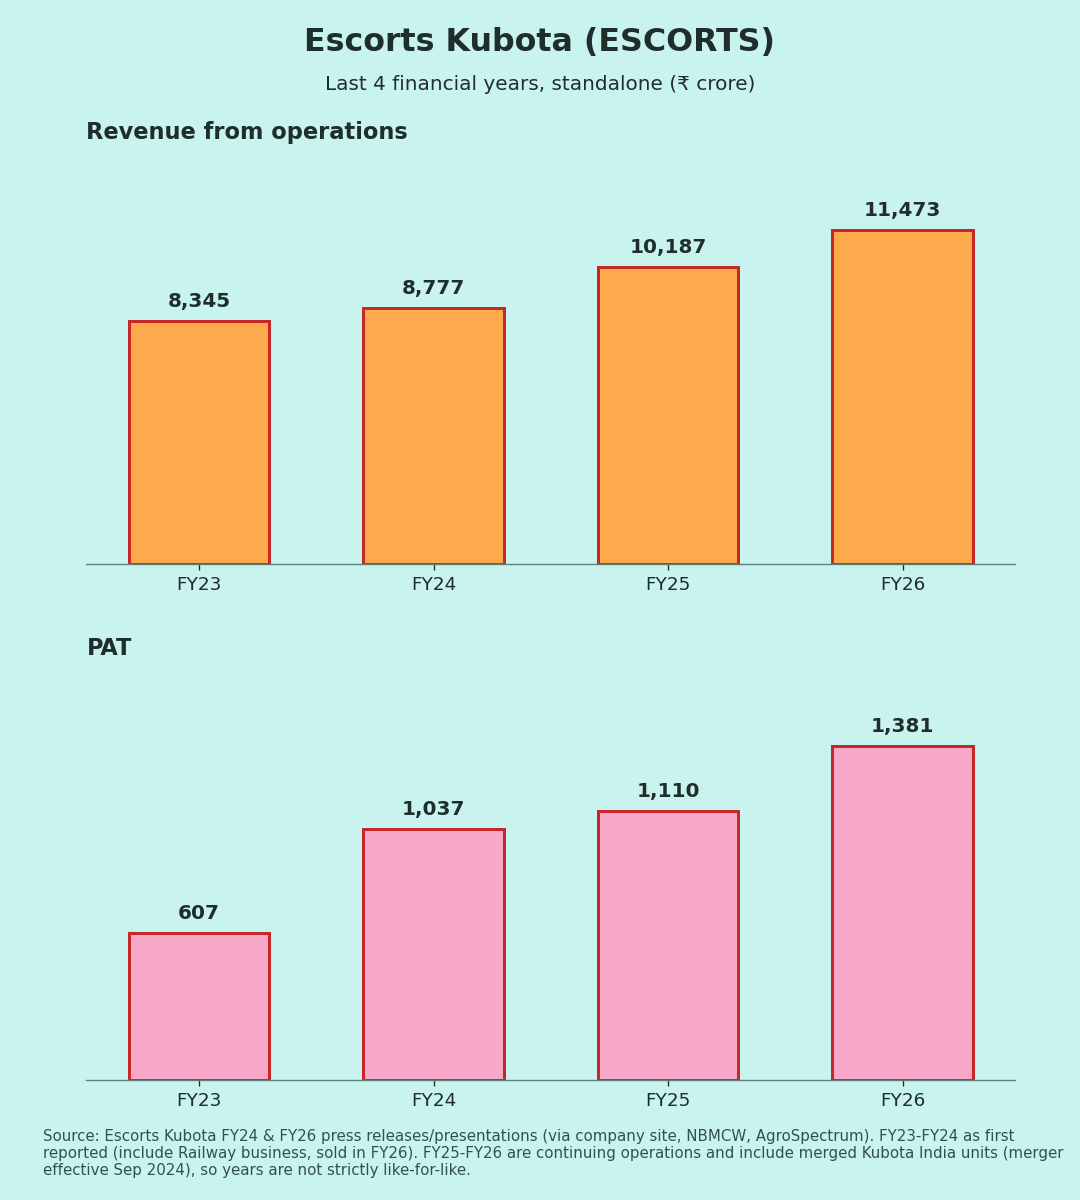
Charts: (1) last 5 quarters revenue & PAT (2) FY23–FY26 revenue & PAT. FY23–FY24 include the Railway business; FY25–FY26 are continuing operations and include merged Kubota India units [14], so the years are not strictly like-for-like; (3) EBITDA and PAT margin (own calc.; Q4 FY26 EBITDA derived from FY26 total [8]).