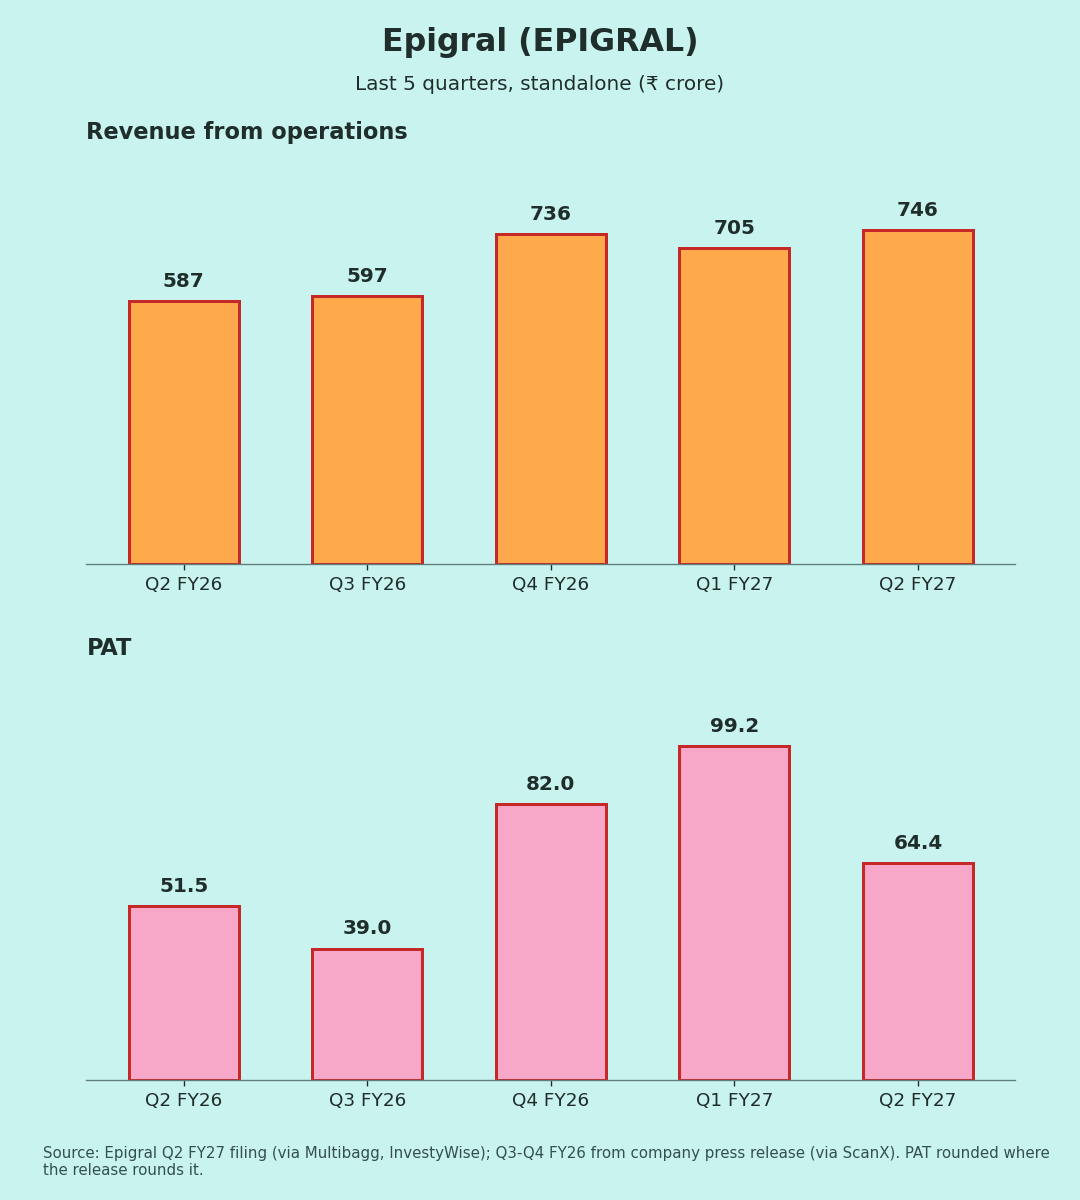
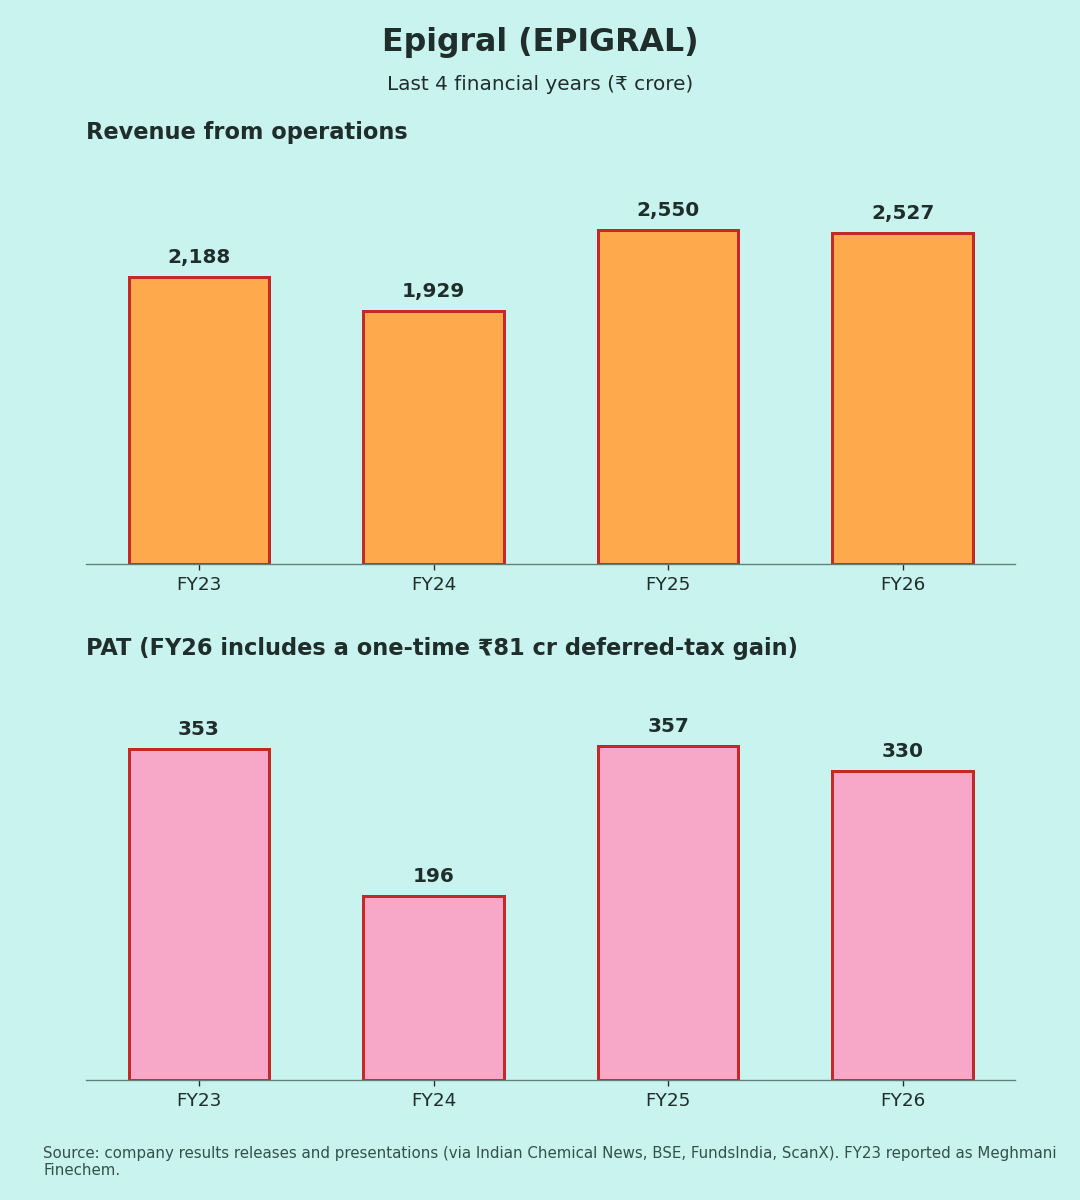
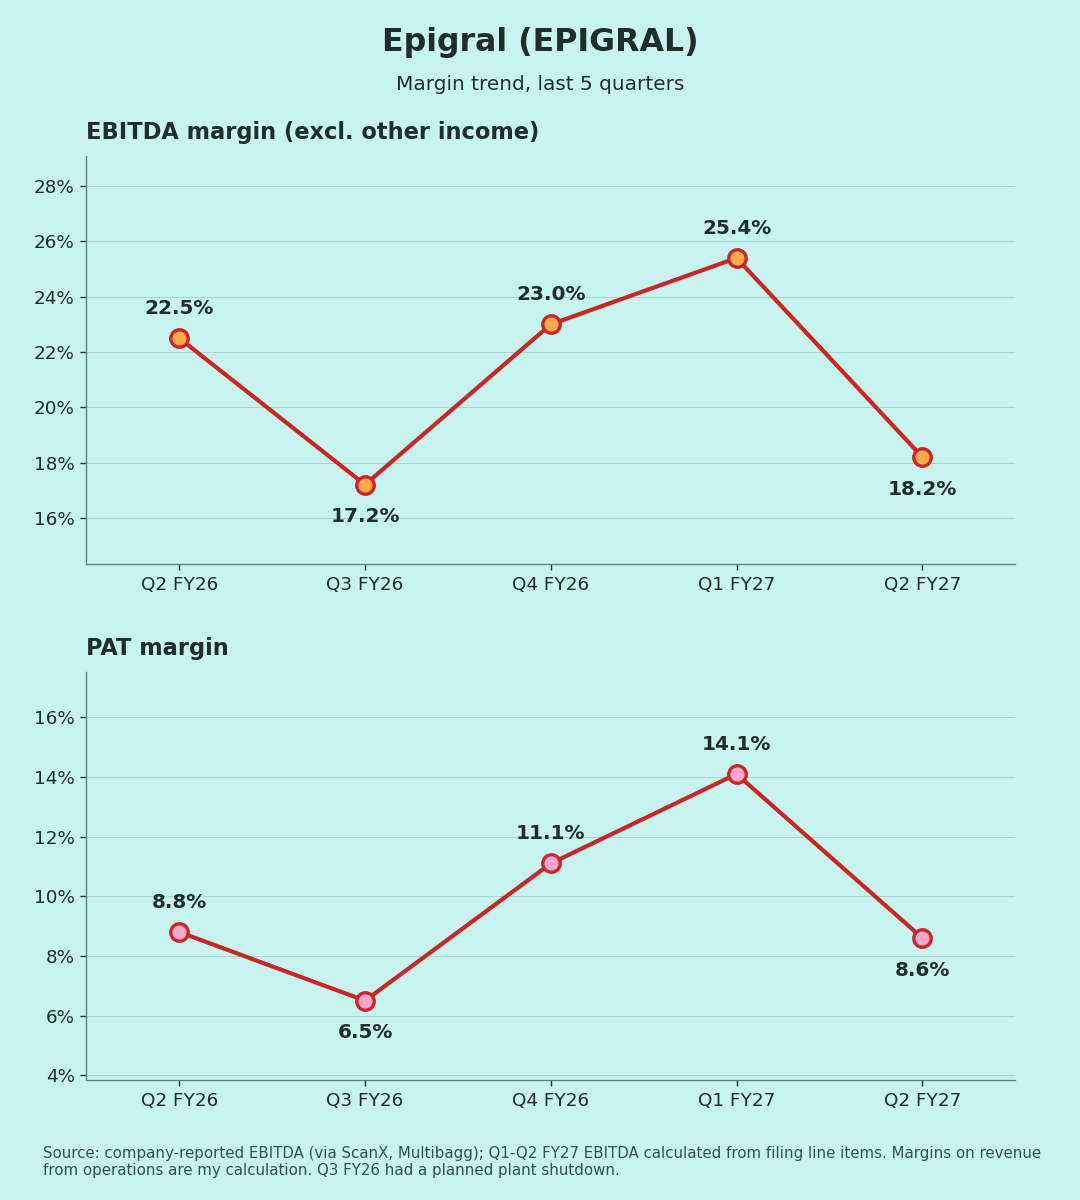
Standalone figures, ₹ crore. EBITDA excludes other income. YoY/QoQ %, margins and ratios are my calculations.
| Metric | Q2 FY27 | YoY | QoQ |
| Revenue from ops | 746.0 | +27.0% | +5.8% |
| EBITDA | 136.1 | +3.1% | −24.1% |
| EBITDA margin | 18.2% | 22.5% | 25.4% |
| PBT | 86.9 | +24.3% | −34.7% |
| PAT | 64.4 | +25.0% | −35.0% |
| PAT margin | 8.6% | 8.8% | 14.1% |
| Other income / PBT | 6.7% | 2.5% | 3.1% |
Margin and ratio rows show the year-ago and last-quarter values.
Quality of earnings
Revenue rose 27%, but EBITDA rose only 3%. So most of the extra sales did not turn into extra operating profit.
PBT still grew 24% YoY. Interest plus depreciation was about ₹9 cr lower than a year ago, and other income about ₹4 cr higher. Other income is small at under 7% of PBT. The tax rate was a normal ~26%. No exceptional items [1].
Base effect: Q2 FY26 PAT had itself fallen 36% YoY [16], so the +25% YoY is partly flattered by a soft base.
Half-year view: H1 PAT fell to ₹163.6 cr from ₹211.9 cr. That is because H1 FY26 carried a one-time deferred-tax gain [1]. H1 PBT actually rose 25% (₹220.1 cr vs ₹176.7 cr) [1].
QoQ, raw-material cost rose to ₹469 cr from ₹430 cr, and an inventory swing added ~₹41 cr of cost [1]. The company cites high raw-material costs [3].
Cash flow: H1 operating cash flow fell to ₹141 cr from ₹267 cr, as working capital absorbed cash [1].
Margins (Chart 3)
EBITDA margin over five quarters: 22.5% → 17.2% → 23.0% → 25.4% → 18.2% [2][5]. The Q3 FY26 dip came from a planned maintenance shutdown [13]. Q2 FY27 has no such reason given other than input costs.
The mix keeps shifting: Derivatives & Specialty reached 57% of revenue, the highest in five quarters, vs 50% a year ago [4].
Guidance: what changed
- CPVC (+75k TPA) and ECH (+50k TPA): Guided for H1 FY27 in January [6] and for Q2 FY27 in July [7]. Now Q3 FY27 [2]. Slipped by a quarter.
- 70% specialty share: First targeted "by FY27" [9], moved to "by FY28" in May 2025 [10]. Unchanged since.
- Epoxy resin (125k TPA) and multi-purpose plant: Still H2 FY28 [2][7].
- Capex: ~₹400 cr in FY27; ₹88 cr spent in H1 [2].
- Long term: On the Q1 call, management targeted 15–20% revenue and profit CAGR over 3–5 years [8].
- Q2 call: I found no coverage at writing.
Positives
- Revenue +27% YoY; specialty share at 57% [1][4]
- PAT +25% YoY [1]
- Net debt/EBITDA 0.9x [2]
Concerns
- EBITDA margin down ~430 bps YoY [2]
- Expansion timeline slipped again [2][7]
- Operating cash flow nearly halved in H1 [1]
- Part of the YoY growth is base effect (my view)
Things to track in Q3 FY27
- Actual commissioning of the CPVC and ECH expansions
- EBITDA margin: does it return to the 22–25% band?
- Working capital and H2 cash flow
- Capex pace vs the ₹312 cr still planned for FY27
Not a buy/sell recommendation. Facts are sourced; opinions are labelled.
Sources [1] Multibagg – Q2 FY27 filing summary · [2] Multibagg – Q2 FY27 presentation, capex · [3] Multibagg – margin · [4] Multibagg – revenue mix · [5] ScanX – Q4 FY26 call · [6] Q3 FY26 presentation (BSE) · [7] Q1 FY27 presentation (NSE) · [8] Arthneeti – Q1 FY27 call · [9] BSE – Nov 2024 presentation · [10] BSE – May 2025 presentation · [11] Indian Chemical News – FY23 · [12] FundsIndia – FY24 · [13] Indian Chemical News – Q4 FY26 · [14] ScanX – FY25/FY26 PAT · [15] Sahi – FY31 target · [16] ScanX – Q2 FY26 summary
Charts:
(1) last 5 quarters revenue & PAT, Q3–Q4 FY26 PAT as rounded in the company release
(2) FY23–FY26 revenue & PAT, FY26 PAT includes a one-time ₹81 cr deferred-tax gain [5]; (3) EBITDA and PAT margin (own calc.).