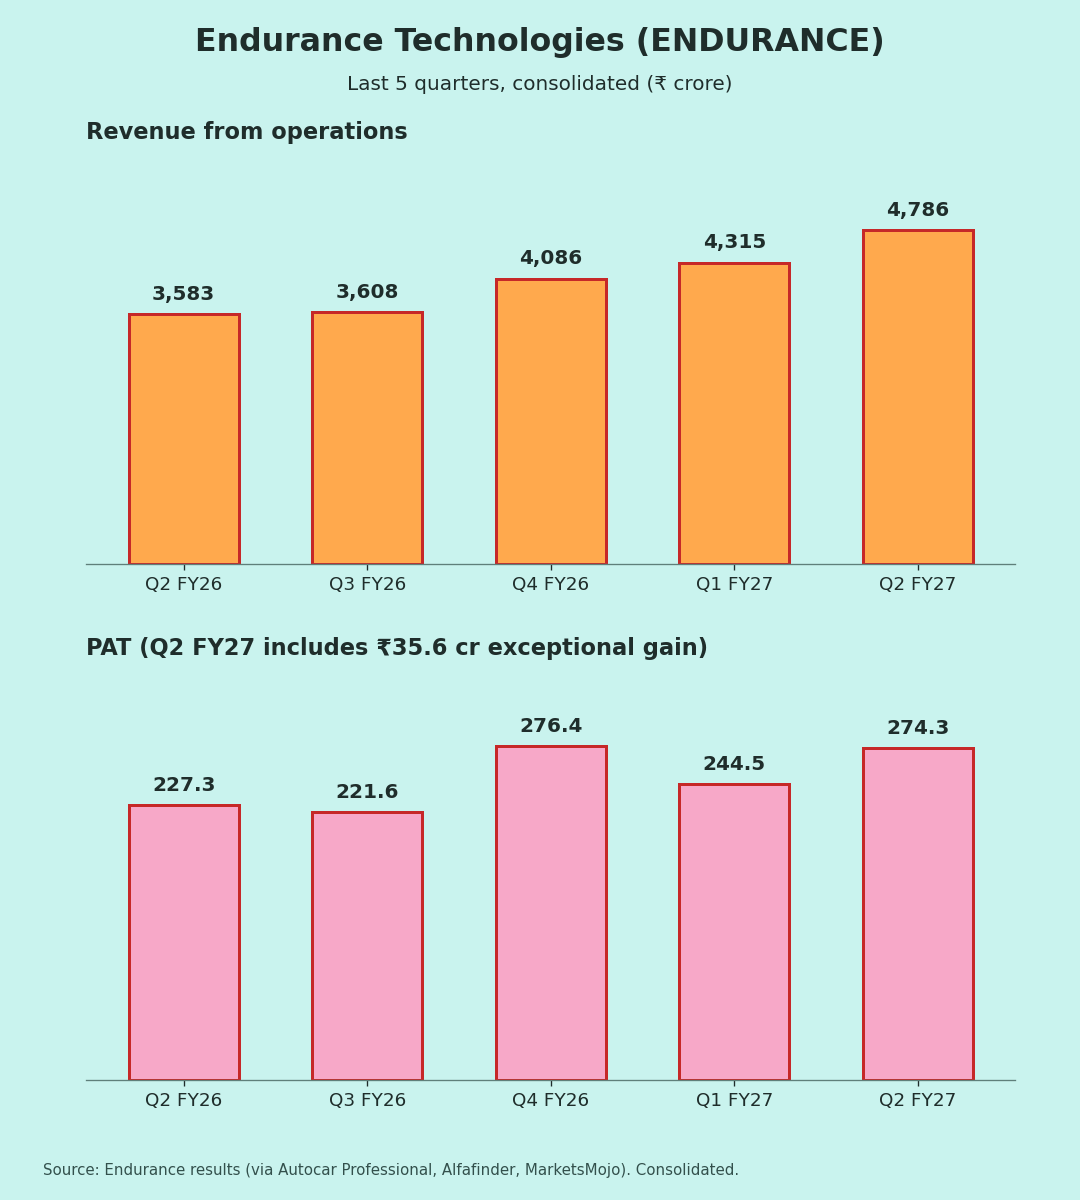
Consolidated figures, ₹ crore. Results were filed on 3 Nov 2026.
YoY/QoQ % are my calculations. Q1 FY27 EBITDA is H1 minus Q2.
| Metric | Q2 FY27 | YoY | QoQ |
| Revenue from ops | 4,786.2 | +33.6% | +10.9% |
| EBITDA | 584 | +17.3% | +2.6% |
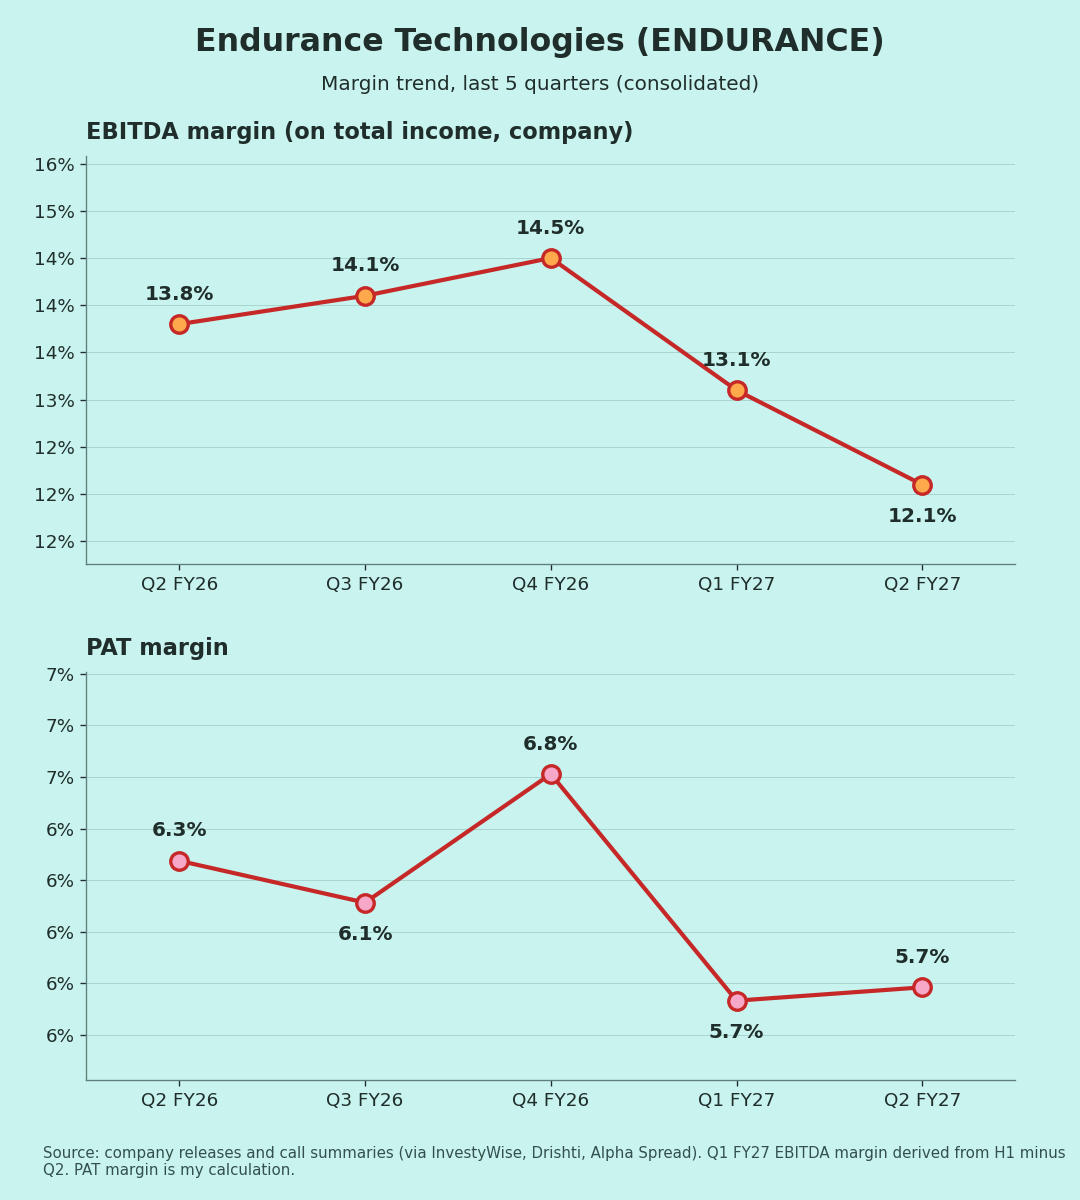
| EBITDA margin | 12.1% | 13.8% | 13.1% |
| PAT (reported) | 274.3 | +20.7% | +12.2% |
| PAT excl. exceptional gain (approx.) | ~238.7 | ~+5% | ~−2% |
| PAT margin (reported) | 5.7% | 6.3% | 5.7% |
Margin rows show the year-ago and last-quarter values.
Quality of earnings
The headline flatters the quarter:
- One-off gain: PAT includes a ₹35.6 cr exceptional gain. Endurance's German subsidiary bought the remaining 32% of Stöferle, and an earlier liability for a deferred payment was written back [1].
- Without it, PAT was roughly ₹239 cr, up about 5% YoY (my calculation, assuming the gain is untaxed).
- Revenue vs profit: revenue grew 34% but EBITDA only 17%.
- Raw materials: material costs rose 51.5% YoY [1], much faster than revenue. Aluminium and other commodity prices are passed on to customers with a lag. That raises revenue without adding profit, which shrinks the margin percentage. Management pointed to this on the Q1 call [6] (interpretation).
- Acquisitions: part of the growth comes from buying companies. Endurance bought Fondalpress (Italy), took Stöferle (Germany) to 100%, and sold Veicoli in Italy [3].
Segments: India vs Europe
| Region | EBITDA | YoY | EBITDA margin (a year ago) |
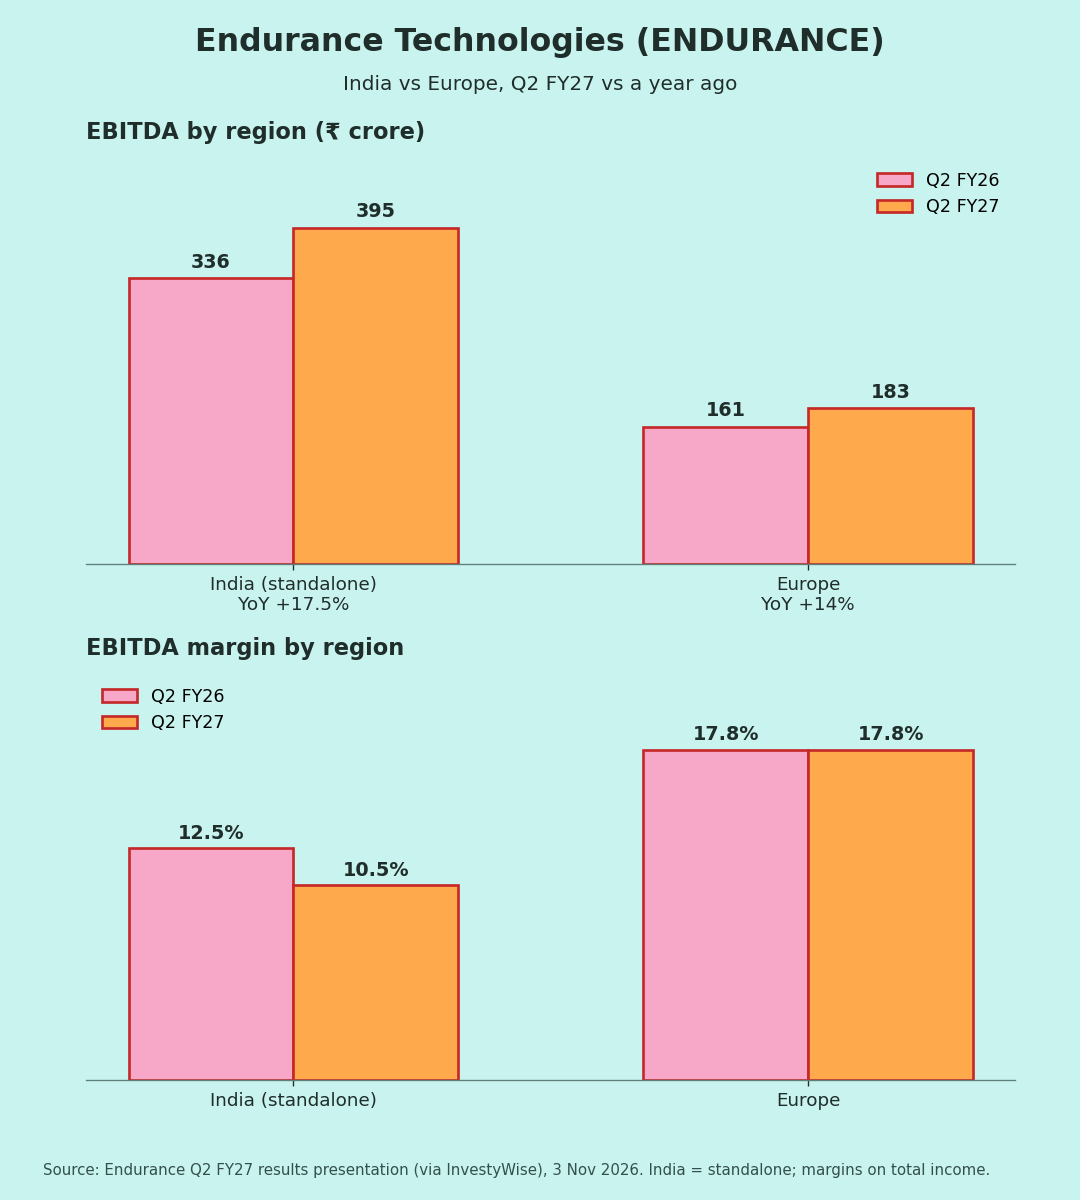
| India (standalone) | ₹395 cr | +17.5% | 10.5% (12.5%) |
| Europe | ₹183 cr | +14% | 17.8% (17.8%) |
India's total income grew 39.7% to ₹3,761 cr [2], but its margin fell 200 bps. Europe's margin held steady.
Margins (Chart 3)
Consolidated EBITDA margin over five quarters: 13.8% → 14.1% → 14.5% → 13.1% → 12.1% [2][4][5]. That is two straight quarters of decline.
Guidance: what changed
- Q4 FY26 call: management expected cost volatility in Q1 FY27 and "better numbers from Q2" if price increases were passed on [7].
- Q2 actual: revenue grew faster, but the margin fell again, so the margin recovery hasn't come through yet (my reading).
- Capacity: new plants and products are coming on stream, including ABS expansion, the Chennai brake plant and battery packs [7].
- Q2 call: no coverage found at writing.
Positives
- Revenue +34%; India standalone total income +40% [1][2]
- Europe margin steady at 17.8% [2]
- European footprint expanded through acquisitions [3]
Concerns
- Underlying PAT growth only ~5% (my calculation)
- India margin down to 10.5% [2]
- Acquisition-related debt and integration [3]
Things to track in Q3 FY27
- India EBITDA margin: does pass-through push it back above 12%?
- Raw-material cost growth vs revenue growth
- Fondalpress and Stöferle integration in Europe
- Ramp-up of new plants (ABS, Chennai brakes, battery packs)
Not a buy/sell recommendation. Facts are sourced; opinions are labelled.
Sources [1] Autocar Professional – Q2 FY27 filing, 3 Nov 2026 · [2] InvestyWise – Q2 FY27 presentation · [3] Whalesbook – Q2 FY27, acquisitions · [4] Drishti – Q3 FY26 call · [5] Autocar Professional – FY26 results · [6] Alfafinder – Q1 FY27 call · [7] Alpha Spread – Q4 FY26 call · [8] Alpha Spread – Q2 FY26 call · [9] MarketsMojo – quarterly PAT · [10] Alfafinder – Q4 FY26 results · [11] NSE – Q4 FY24 call transcript · [12] ICICI Direct – FY23–FY26 PAT
Charts: (1) last 5 quarters revenue & PAT
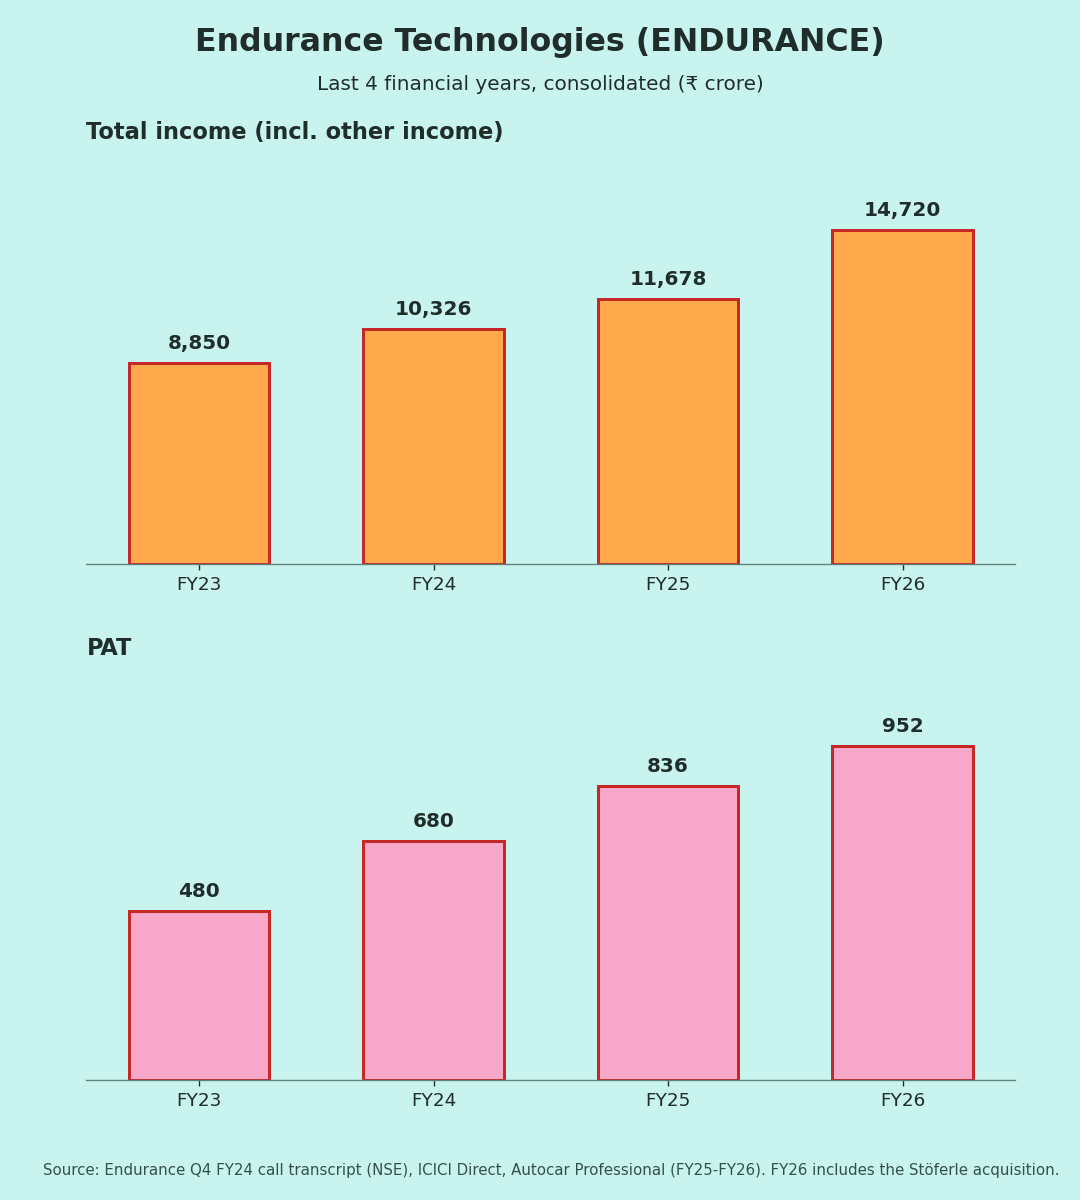
(2) FY23–FY26 total income & PAT
(3) EBITDA margin [2][4][5][8] and PAT margin (own calc.);
(4) India vs Europe EBITDA and margin.