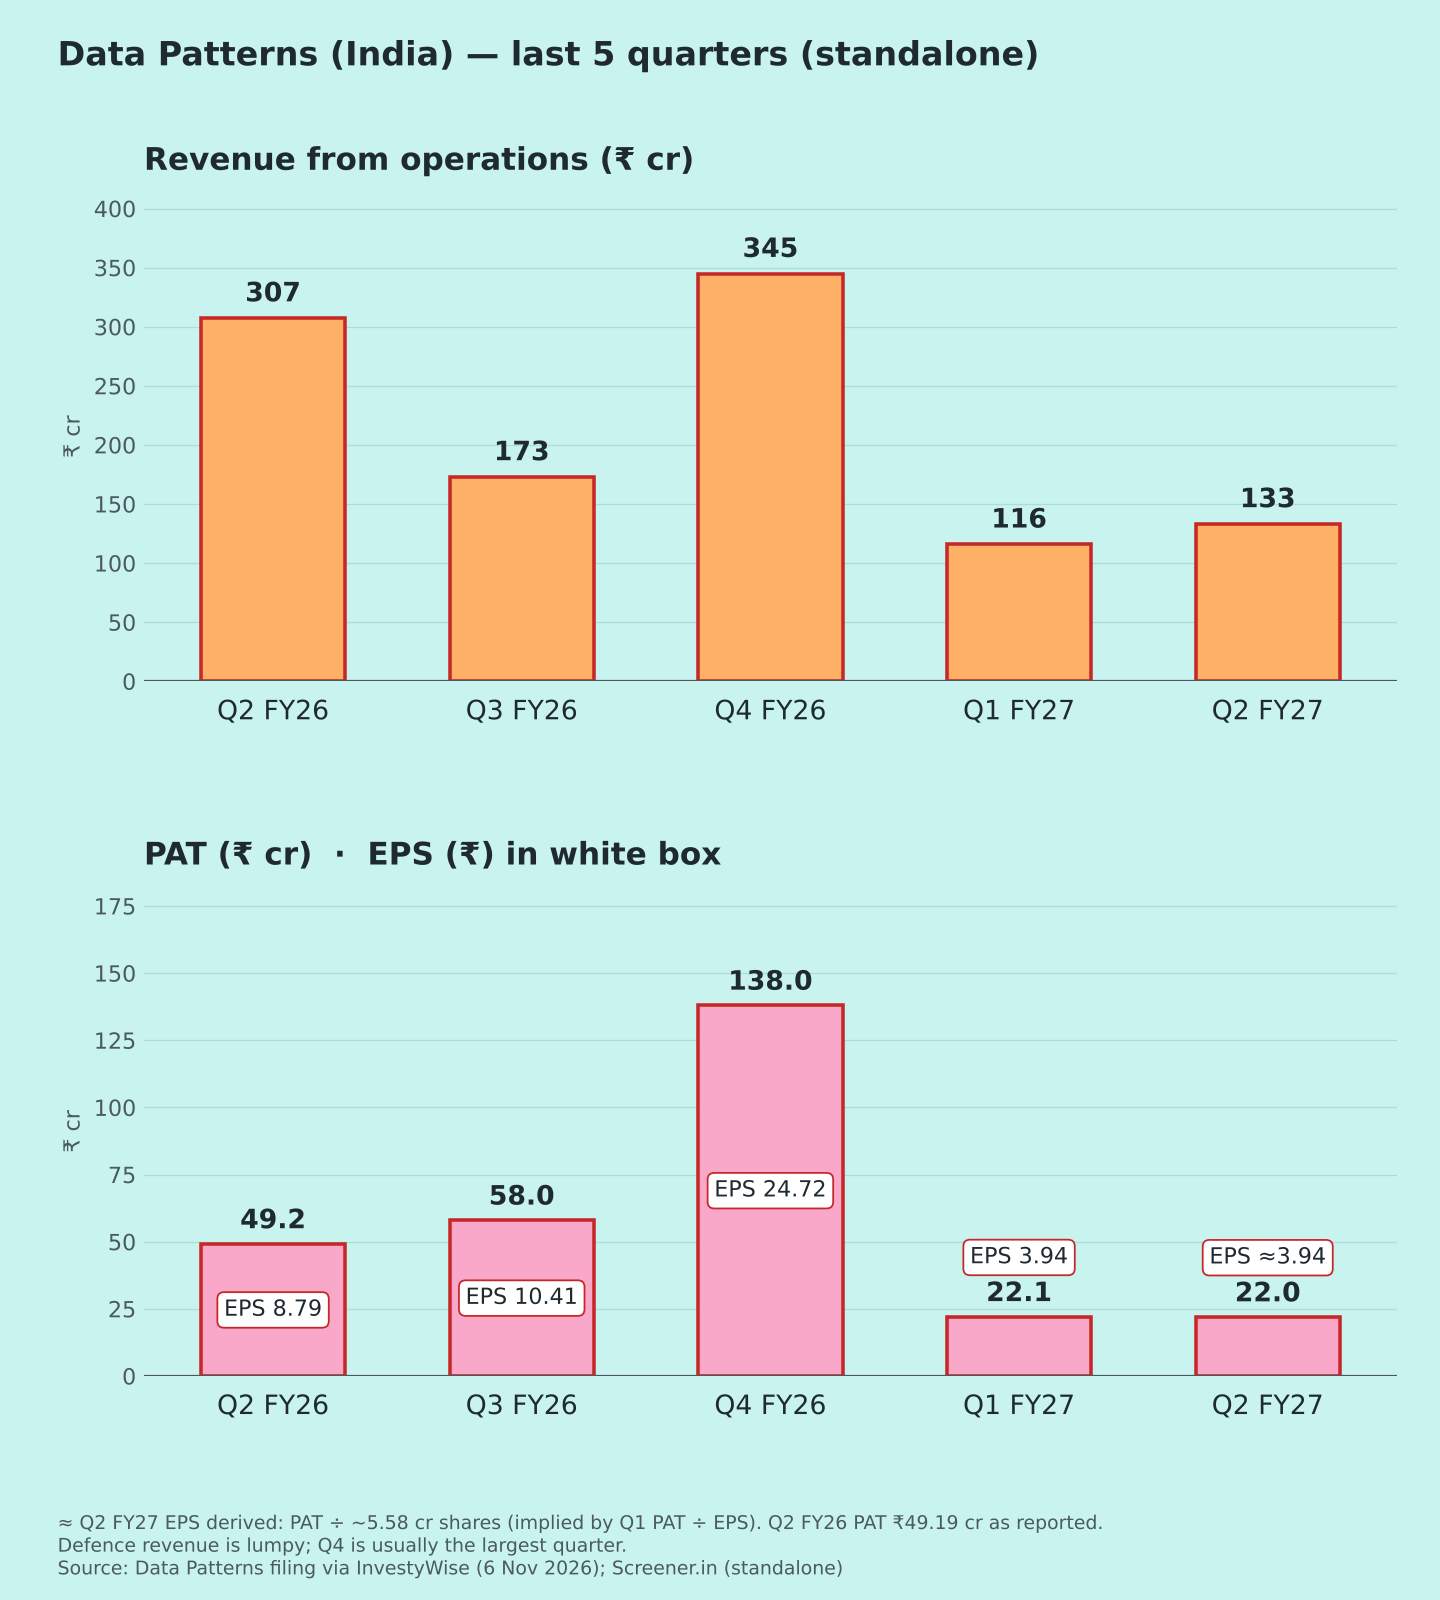
Standalone figures, ₹ crore, used because past quarters are standalone.
Data Patterns bought ST Advanced Composites on 17 Sep 2026 for ₹1.5 cr [1];
consolidated revenue is the same and consolidated PAT is ₹21.82 cr [3].
Results announced 6 Nov 2026. EBITDA excludes other income ("operational EBITDA") [2]. Reported Q2 EPS wasn't in coverage, so it is derived.
| Metric | Q2 FY27 | YoY | QoQ |
| Revenue from ops | 133.25 | −56.7% | +14.8% |
| Operational EBITDA | 31.44 | −54.1% | +0.2% |
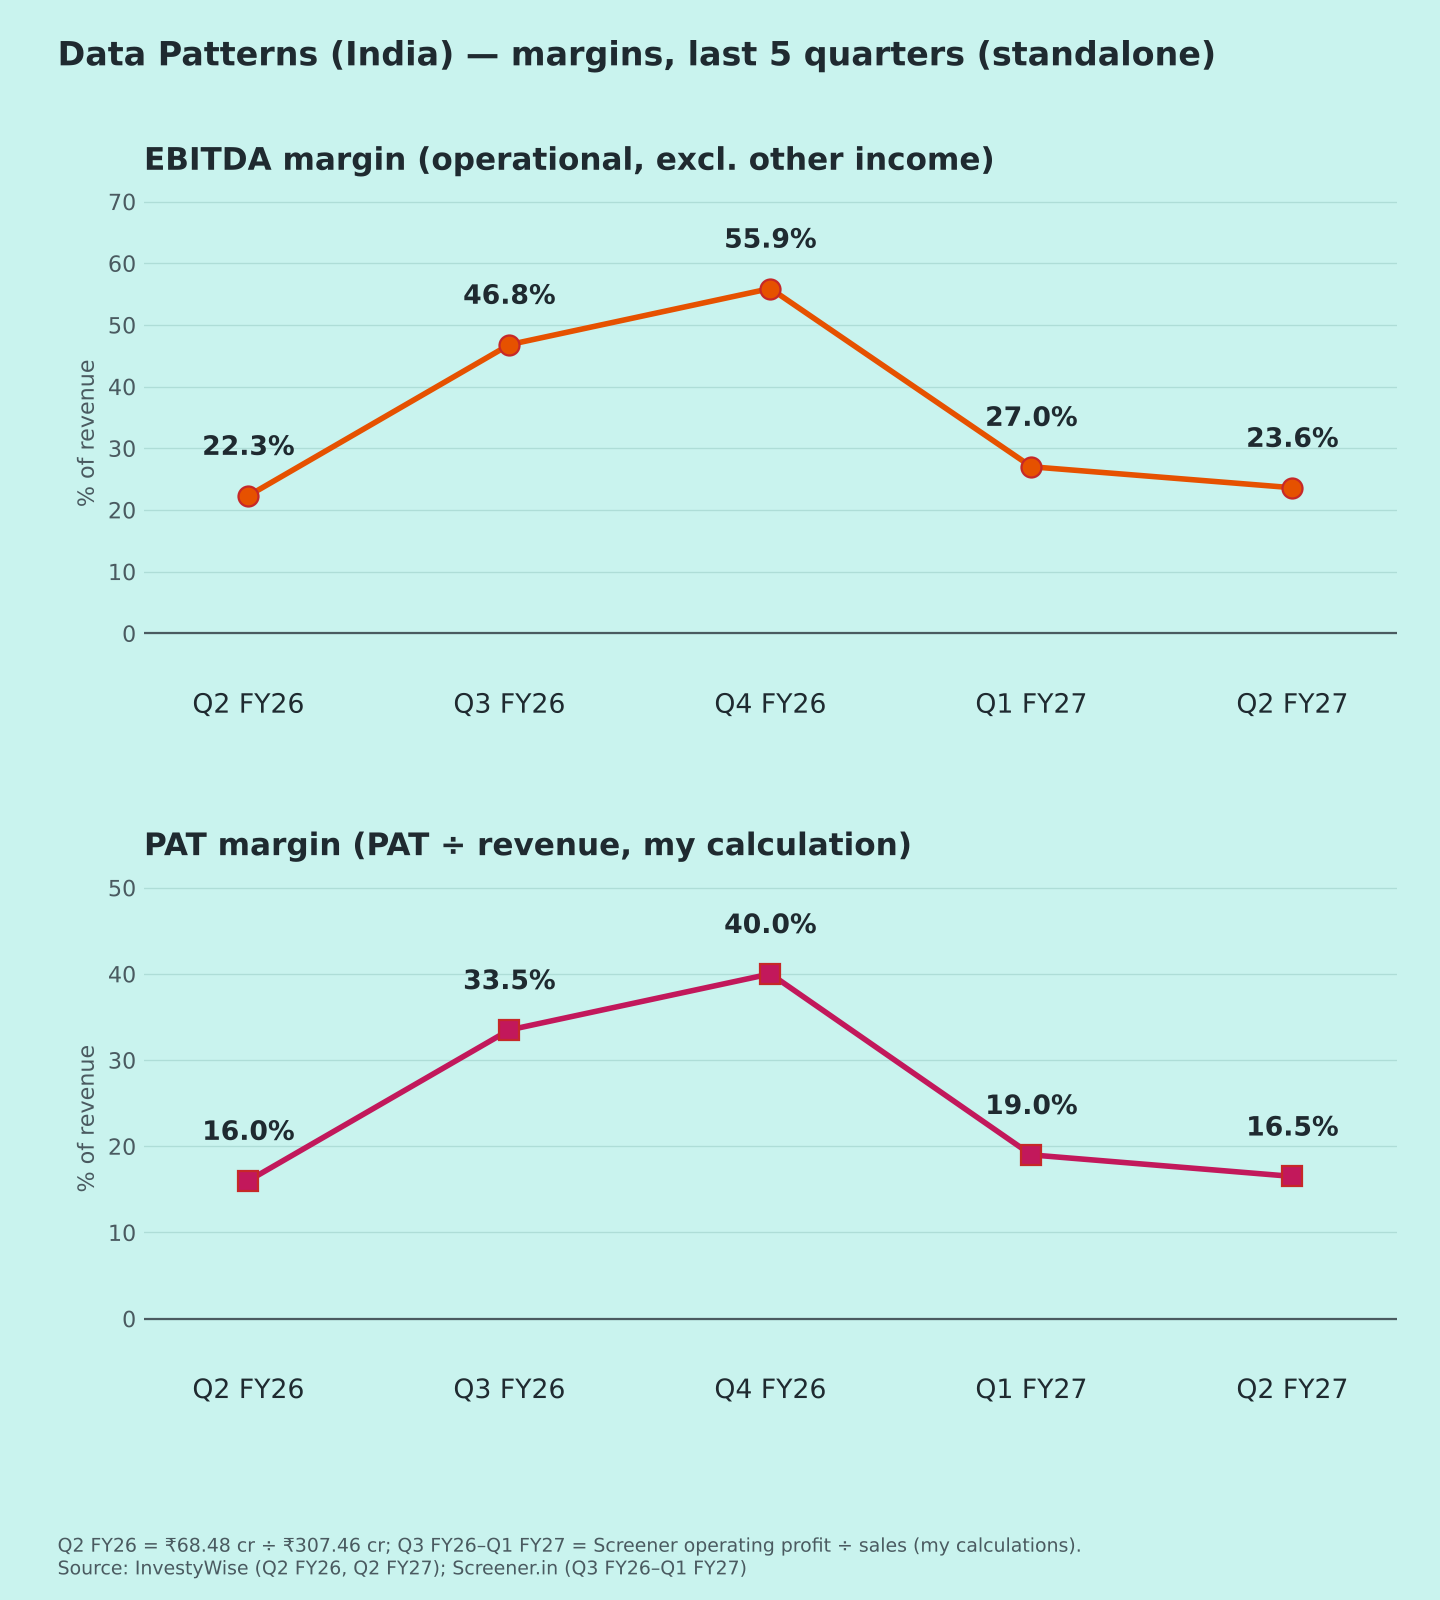
| EBITDA margin | 23.6% | 22.3% | 27.0% |
| PBT | 29.53 | −55.3% | +0.2% |
| PAT | 21.97 | −55.3% | −0.4% |
| PAT margin | 16.5% | 16.0% | 19.0% |
| EPS (₹, ≈ derived) | ≈3.94 | 8.79 → ≈3.94 | 3.94 → ≈3.94 |
| Other income / PBT | 27.7% | 9.0% | 24.8% |
Margin and ratio rows show year-ago and last-quarter values. ≈ EPS = PAT ÷ shares (Q1 PAT ÷ EPS). % changes and ratios are my calculations.
Quality of earnings
- The fall is about timing of deliveries, not margins. Revenue halved because Q2 FY26 had heavy execution; the CMD called this quarter "muted" for that reason [1]. Margins held: 23.6% vs 22.3% a year ago, helped by better gross margin [2].
- Other income is a large part of profit: ₹8.2 cr, about 28% of PBT (my calculation).
- The acquisition added only about two weeks and had a negligible impact [3].
Margins (Chart 3)
EBITDA margin: 22.3% → 46.8% → 55.9% → 27.0% → 23.6% [2][6]. It swings with the product mix in each quarter's deliveries.
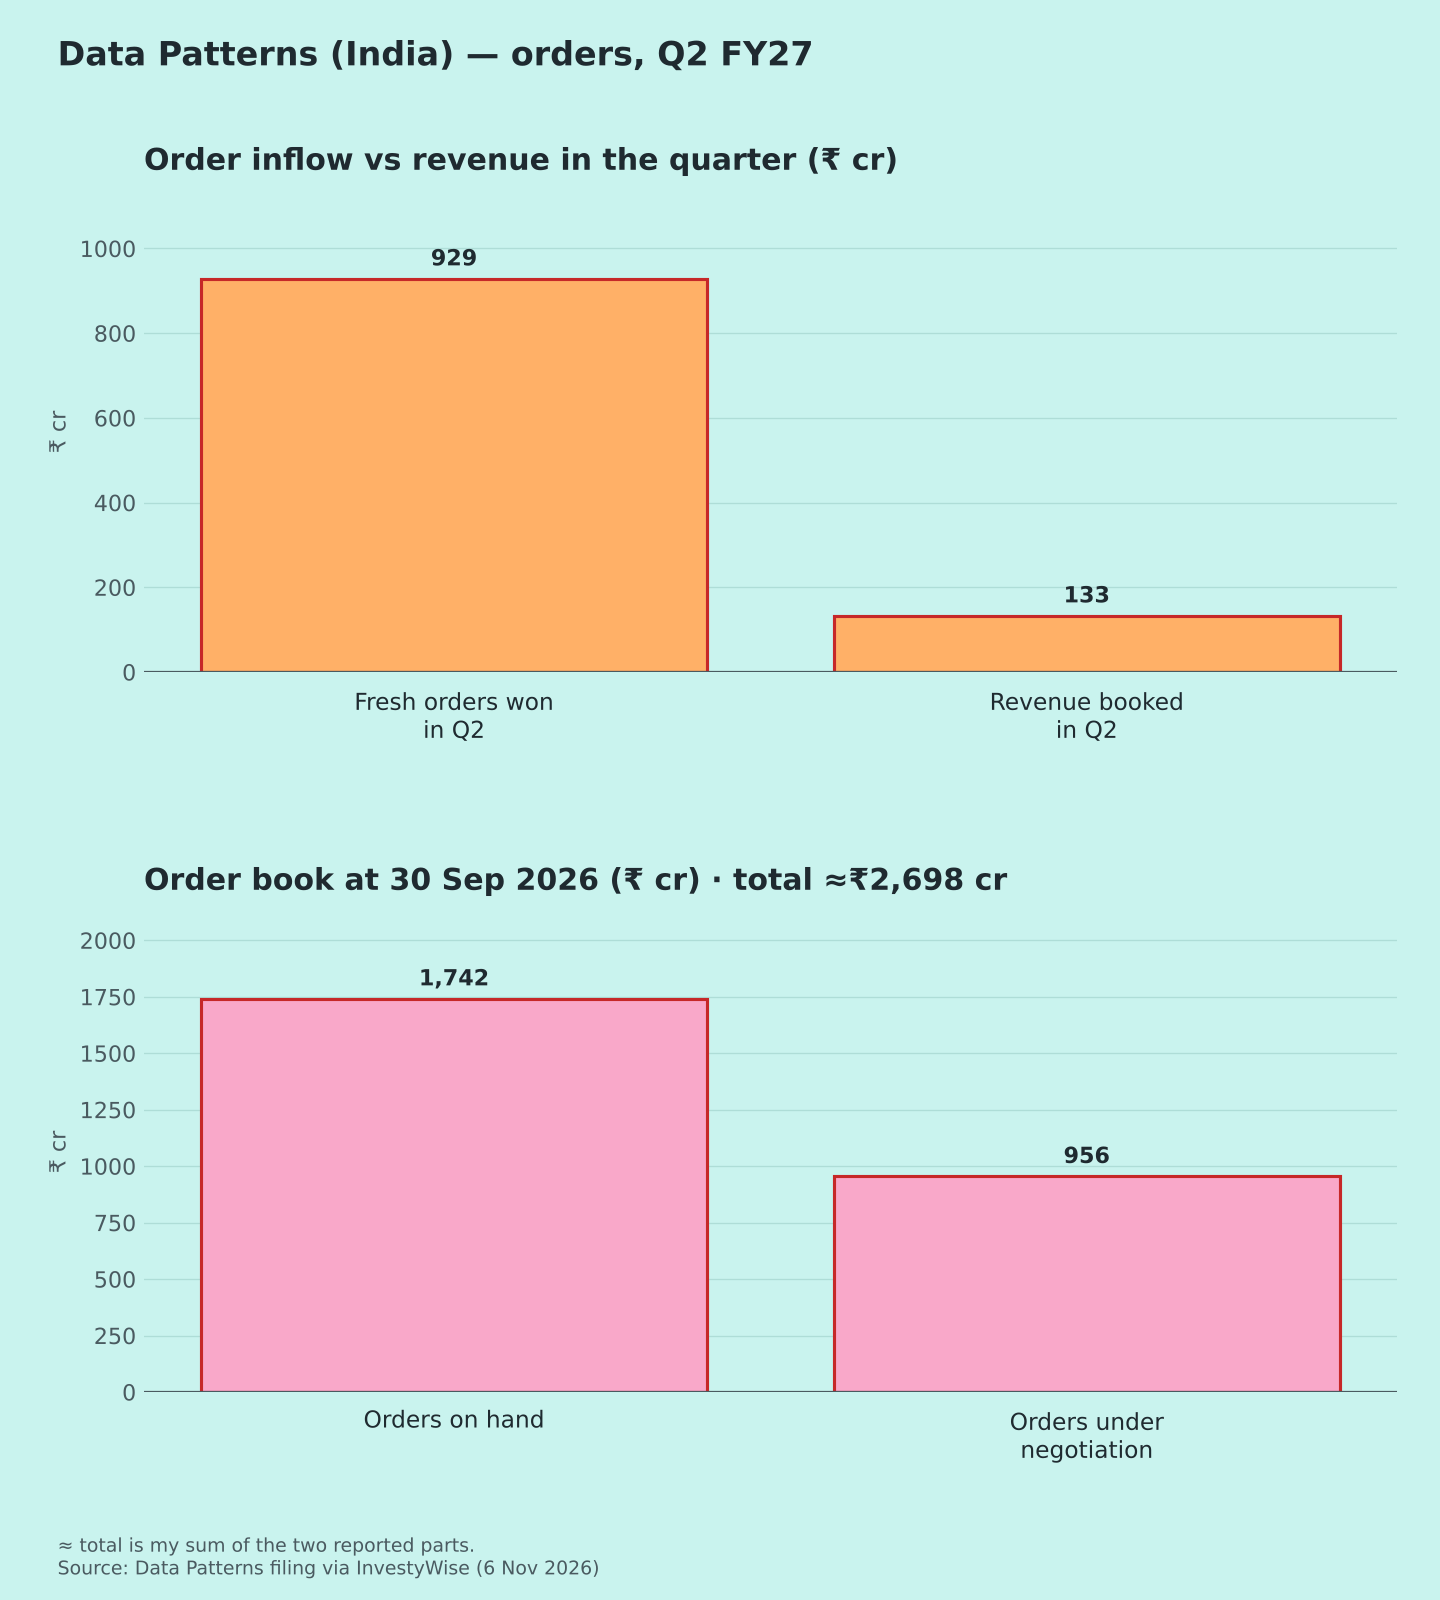
Orders (Chart 4)
- Fresh orders in Q2: ₹929 cr, about 7x the quarter's revenue. H1 orders were ₹1,046 cr, nearly 3x last year.
- Order book: ₹1,742 cr on hand plus ₹956 cr under negotiation.
- My roll-forward from the July figure (₹2,654 cr [5]) doesn't reconcile; please check the investor presentation.
Guidance check (reaffirmed Aug 2026 [5]; "on track" per the CMD on 6 Nov)
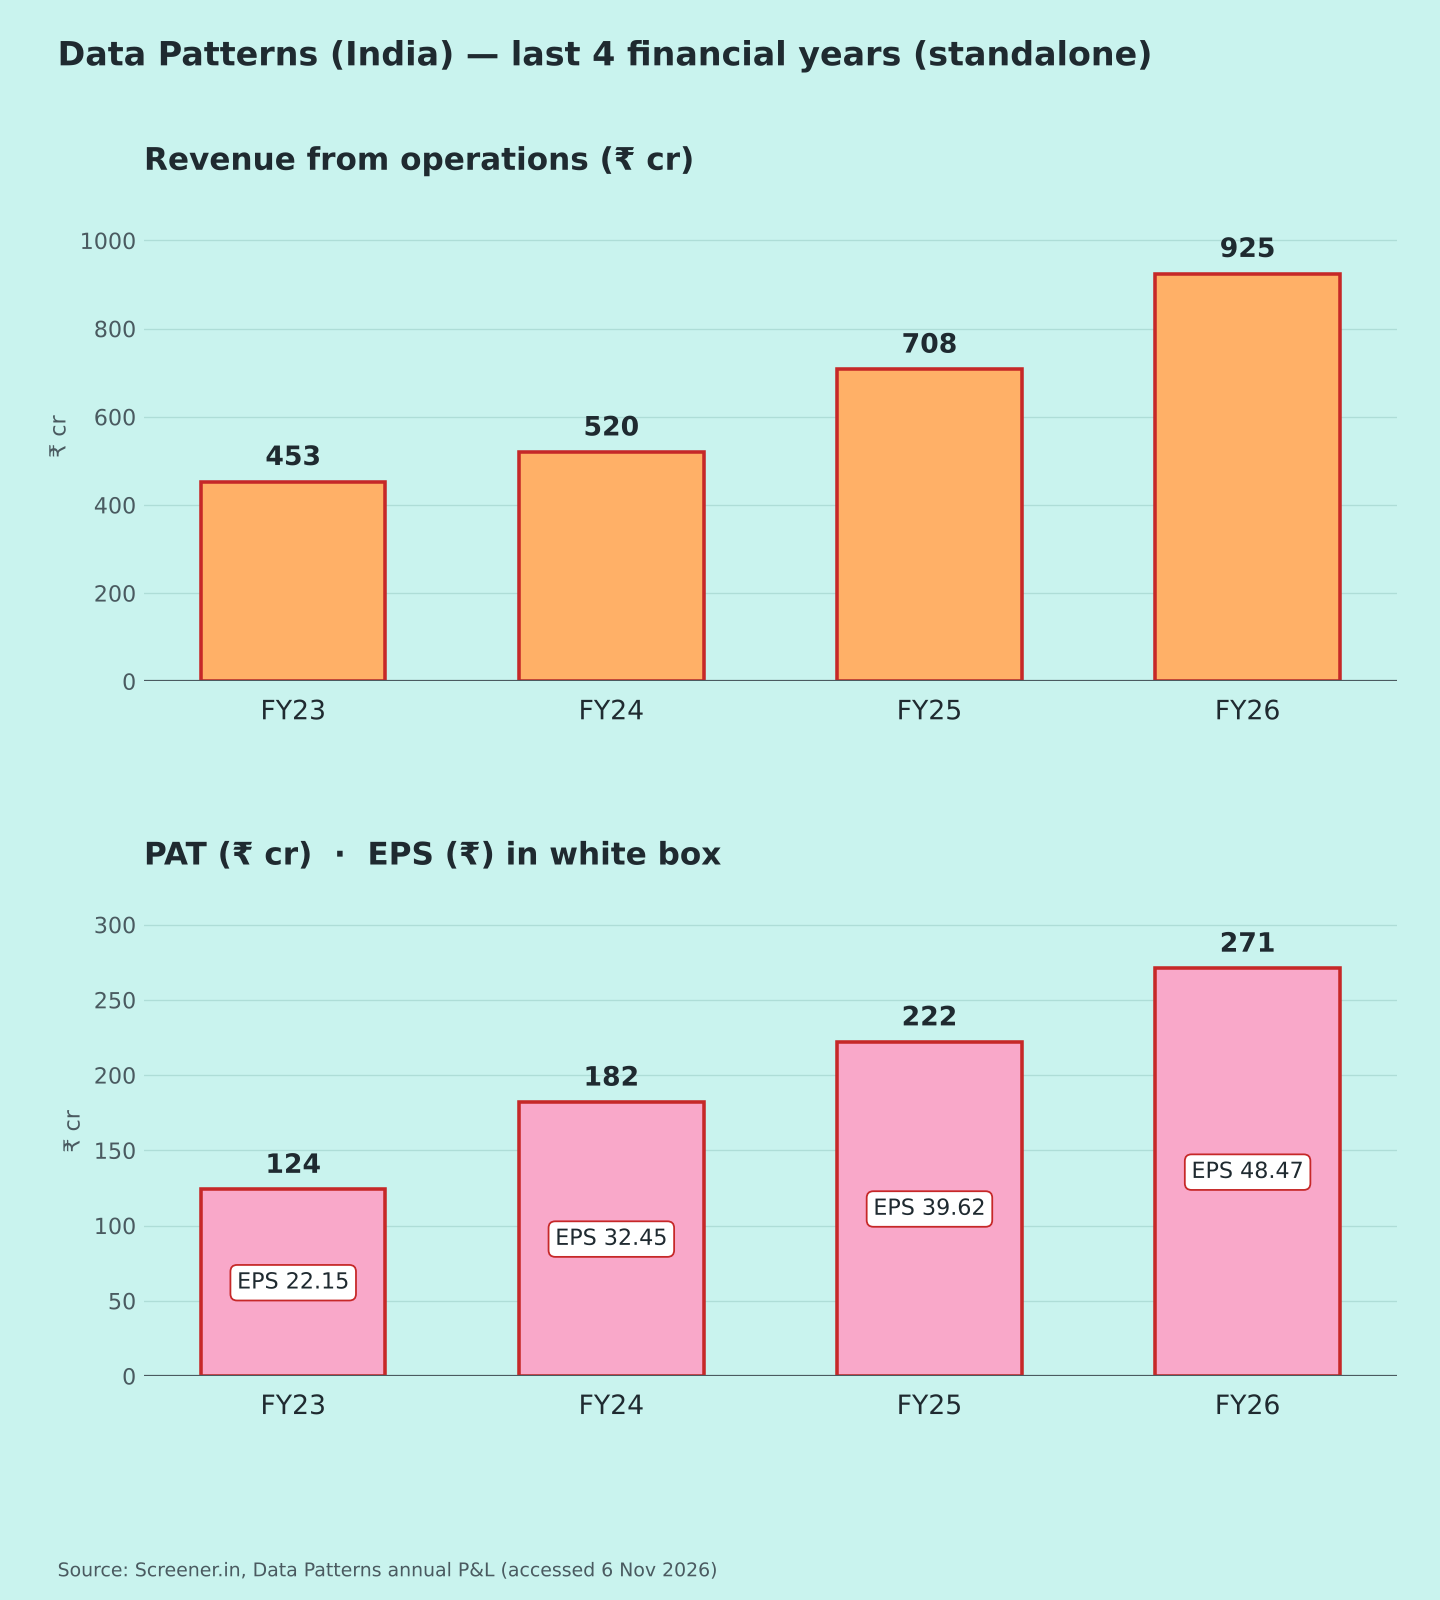
- Revenue: +20–25% guided, which means ₹1,110–1,156 cr on FY26's ₹925 cr. H1 is ₹249 cr, so H2 needs ₹861–907 cr, about 3.5x H1 (my calculation).
- EBITDA margin: 35–40% guided. H1 is 25.2%.
- New orders: ₹2,000 cr guided. H1 has ₹1,046 cr (52%).
Positives
- Order inflow up sharply [1]
- Margins held despite lower revenue [2]
Concerns
- H2 revenue must be ~3.5x H1 (my calculation)
- Order-book figures don't reconcile [1][5]
Things to track in Q3 FY27
- Revenue conversion from the order book
- EBITDA margin vs 35–40%
- Order inflows vs ₹2,000 cr
- Working capital
Not a buy/sell recommendation. I am not a SEBI-registered analyst. Facts are sourced; opinions are labelled.
Sources [1] InvestyWise – results & order book · [2] InvestyWise – unaudited results · [3] InvestyWise – board outcome · [4] Sahi – Q2 consolidated profit · [5] Sahi – FY27 guidance, Aug 2026 · [6] Screener.in – Data Patterns
Charts: (1) 5 quarters revenue & PAT with EPS [2][6]; (2) FY23–FY26 [6]; (3) margins [2][6]; (4) orders [1].