Standalone figures, ₹ crore unless stated. Results approved at the board meeting on 5 Nov 2026. EBITDA excludes other income. YoY/QoQ % and margins are my calculations unless a source gives them.
| Metric | Q2 FY27 | YoY | QoQ |
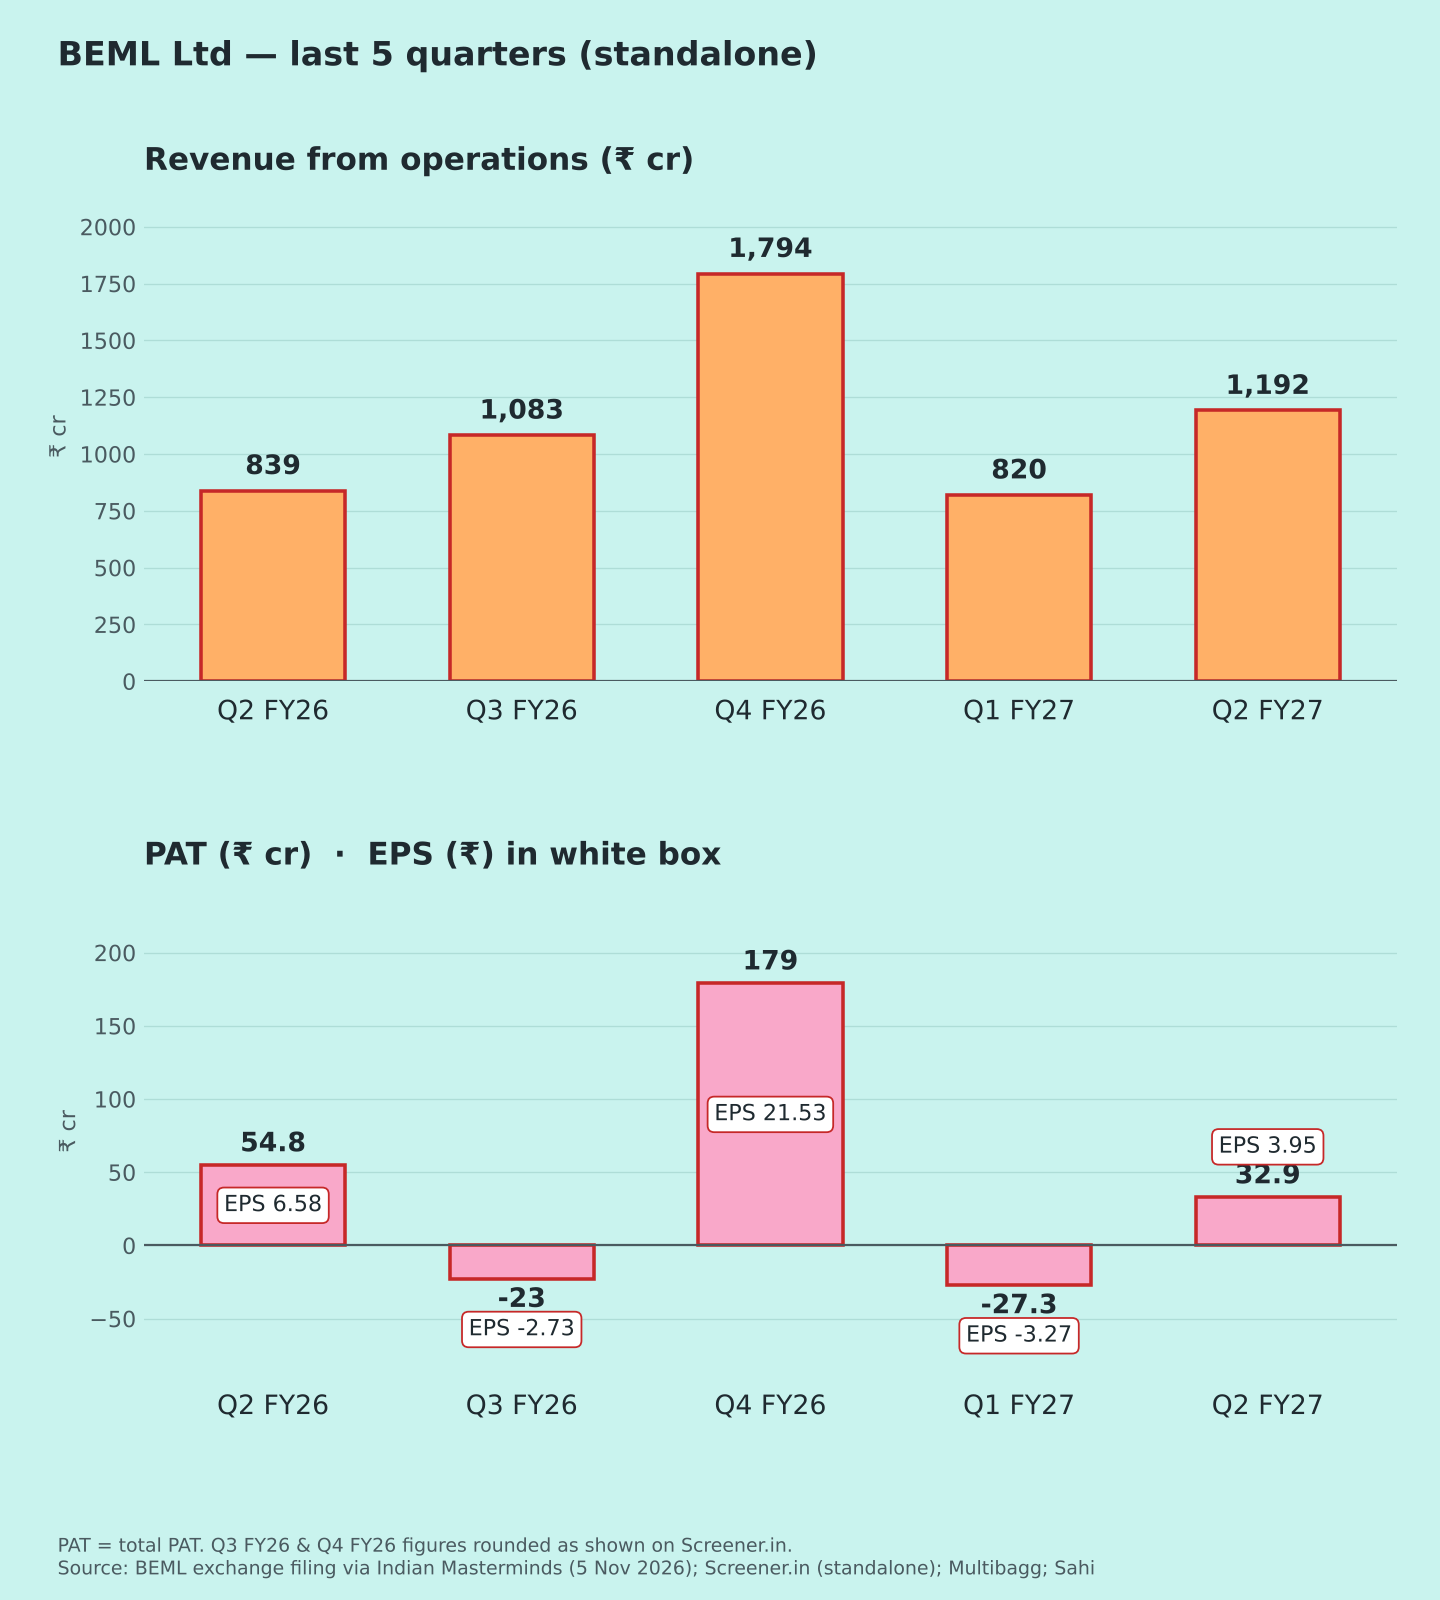
| Revenue from ops | 1,191.6 | +42.0% | +45.4% |
| EBITDA | 80.3 | +10% | from ₹2 cr |
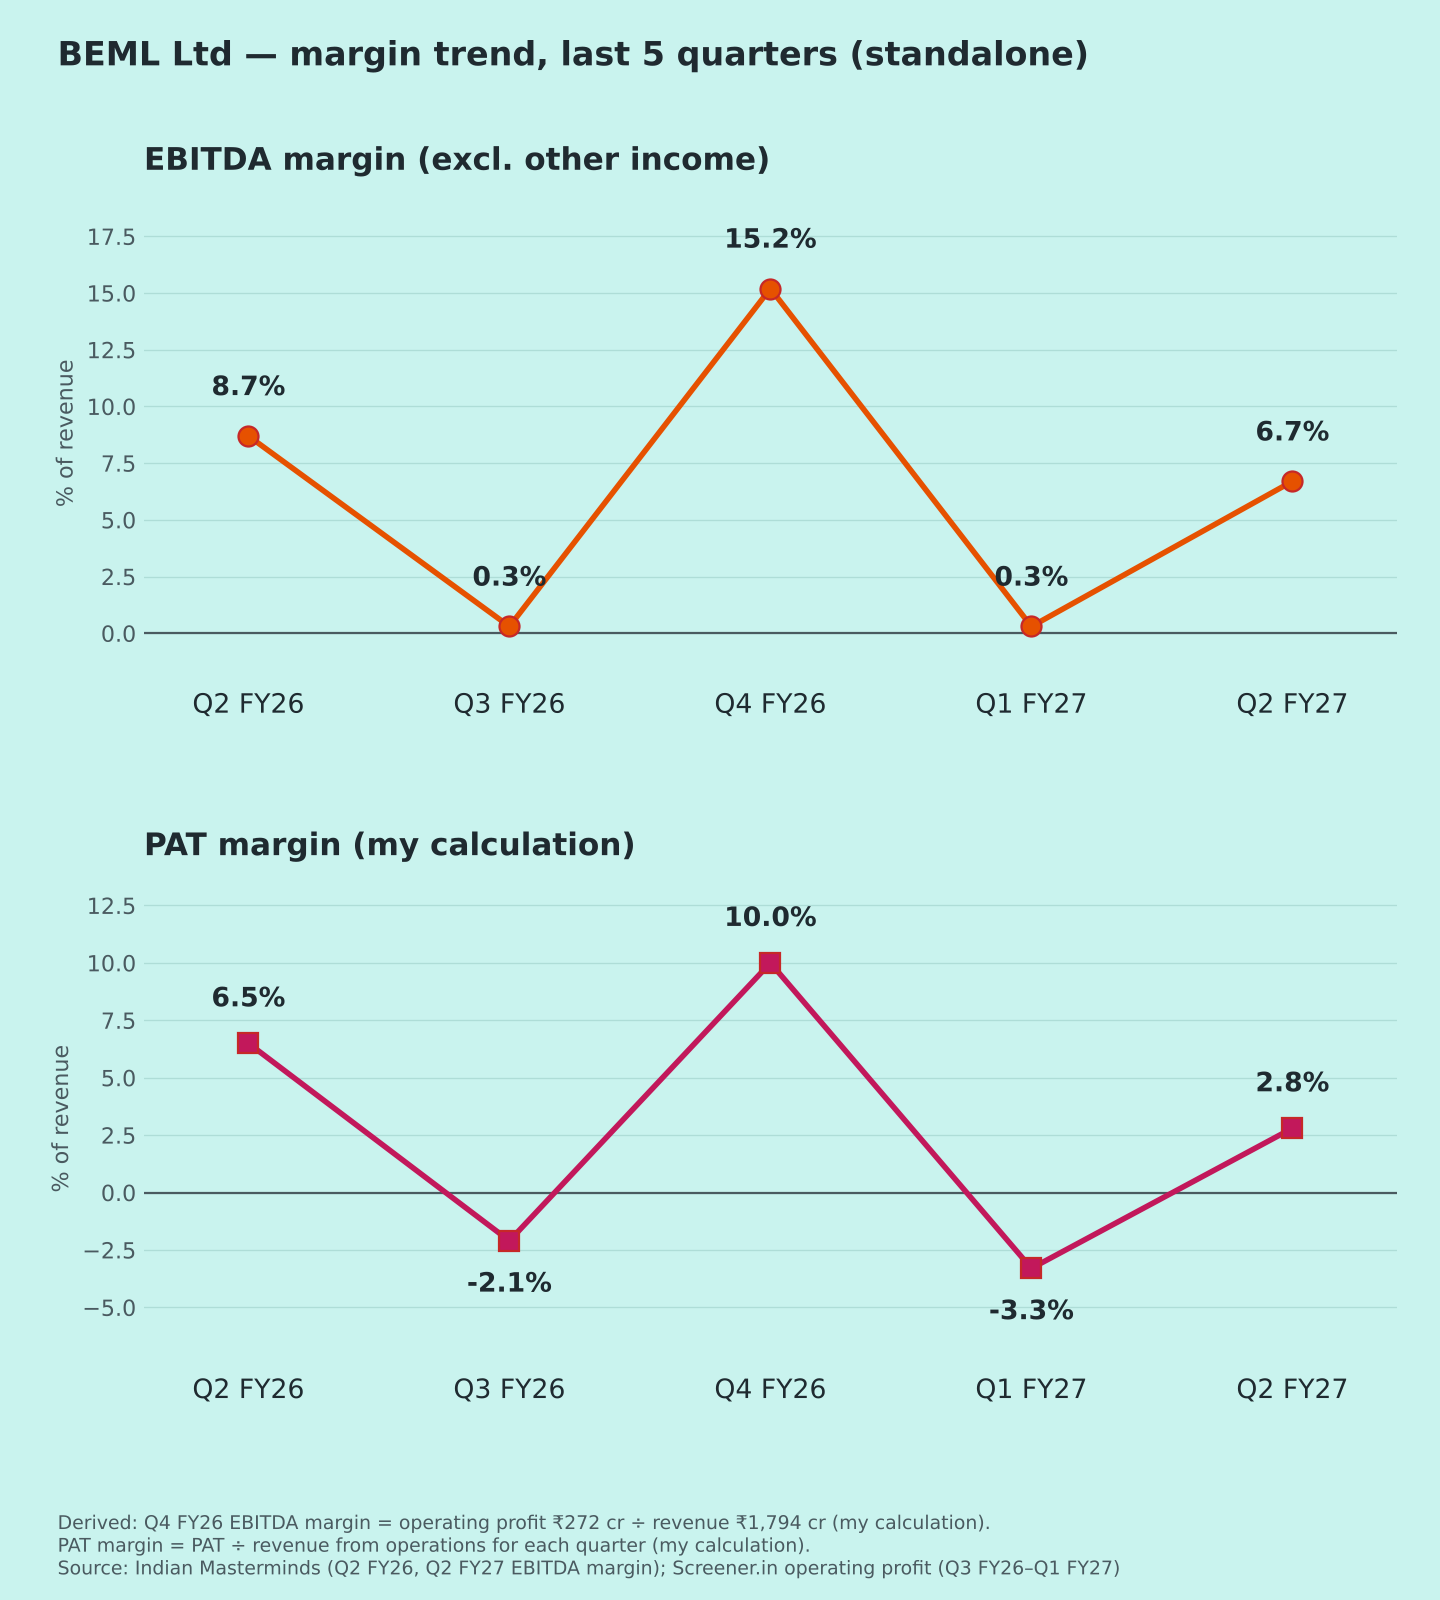
| EBITDA margin | 6.7% | 8.7% | 0.3% |
| PAT | 32.9 | −39.9% | from −₹27.3 cr |
| PAT margin | 2.8% | 6.5% | −3.3% |
| EPS (₹) | 3.95 | −40.0% | from −₹3.27 |
| Other income / PBT | 12.8% | 14.1% | loss quarter |
Margin and ratio rows show the year-ago and last-quarter values, not % change.
Source notes: Consolidated PAT was ₹33.34 cr (EPS ₹4.00) vs ₹48.03 cr, hence headlines saying "down 31%" [1][3][4]; its own figures give −30.6% (my calculation). Coverage doesn't state the EBITDA basis; standalone and consolidated were identical a year ago [5].
Quality of earnings
Revenue growth is operational, but costs grew faster: raw materials +51.6% to ~₹724 cr, other expenses ₹227 cr vs ₹158 cr [1]. So EBITDA rose only 10%.
PBT fell just 5.5% (₹47.3 cr vs ₹50.1 cr) [1]. The bigger PAT fall is tax: ~₹14.4 cr (~30%) this quarter, while a year ago a ~₹4.7 cr tax credit pushed PAT above PBT (my calculation from [1]). So YoY PAT is depressed by the base; PBT is the fairer read.
Other income (~₹6 cr, derived as total income minus revenue) is ~13% of PBT. No exceptional item is reported [1].
Auditors flagged an "emphasis of matter": ₹74.89 cr invested in the MAMC consortium plus ₹6.24 cr of advances. MAMC is under liquidation; management says the money is recoverable [4].
Margins (Chart 3)
EBITDA margin: 8.7% → 0.3% → 15.2% → 0.3% → 6.7% [1][5]. Revenue is back-loaded (roughly 10/20/30/40% across quarters, per management [8]), and fixed costs such as employee cost (~₹219 cr [1]) weigh on smaller quarters. So YoY is the fairer comparison.
Guidance vs progress (Q1 call, 13 Aug 2026)
- Revenue: "High 20s" FY27 growth guided. H1 is +36.5% (₹2,011 cr vs ₹1,473 cr) [1]. At 28% growth, FY27 would be ~₹5,570 cr; H1 is ~36% of it, and H2 needs ~₹3,560 cr, ~24% above H2 FY26 (my calculation).
- EBITDA margin: "At least 13%" guided for FY27. H1 is ~4.1% (₹82 cr on ₹2,011 cr). Reaching 13% would need ~18% in H2, against ~9.6% in H2 FY26 (my calculation from [1][5][6]).
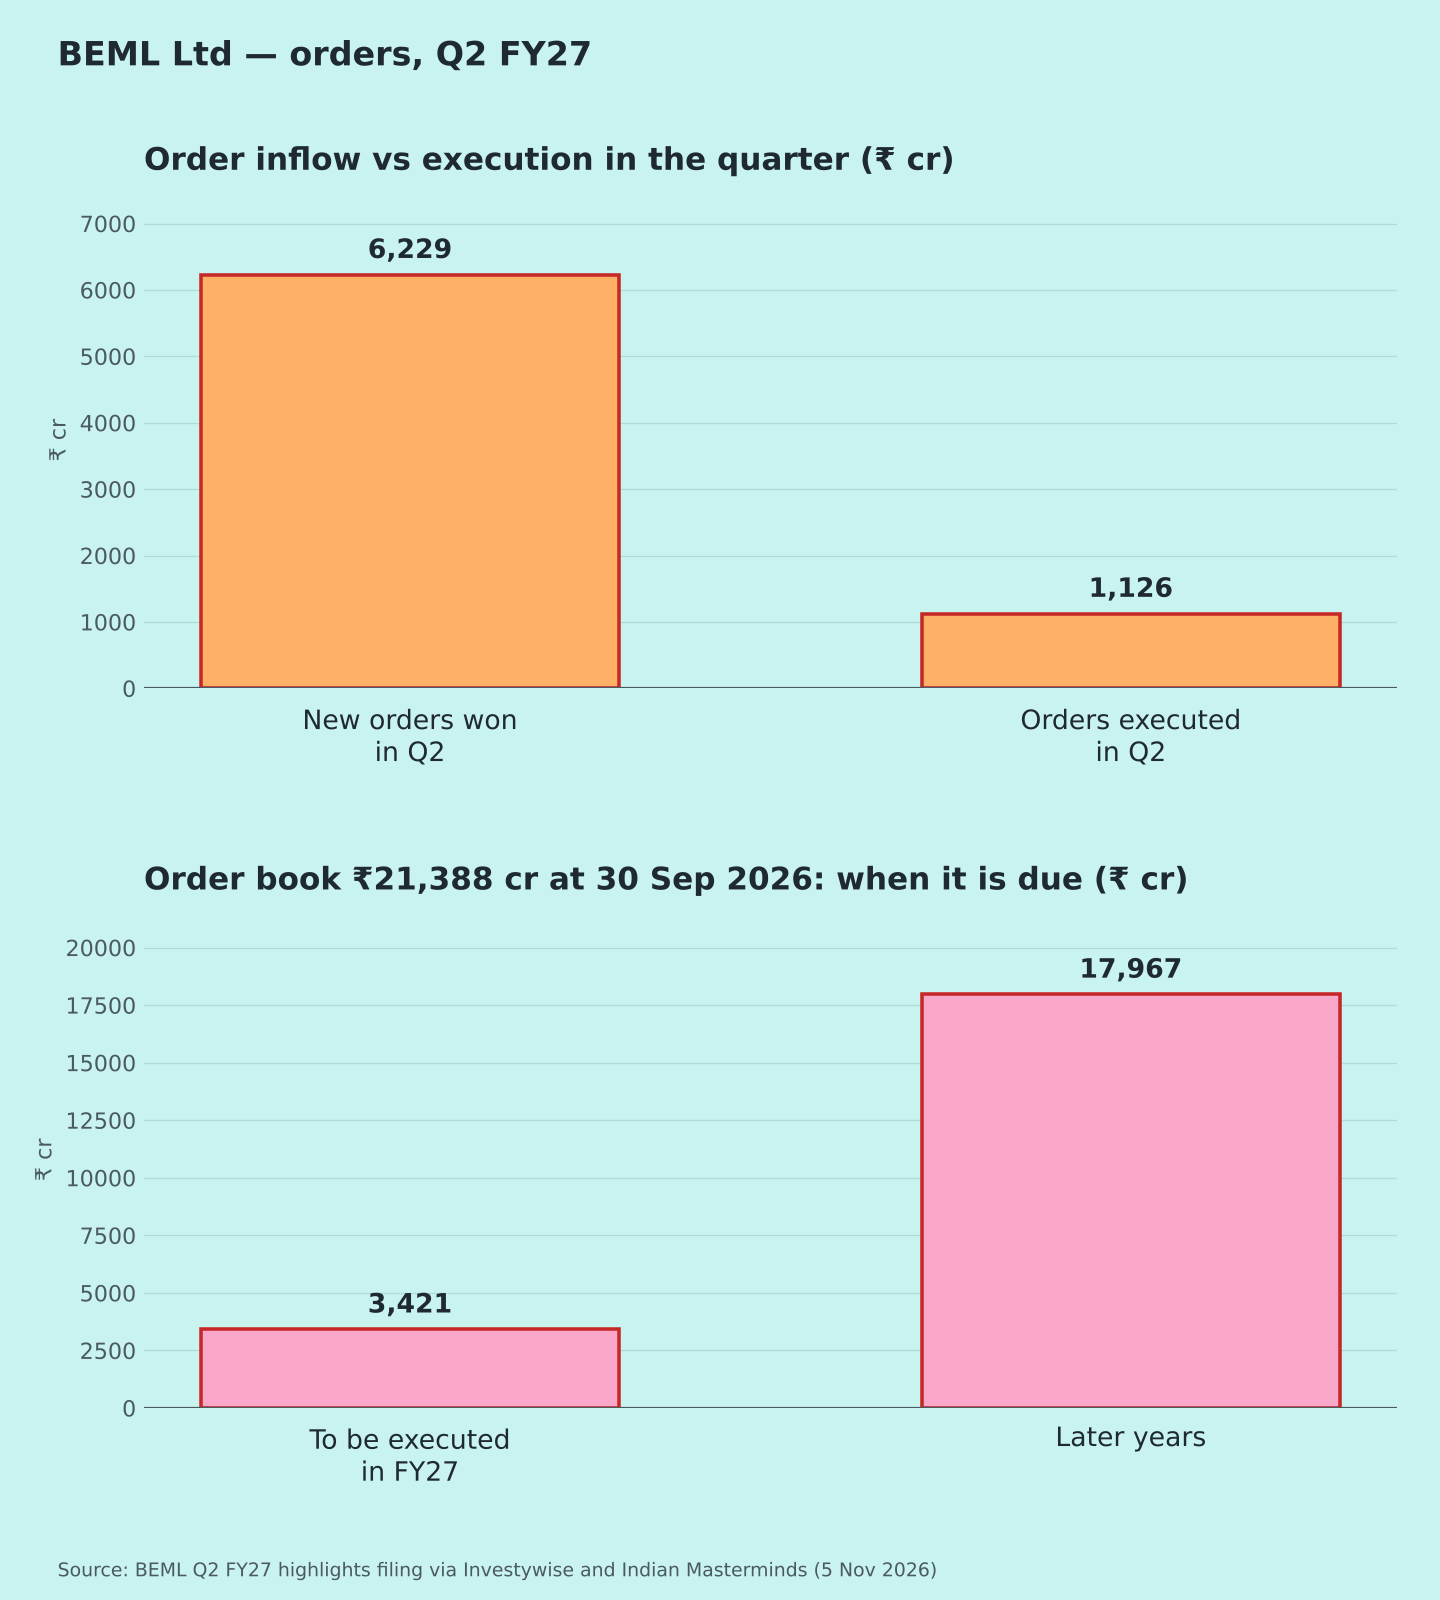
- Orders: Q2 alone brought ₹6,229 cr [2][8]. Only ₹3,421 cr of the ₹21,388 cr order book is due this year [2], below the ~₹3,560 cr H2 figure, so short-cycle orders may be needed (my view).
Positives
- Revenue +42% YoY, ahead of guidance
- Q2 order inflow of ₹6,229 cr; order book ~4.9x FY26 revenue (my calculation) [2][5]
Concerns
- Margin down 2 points YoY despite higher revenue [1]
- 13% FY27 margin guidance needs a sharp H2 jump (my view)
- MAMC exposure (~₹81 cr) flagged by auditors [4]
Things to track in Q3 FY27
- EBITDA margin vs the 13% FY27 guidance
- Raw-material cost as % of revenue
- Order inflow vs the ₹20,000 cr target
- Any update on MAMC recovery
Not a buy/sell recommendation. I am not a SEBI-registered analyst. Facts are sourced; opinions are labelled.
Sources [1] Indian Masterminds – BEML Q2 FY27 results · [2] Investywise – Q2 FY27 highlights, order book · [3] Investywise – board meeting outcome · [4] Whalesbook – Q2 profit, MAMC note · [5] Screener.in – BEML standalone · [6] Multibagg – Q1 FY27 figures · [7] Sahi – Q1 standalone loss · [8] BEML – Q1 FY27 earnings call transcript, 13 Aug 2026
Charts:
(1) last 5 quarters revenue & PAT with EPS ;
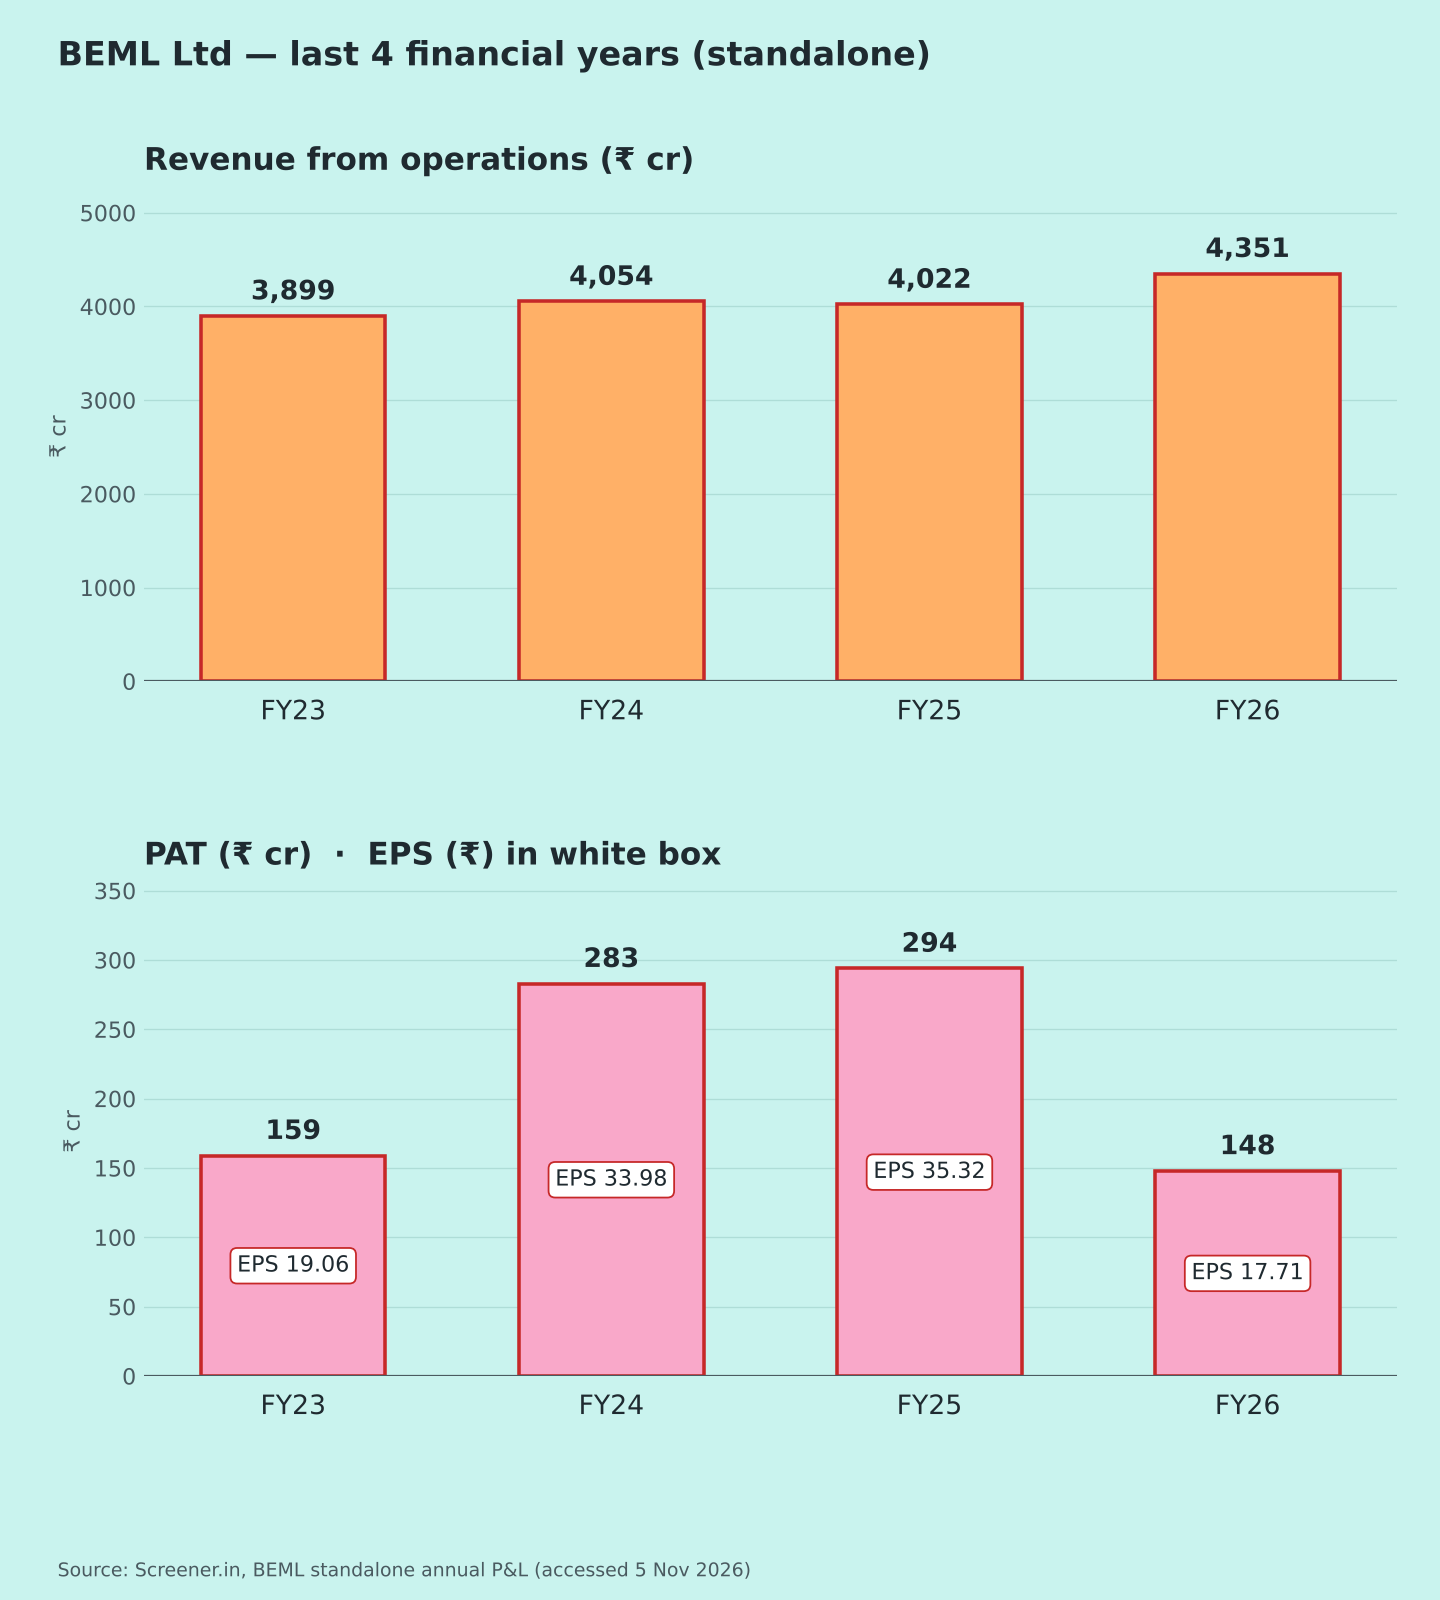
(2) FY23–FY26 revenue & PAT with EPS [5];
(3) EBITDA & PAT margin [1][5];
(4) order inflow, execution and order-book timing [1][2].