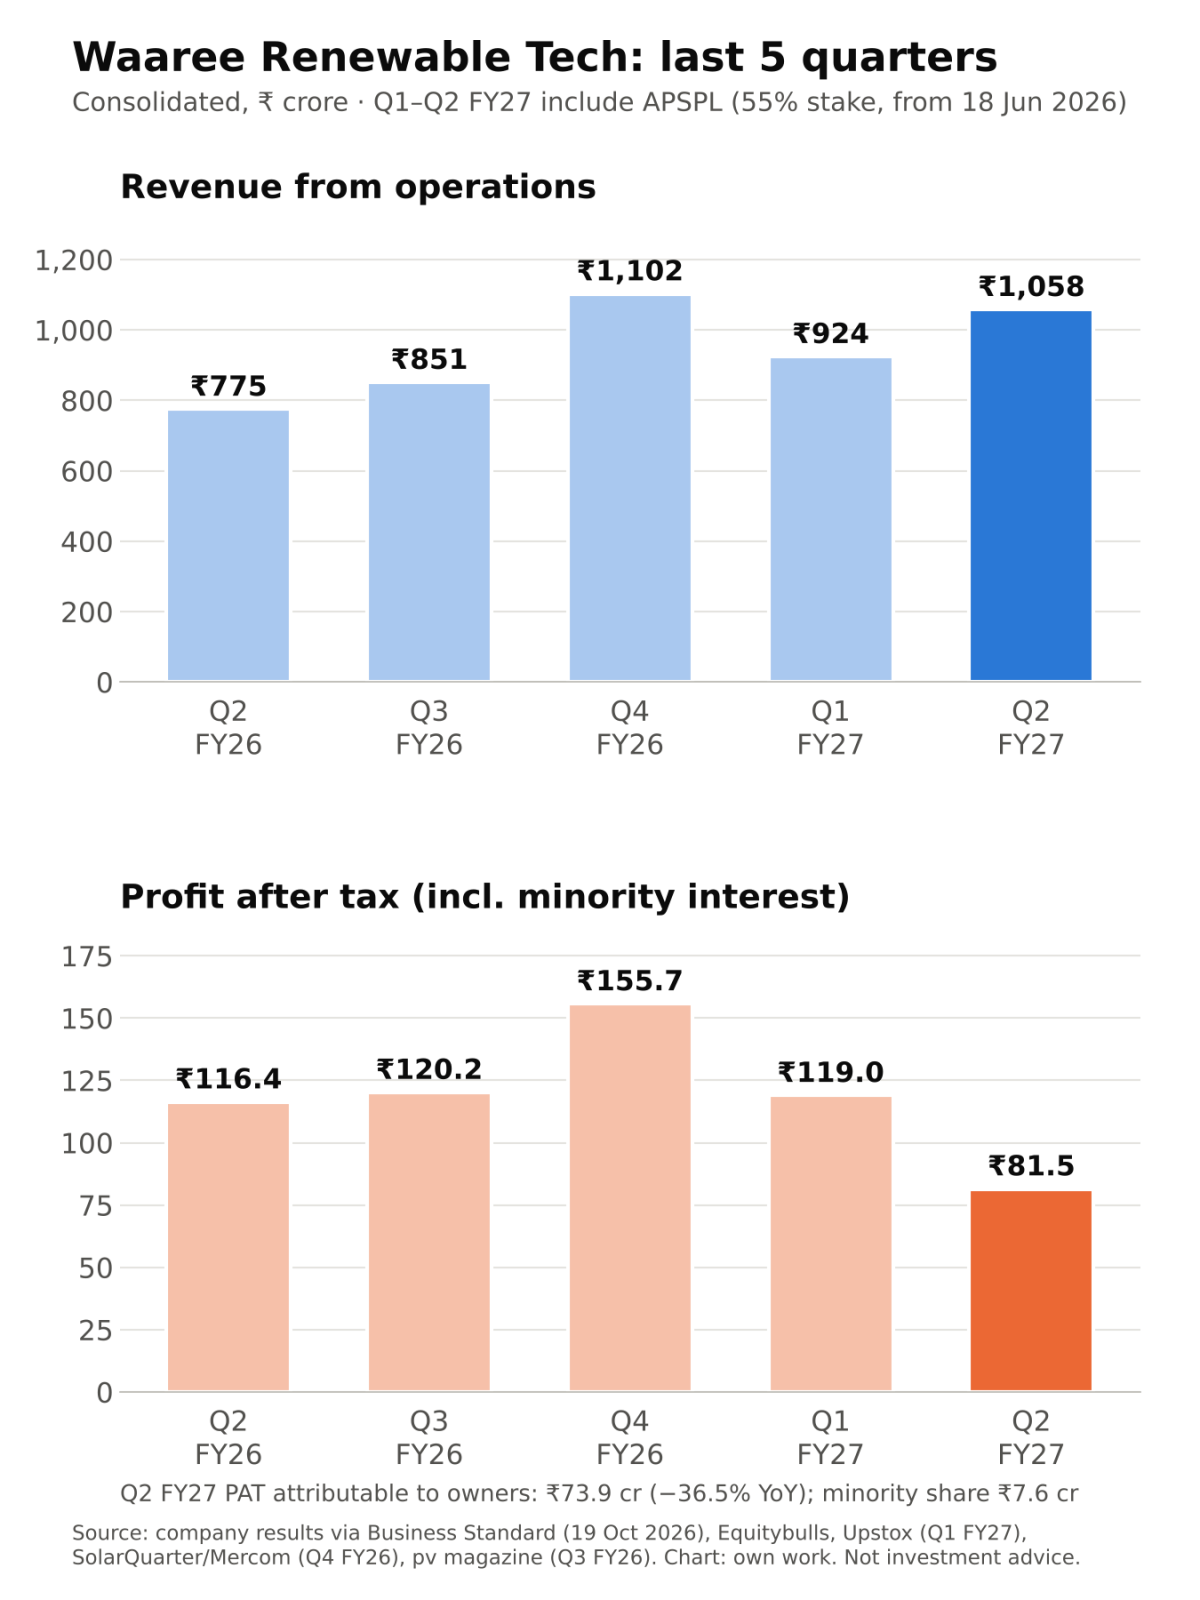
All figures are consolidated, in ₹ crore unless stated. Results were filed after market hours on 19 Oct 2026. YoY/QoQ % and margins are my own calculations from reported numbers. The 55% stake in APSPL (T&D EPC) was consolidated from 18 Jun 2026, so YoY comparisons are not like-for-like [4].
| Metric | Q2 FY27 | YoY | QoQ |
| Revenue from ops | 1,057.8 | +36.5% | +14.5% |
| EBITDA | 160.0 | +1.3% | −7.8% |
| EBITDA margin | 15.1% | 20.4% | 18.8% |
| PBT | 105.4 | −32.7% | −35.5% |
| PAT | 81.5 | −30.0% | −31.5% |
| PAT to owners | 73.9 | −36.5% | −36.2% |
| PAT margin | 7.7% | 15.0% | 12.9% |
| Other income / PBT | 8.7% | 2.8% | – |
Sources: [1][2][5]
Quality of earnings
Revenue growth is entirely inorganic. Solar EPC revenue fell 42% YoY to ₹445 cr, while the new T&D segment added ₹606 cr [3]. Standalone revenue dropped 44% QoQ to ₹452 cr [2].
Below EBITDA, finance costs rose to ₹36.8 cr from ₹3.6 cr, and D&A to ₹27.0 cr from ₹2.2 cr [2]. Borrowings rose to ₹1,413 cr from ₹82 cr in March [3]. Other income doubled to ₹9.2 cr; PBT excluding it was ₹96.2 cr (my calculation). The tax rate eased to ~23% from ~26%, which cushioned PAT slightly. No exceptional items are reported [2].
Base effect: the Q2 FY26 base was not weak (20.4% EBITDA margin) [1]. The profit decline comes from this quarter's costs, not from a high-low comparison.
Source note: some outlets headline "PAT −30%" (₹81.5 cr, total) and others "−36%" (₹73.9 cr, owners' share) [1][10]. Both are correct; they are different lines.
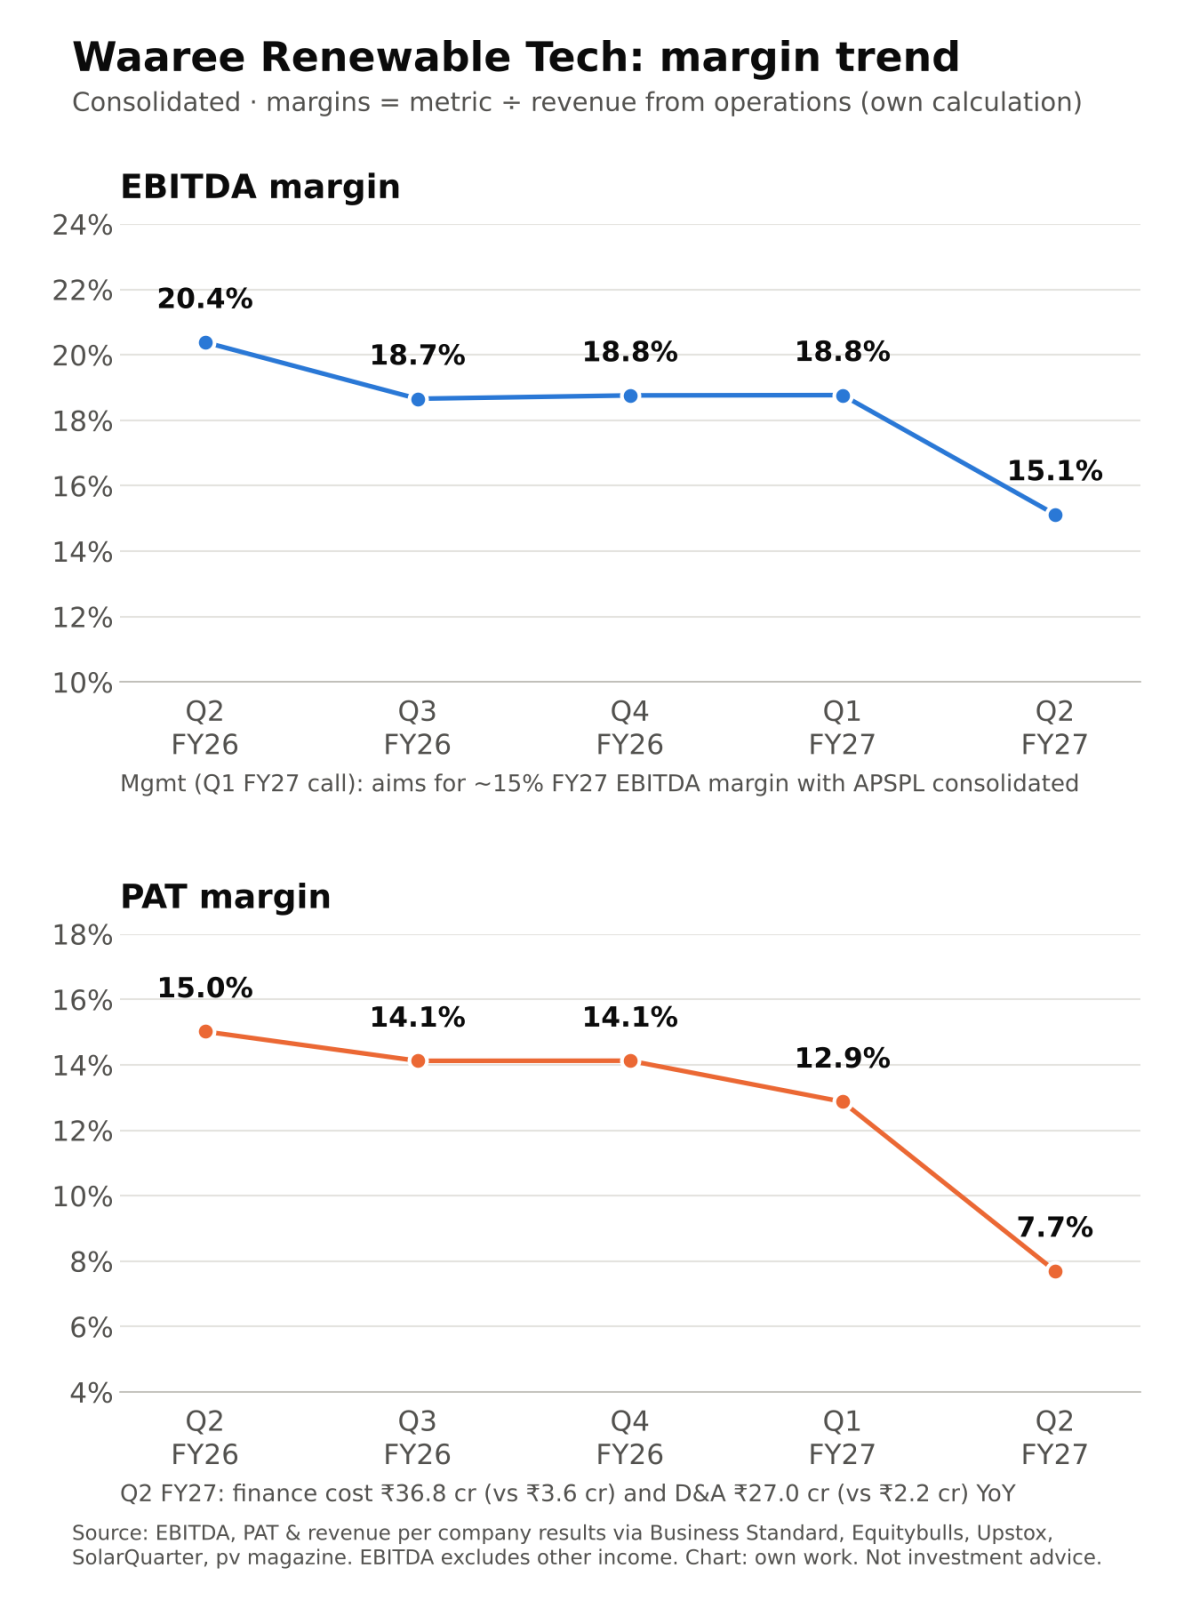
Margins (Chart 3)
EBITDA margin over five quarters: 20.4% → 18.7% → 18.8% → 18.8% → 15.1%. The Q2 drop reflects the lower-margin T&D mix, per the CFO [1]. Solar EPC segment margin actually improved, to ~22.9% from ~19.8% [3]. PAT margin fell more sharply, from 15.0% to 7.7%, because of acquisition debt and amortisation (interpretation).
Guidance: what changed
- Margin: On the Q1 call, management said it would aim for ~15% FY27 EBITDA margin with APSPL included [6]. Q2 is at that level, and H1 is at 16.8%.
- Deal timeline: APSPL (₹1,225 cr for ~55%) was expected to close by 30 Apr 2026 [9]. It closed on 18 Jun [4]. The deal was ~75% debt-funded [6].
- Order book: ₹5,500+ cr, up from ₹5,300+ cr in Q1 [1][13].
- Bidding pipeline: Solar shrank to 34.6 GWp from 37 GWp. BESS grew to 12.5 GWh from 10 GWh, and T&D to ₹21.9k cr from ₹20k cr [1][13].
- Capex: A new 35 MWp IPP plant at Wardha [4].
The Q2 call is scheduled for 4 PM today (21 Oct) [12]. Updated guidance isn't available yet.
Market reaction (interpretation)
20 Oct was a market holiday [15]. On 21 Oct the stock opened 10.9% lower at ₹735.75 and hit a 52-week low of ₹725 (−12.2%) [10][11]. These are intraday figures; the close may differ.
Likely reasons: profit fell despite +36% revenue, organic solar EPC revenue shrank sharply, debt rose meaningfully, and the solar pipeline narrowed.
Positives
- Solar EPC segment margin up ~310 bps YoY [3]
- Order book and BESS/T&D pipelines growing [1][13]
- EBITDA margin in line with the earlier ~15% indication [6]
Concerns
- Organic solar execution weak: standalone PAT down 42% YoY [2]
- Interest plus D&A at ₹63.8 cr, vs ₹5.8 cr a year ago [2]
- Borrowings now material for an asset-light EPC business (my view)
- Minority interest (45% of APSPL) took ₹7.6 cr of Q2 PAT [2]
Things to track in Q3 FY27
- Solar EPC revenue: does Q2's dip reverse?
- T&D (APSPL) margin improvement, which management calls "ongoing" [6]
- Borrowings and finance cost trajectory
- Order inflows, especially BESS conversions
Not a buy/sell recommendation. I am not a SEBI-registered analyst. Facts are sourced; opinions are labelled.
Sources [1] Business Standard, 19 Oct 2026 · [2] Equitybulls – Q2 FY27 consolidated & standalone · [3] Saur Energy – segments · [4] Free Press Journal · [5] Upstox – Q1 FY27 · [6] Multibagg – Q1 FY27 call · [7] SolarQuarter – FY26 · [8] pv magazine – Q3 FY26 · [9] Outlook Business – APSPL deal · [10] Univest, 21 Oct · [11] MarketsMojo, 21 Oct · [12] NSE call intimation · [13] Angel One – Q1 FY27 · [14] pv magazine – FY24 · [15] Outlook Business – 2026 market holidays
Charts: (1) last 5 quarters revenue & PAT [1][5][7][8];
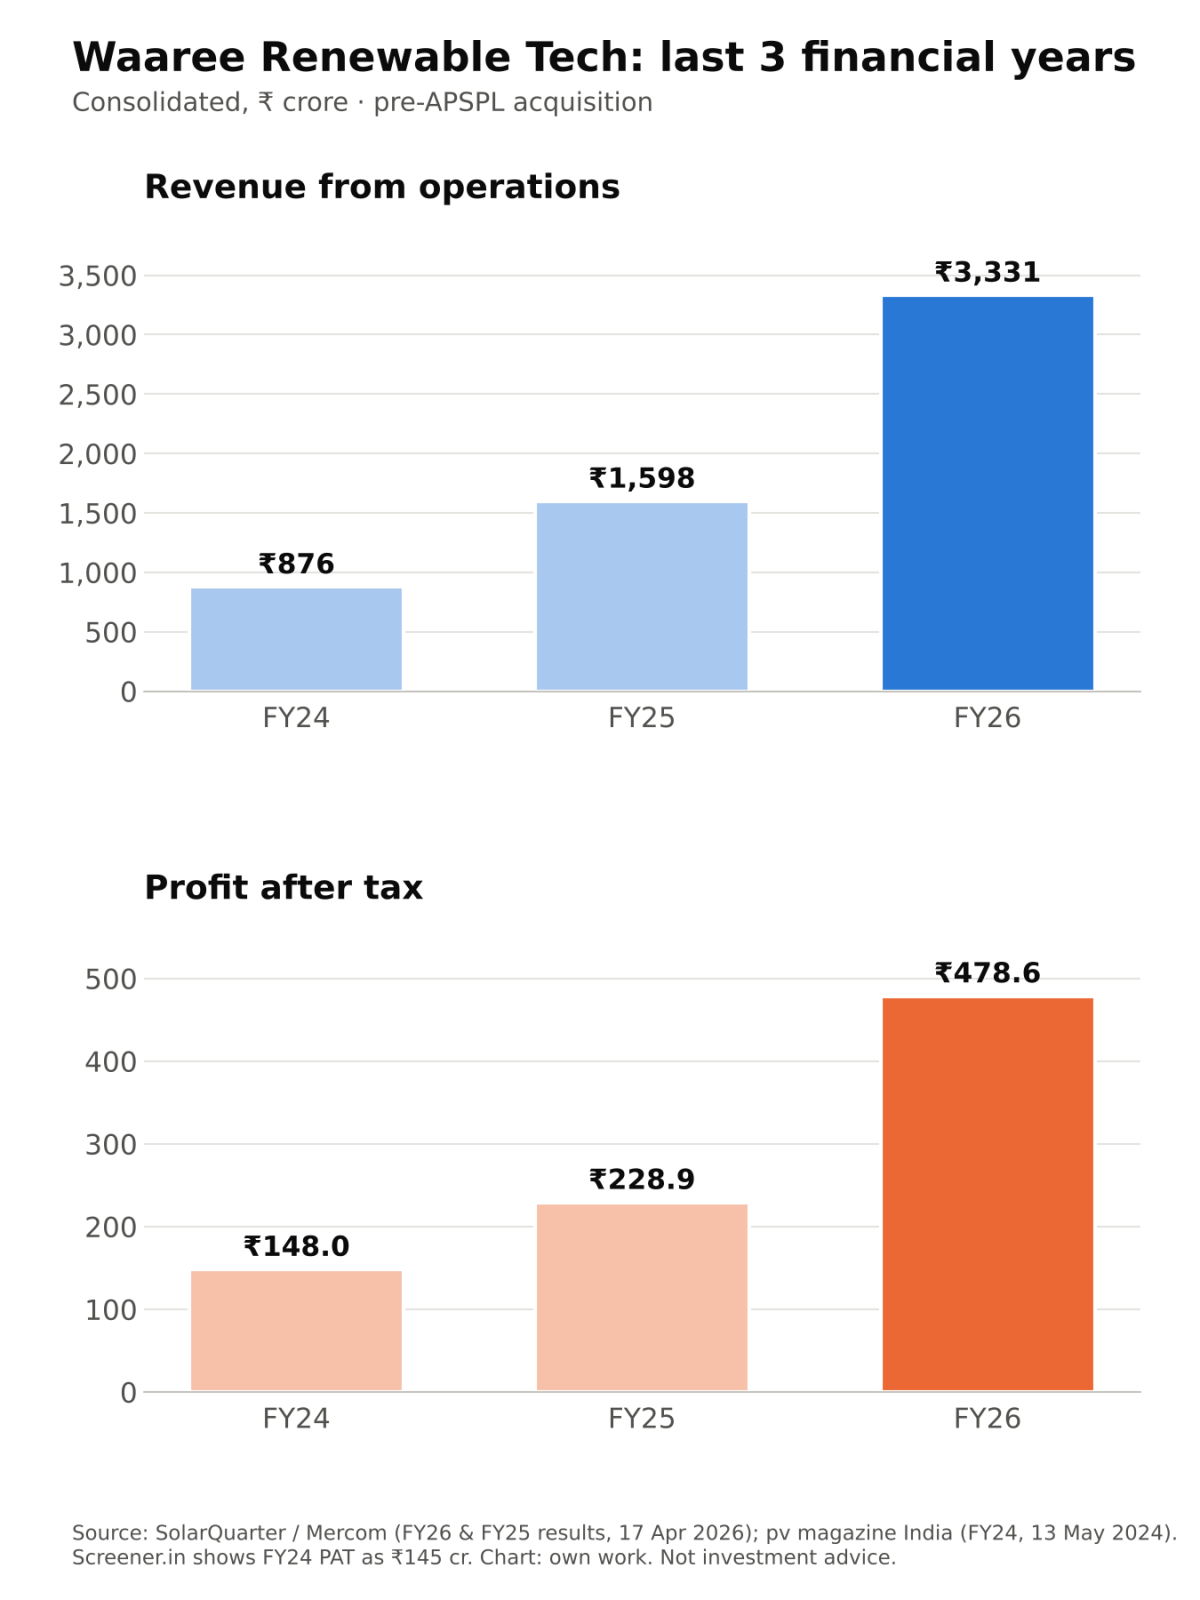
(2) FY24–FY26 revenue & PAT [7][14];
(3) EBITDA & PAT margin trend (own calculations).