Tatva Chintan Pharma Chem (TATVA): Q2 FY27 results analysis (quarter ended 30 Sep 2026)
All figures consolidated, ₹ crore unless stated. Results released after market hours on 19 Oct 2026 [1]. EBITDA excludes other income (as reported by the company). YoY/QoQ %, margins and ratios are my calculations from reported numbers.
| Metric | Q2 FY27 | YoY | QoQ |
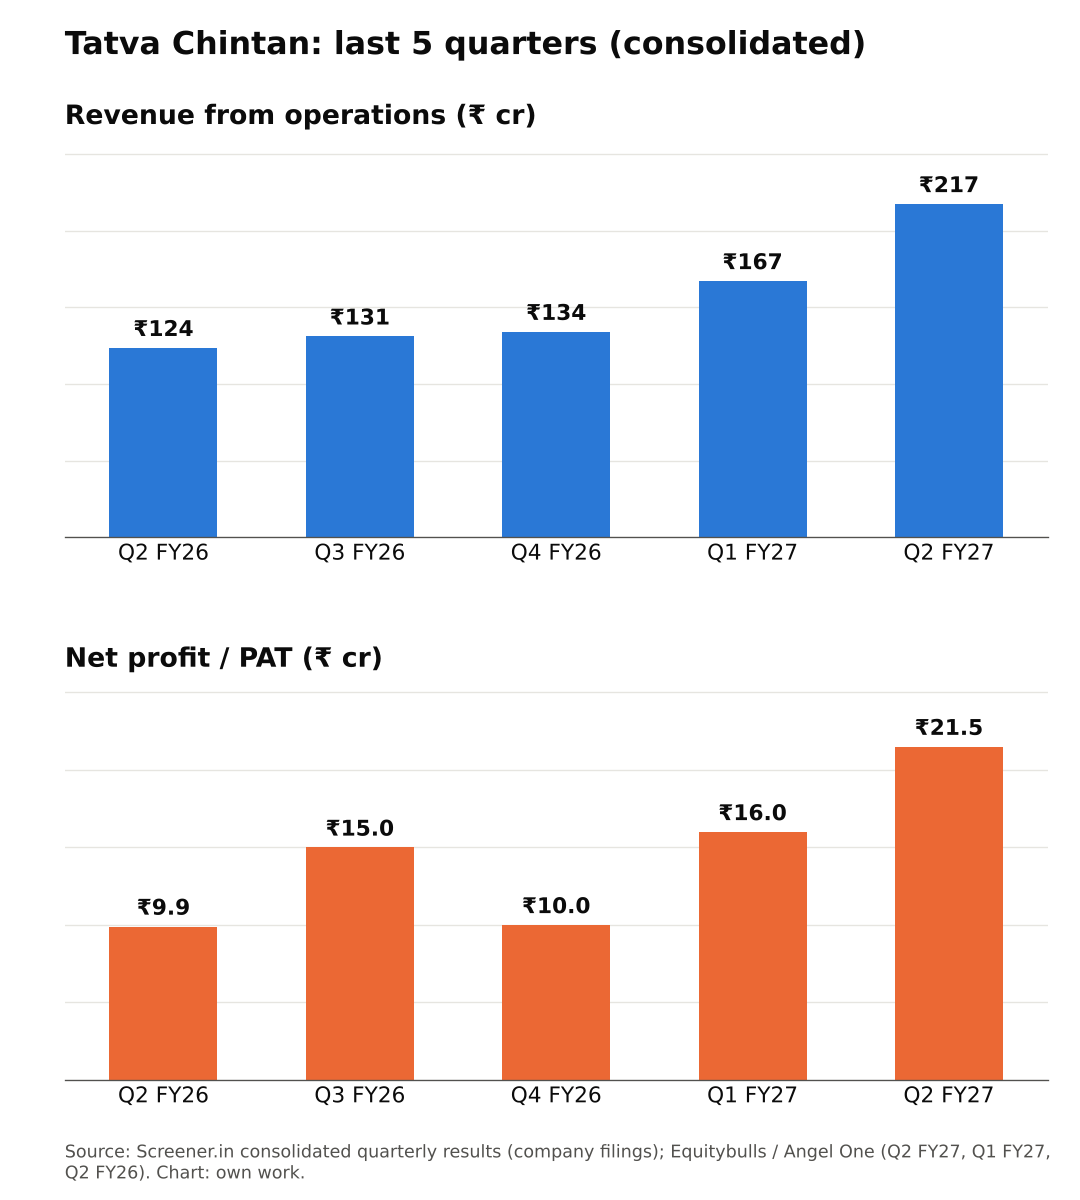
| Revenue from ops | 217.3 | +76.0% | +30.0% |
| EBITDA | 40.7 | +83.3% | +26.0% |
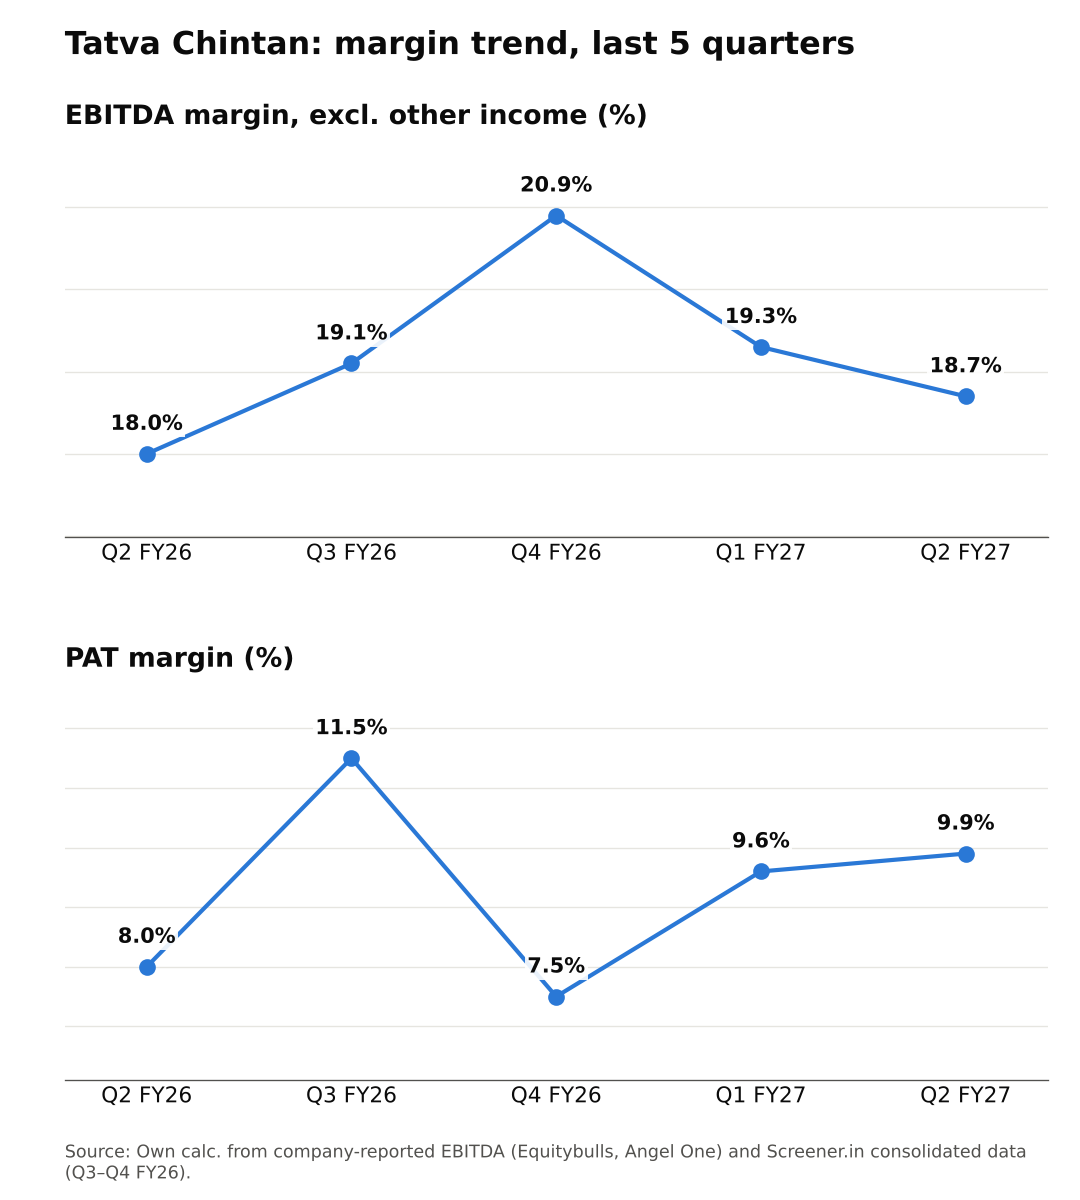
| EBITDA margin | 18.7% | 18.0% | 19.3% |
| PBT | 28.9 | +110.9% | +37.0% |
| PAT | 21.5 | +117.2% | +34.4% |
| PAT margin | 9.9% | 8.0% | 9.6% |
| Other income / PBT | 6.2% | 7.3% | 12.8% |
Sources: [1][2]
Quality of earnings
Growth is operational: revenue +76%, EBITDA +83% [1]. Other income is small (₹1.8 cr, ~6% of PBT) [1]. The tax rate is ~26% vs ~28% a year ago [1], so there is no tax boost. No exceptional item is reported.
Standalone PAT was ₹15.4 cr vs consolidated ₹21.5 cr [3]. So subsidiaries contributed meaningfully this quarter (my calculation).
Working capital grew sharply. Inventory rose 27% and receivables 50% vs March [4]. That is broadly in line with the revenue step-up, but it ties up cash as the company scales (my view).
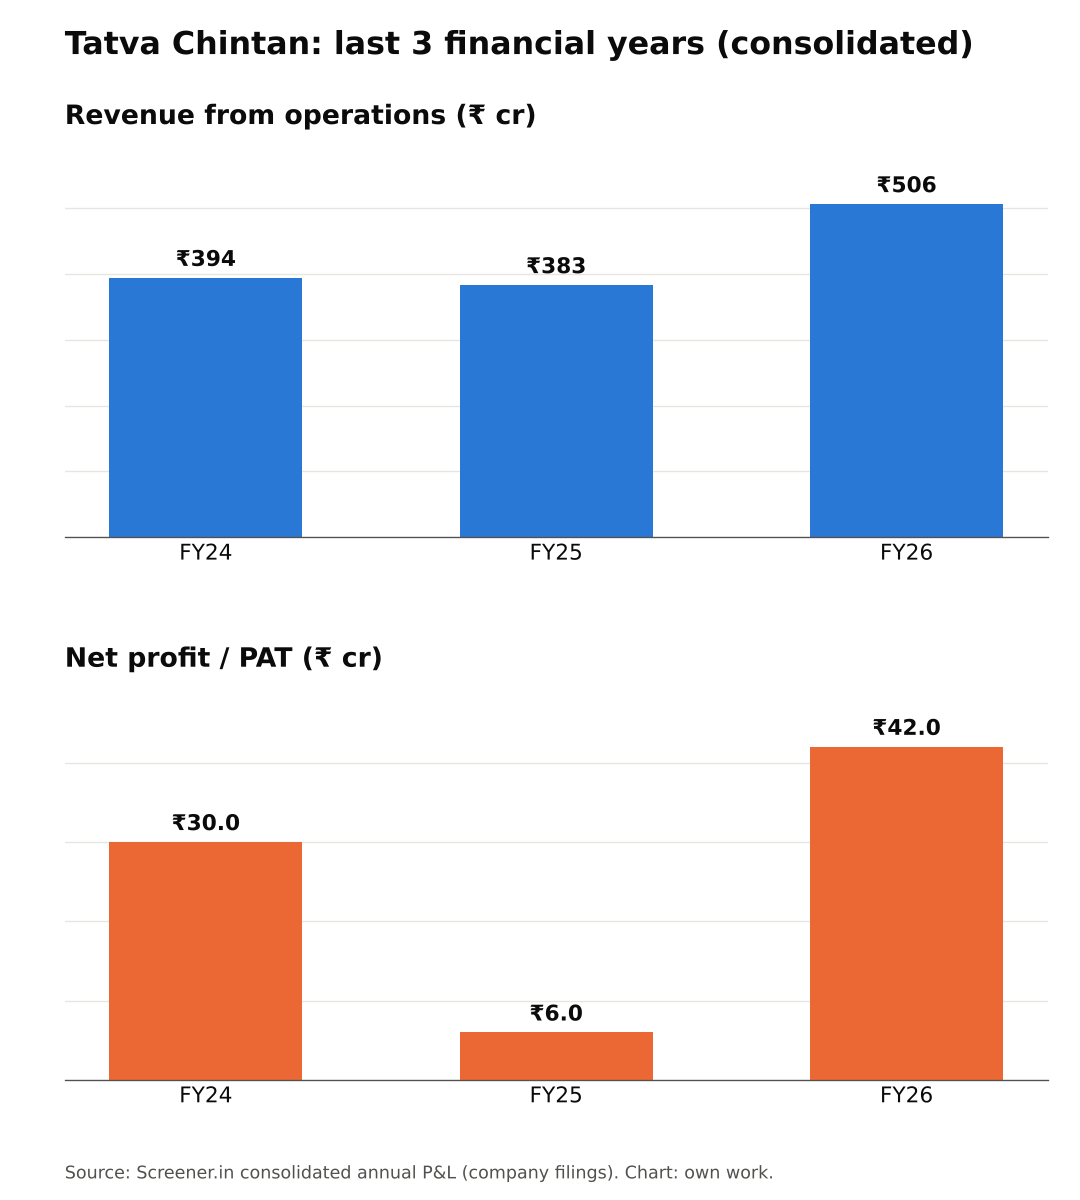
Base effect: Q2 FY26 PAT was ₹9.9 cr [1]. FY25 was a very weak year (PAT ₹6 cr) [5]. So the YoY growth starts from a recovering, still-low base. The +30% QoQ revenue is the stronger signal.
Margins (Chart 3)
EBITDA margin over five quarters: 18.0% → 19.1% → 20.9% → 19.3% → 18.7% [1][5]. The margin has slipped two quarters in a row despite revenue up 62% since Q4 FY26.
Management blamed solvent shortages (prices up 60–100%) and freight (+100% on some US/Europe routes). It expects both to normalise within Q3 [4].
Segment mix
SDA (zeolite structure-directing agents) is 45% of revenue vs 41% in FY26. PTC is 21% (from 23%), PASC 30% (from 32%) and electrolytes 3% [4]. Euro 7 emission norms are cited as a driver of SDA sales [4].
Guidance: what changed
The Q2 earnings call scheduled for 19 Oct was cancelled, citing "unforeseen circumstances"; only a presentation was filed [3]. Compared with May 2026 (Q4 FY26) guidance [6]:
- Revenue: FY27 growth guided at 25%. H1 is +60% [2], well ahead.
- EBITDA margin: Guided at 20–22% for FY27. H1 is ~19% [2], below the range.
- Pharma: ₹70–75 cr expected in FY27 [6]; one product has started contributing [4].
- Batteries: Hybrid-battery business to start in Q3 FY27 [6]; "progress toward commercialisation" in Q2 [4].
- Capex: A ₹200 cr Dahej-III greenfield plant (344 KL) was approved in July, ~21 months to complete [7]. The borrowing limit is being raised to ₹1,000 cr from ₹300 cr [7]. May coverage referred to a "Jolva" project with production in early 2028 [6]; I couldn't confirm whether it is the same project.
Positives
- Revenue +76% YoY, +30% QoQ [1]
- SDA growing as a share of revenue [4]
- Low dependence on other income [1]
Concerns
- Margin below the 20–22% guidance [2][6]
- Working capital build-up [4]
- Rising leverage: D/E 0.21x vs 0.15x [4], with a higher borrowing limit [7]
Things to track in Q3 FY27
- EBITDA margin as solvent and freight costs ease
- Start of hybrid-battery revenue
- Receivables and inventory days
- Any rescheduled call and updated FY27 guidance
Not a buy/sell recommendation. Facts are sourced; opinions are labelled.
Sources [1] Equitybulls – Q2 FY27 results · [2] Angel One, 21 Oct · [3] ScanX – call cancelled; standalone figures · [4] Multibagg – Q2 FY27 presentation summary · [5] Screener.in – consolidated · [6] Whalesbook – FY27 outlook, May 2026 · [7] DSIJ – Dahej-III approval, Jul 2026 · [8] HDFC Sky – market holidays
Charts:
(1) last 5 quarters revenue & PAT [1][5];
(2) FY24–FY26 revenue & PAT [5];
(3) EBITDA and PAT margin (own calc. from [1][2][5]).