Just Dial (JUSTDIAL): Q2 FY27 results analysis (quarter ended 30 Sep 2026)
Figures in ₹ crore unless stated. Results released after market hours on 19 Oct 2026 [1]. EBITDA is the company's "operating EBITDA" (ex-other income). YoY/QoQ %, margins and ratios are my calculations.
| Metric | Q2 FY27 | YoY | QoQ |
| Revenue from ops | 342.8 | +13.1% | +4.7% |
| Operating EBITDA | 90.7 | +4.1% | +3.7% |
| EBITDA margin | 26.4% | 28.7% | 26.7% |
| PBT | 134.6 | −8.5% | −34.9% |
| PAT | 107.8 | −9.7% | −35.1% |
| PAT margin | 31.4% | 39.4% | 50.8% |
| Other income / PBT | 40.5% | 49.9% | 63.6% |
Sources: [1][2][4]
Quality of earnings
Just Dial is really two income streams: the listings business and a large treasury book. Other income (₹54.6 cr) is still ~40% of PBT [1].
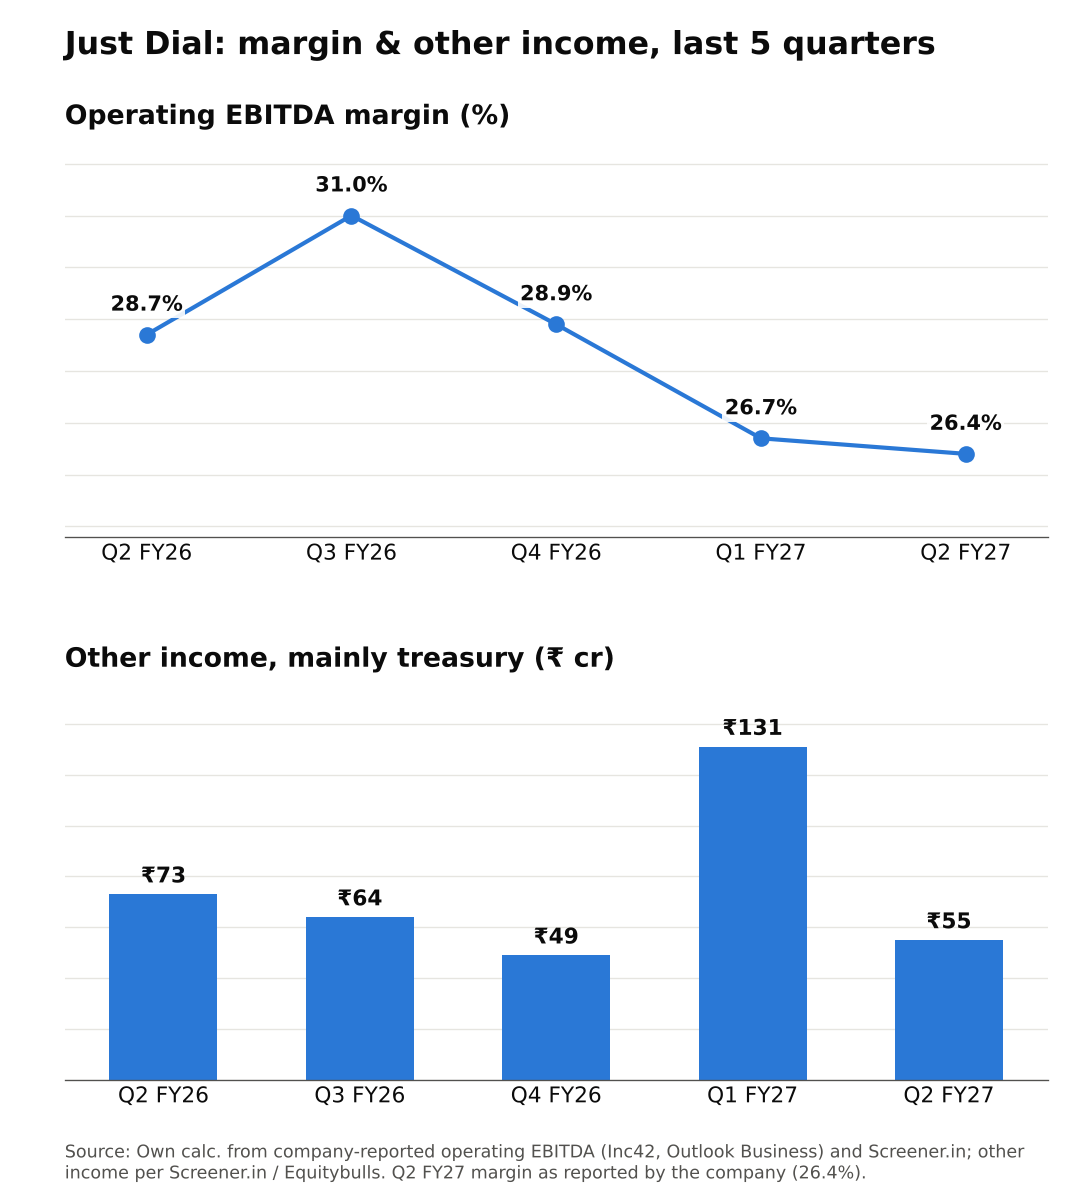
Other income fell 58% QoQ and 26% YoY [1][4]. The company attributed this to bond yields rising ~57 bps in the quarter, vs a ~44 bps fall in Q1, when it booked mark-to-market gains [4]. So the 35% QoQ PAT drop is mostly treasury, not operations.
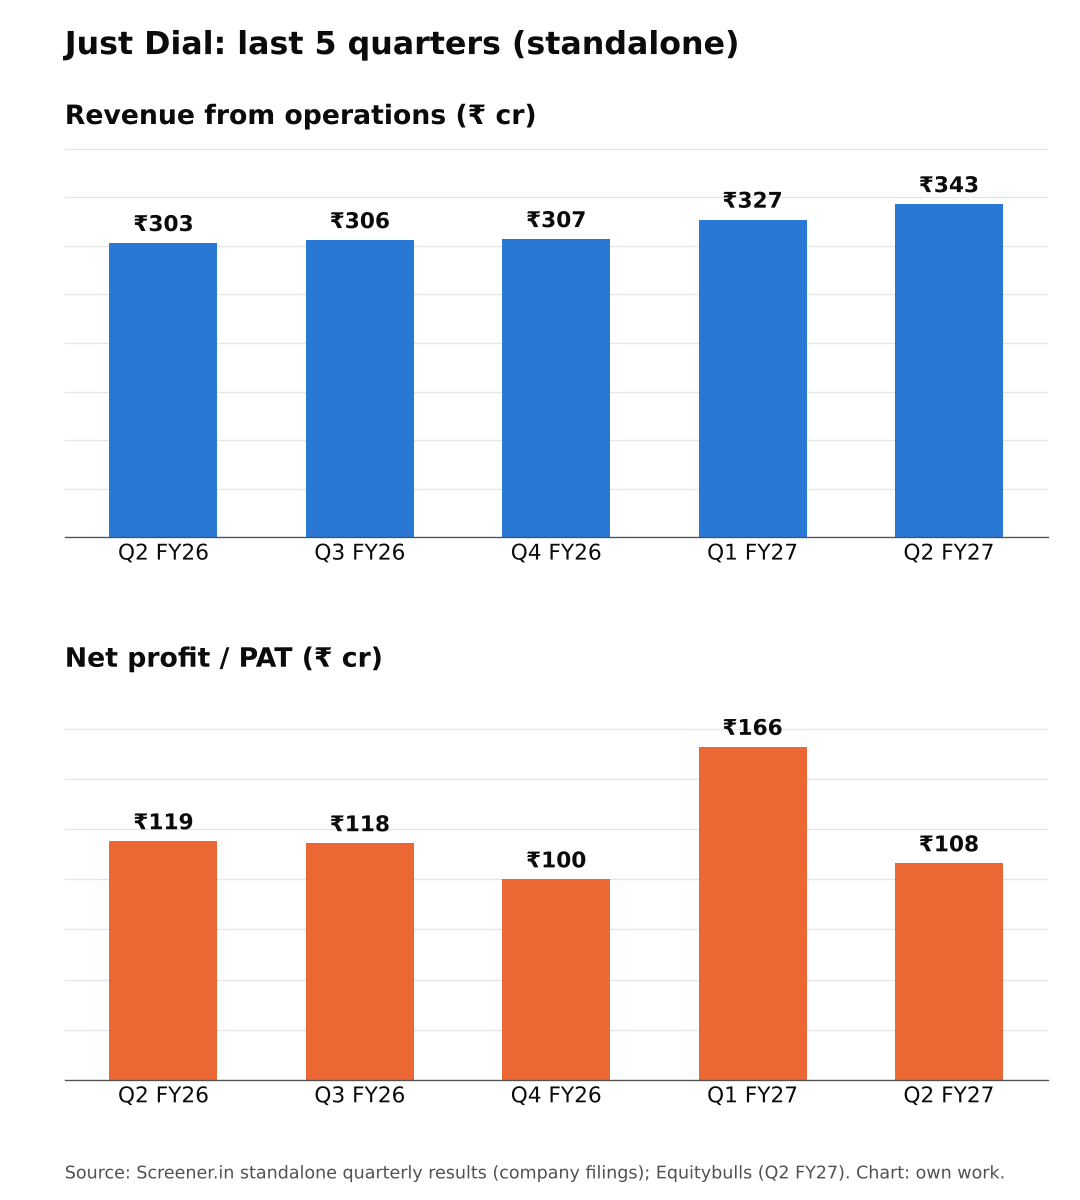
Operating revenue grew a healthy 13% YoY, faster than Q4 FY26 (+6.2%) and Q1 FY27 (~+10%) [3][6]. But expenses grew ~15% [1]. About one-third of the incremental spend went to AI, automation and B2B expansion [2][4]. So operating EBITDA grew only 4%. The tax rate is a normal ~20% [1]. No exceptional item this quarter (Q4 FY26 had a ₹21 cr labour-code charge [6]).
Base effect: Q2 FY26 PAT (₹119 cr) was itself down 22% YoY [7], so the base is not inflated. The YoY decline is real, and treasury-driven.
Margins (Chart 3)
Operating EBITDA margin over five quarters: 28.7% → 31.0% → 28.9% → 26.7% → 26.4% [3][4][6]. That is down ~460 bps from the Q3 FY26 peak. Management frames this as deliberate investment "from a position of strength" [2].
Operating metrics
- Paid campaigns: 6.57 lakh, +5.2% YoY [4]
- Traffic: 198.4 mn unique visitors, +0.4% YoY, +2.8% QoQ [2][4]
- Mobile traffic −2.1% YoY; voice −9.2% [4]
- Active listings +12.2% [2]
Revenue growth is coming from more paid campaigns and higher realisation per campaign [5], not from more users.
Management commentary
The company does not give numeric guidance. After Q4 FY26 it said agentic-AI tools would be expanded in FY27 [6]. In Q2 the CEO said H1 had given "clarity on direction" across the core business, AI, digital presence and new value-added services, possibly including a services marketplace [2][4]. So far, the spending is landing as planned. The payoff in traffic or revenue acceleration is still to show (my view).
Balance sheet: InvestyWise reports cash and investments of "₹61,139 crore", +9.8% YoY [2]. That is almost certainly ₹6,113.9 cr (₹61,139 mn). Mar 2026 was ₹5,852 cr [6].
Positives
- Operating revenue growth accelerating to 13% [1][6]
- Paid campaigns and listings growing [4]
- Large cash/treasury book; no debt-driven risk (my view)
Concerns
- Margin down ~460 bps from the Q3 FY26 peak [3]
- Traffic is flat and mobile users are declining [4]
- Earnings swing with bond yields [1][4]
- No quantified return target for the AI/B2B spend (my view)
Things to track in Q3 FY27
- Operating EBITDA margin: does it stabilise around 26%?
- Unique visitors and paid-campaign growth
- Other income vs bond-yield moves
- Any launch or monetisation of the B2B / marketplace initiatives
Not a buy/sell recommendation. Facts are sourced; opinions are labelled.
Sources [1] Equitybulls – Q2 FY27 P&L · [2] InvestyWise – BSE filing summary · [3] Screener.in – standalone · [4] Inc42, 19 Oct · [5] Whalesbook, 21 Oct · [6] Outlook Business – Q4 FY26 · [7] Business Standard – Q2 FY26 · [8] Pressbee, 21 Oct · [9] HDFC Sky – market holidays · [10] Moneycontrol via TradingView, 21 Oct
Charts:
(1) last 5 quarters revenue & PAT [1][3];
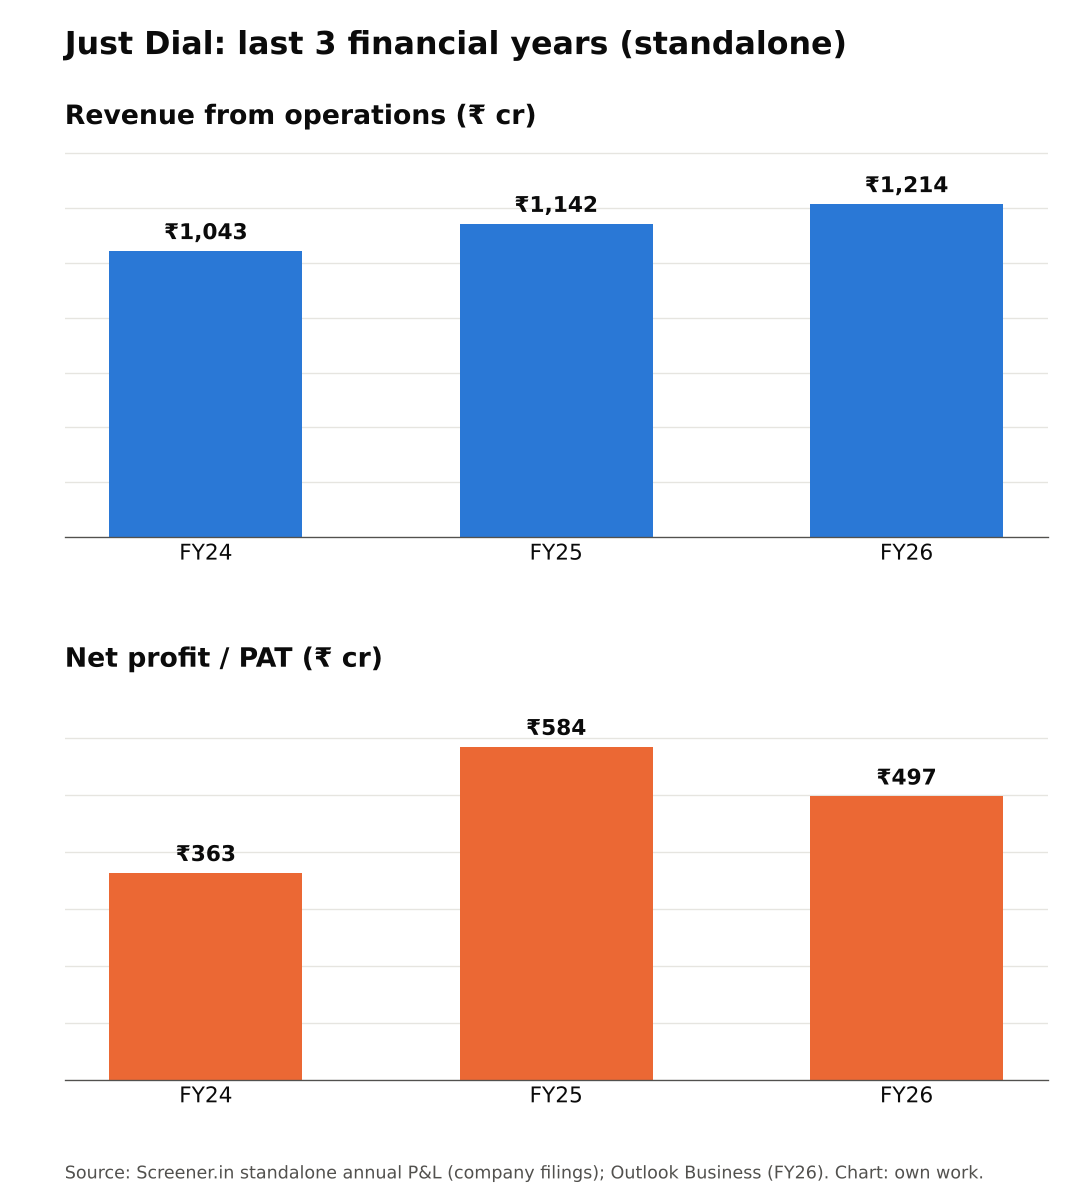
(2) FY24–FY26 revenue & PAT [3][6];
(3) operating EBITDA margin and other income [1][3][4][6] (margins own calc.).