IREDA – Q2 FY27 Results Analysis (quarter ended 30 Sep 2026)
All figures standalone, ₹ crore unless stated. The investor deck reports on this basis. Results were approved after market hours on 19 Oct 2026 [1]. YoY/QoQ % are my calculations from reported numbers.
| Metric | Q2 FY27 | YoY | QoQ |
| Loan book (gross) | 97,411 | +15.3% | +2.6% |
| Disbursements | 10,579 | +31.2% | +61% |
| Total income | 2,345 | +14.0% | +4.2% |
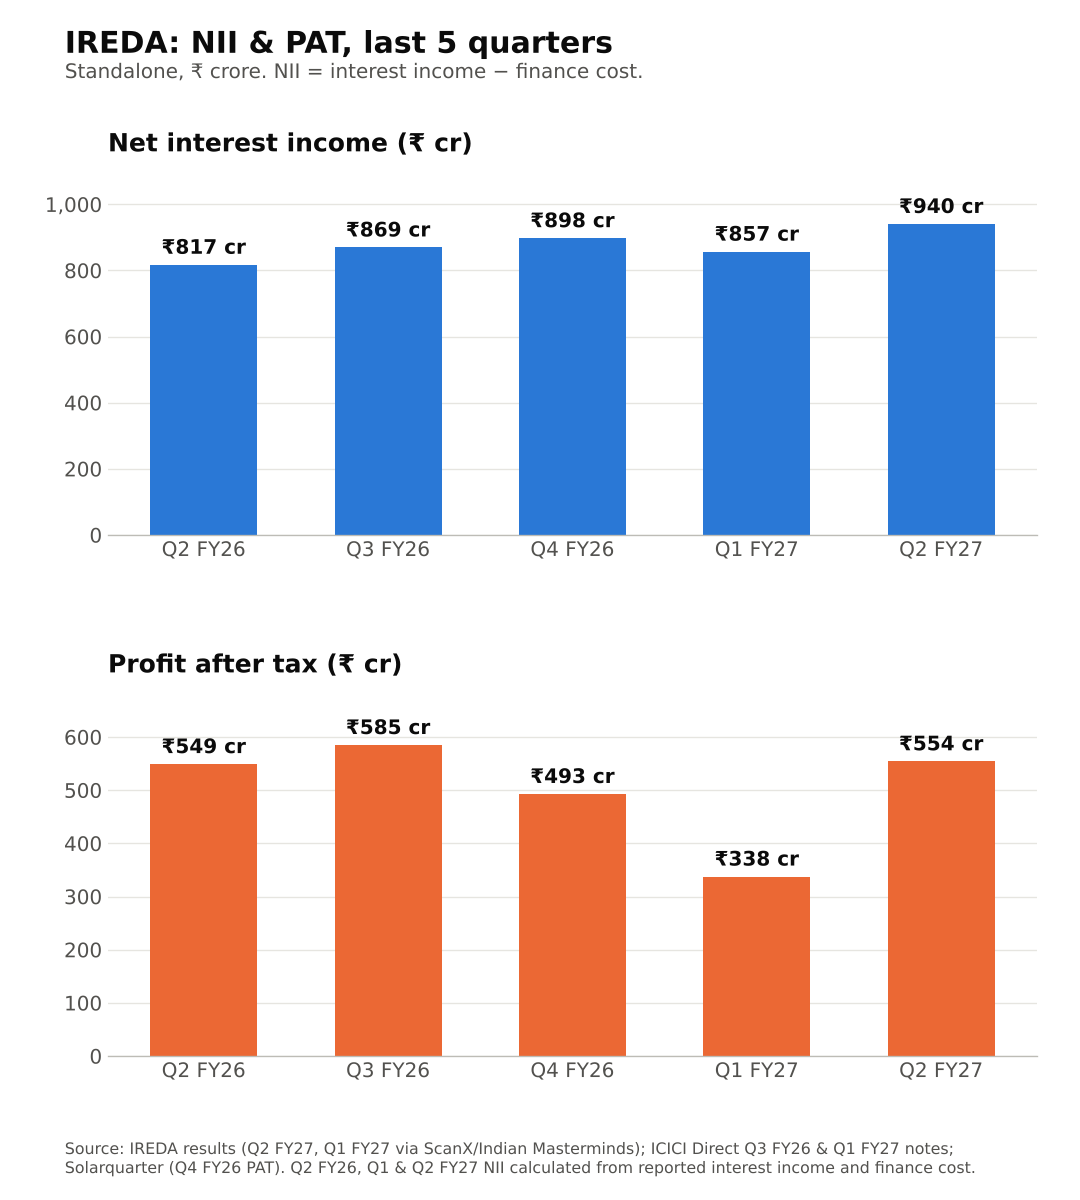
| NII (interest income − finance cost) | 940 | +15.1% | +9.8% |
| Pre-provision profit | 893 | +16.6% | +7.5% |
| Impairment (provisions) | 187 | +167% | −55% |
| PAT | 554 | +1.0% | +64% |
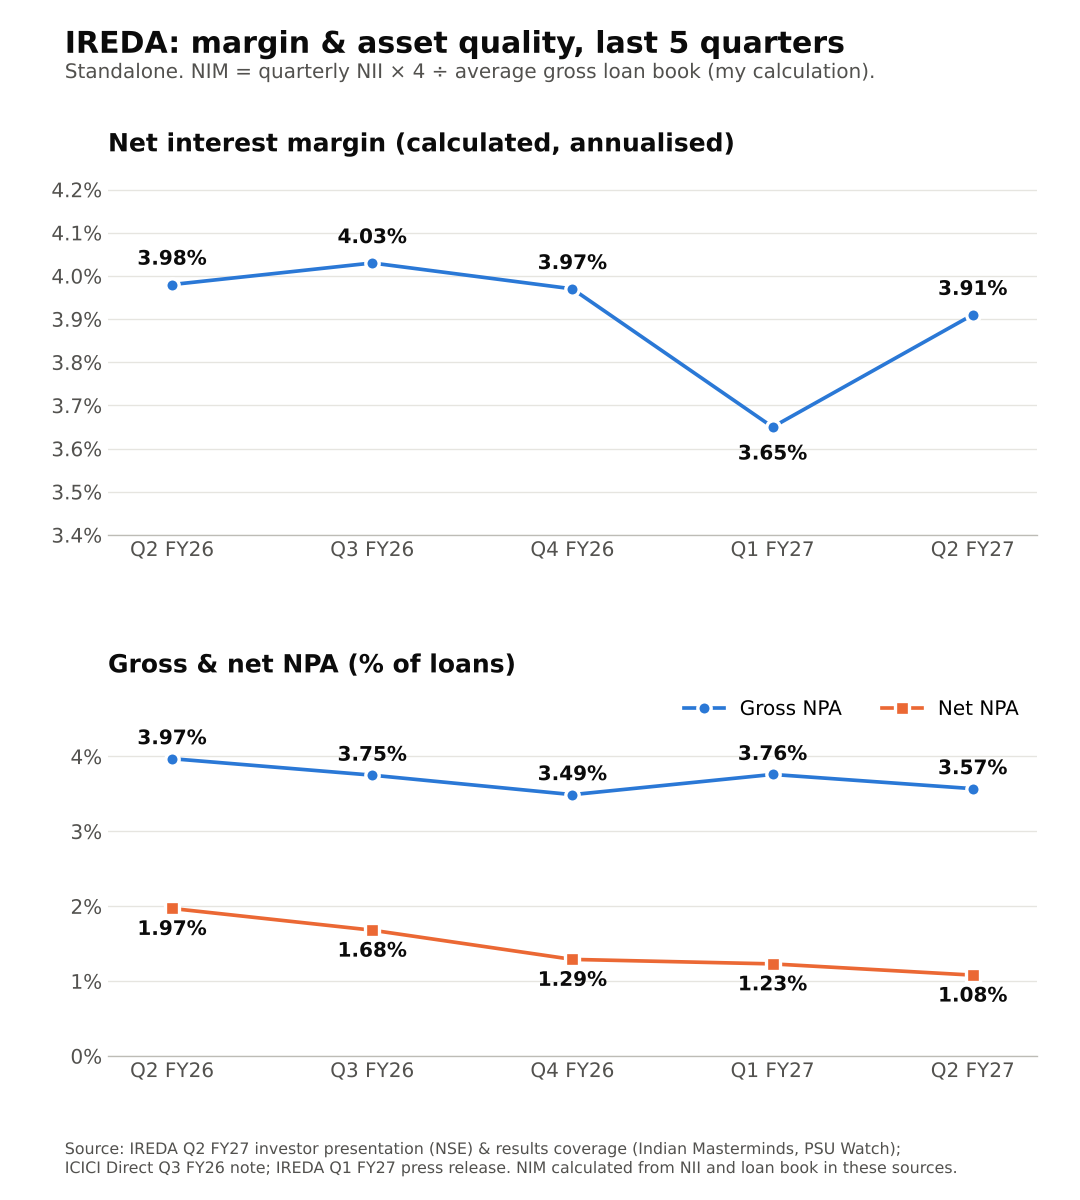
| GNPA / NNPA | 3.57% / 1.08% | 3.97% / 1.97% | 3.76% / 1.23% |
| PCR | 70.4% | 51.5% | – |
| Cost of borrowings (H1) | 7.20% | 7.24% | – |
| CRAR | 19.83% | 20.10% | – |
Sources: [1][2][3][4][5][8]. NII and PPOP are calculated from the reported line items.
Data flags
- Several headlines quote "₹891.75 cr profit, +12%". That is the H1 figure, not Q2 [1][5].
- Consolidated Q2 PAT is ₹552 cr [7]; standalone is ₹554 cr.
- The ₹93,961 cr "loan book" in some reports is the balance-sheet figure net of the ₹3,293 cr impairment allowance [1]. The deck's gross figure is ₹97,411 cr [3].
- For Q3 FY26 NII, one newsletter shows ₹898 cr [17]. I use ICICI Direct's ₹869 cr [9], because its four quarters add up to the full-year FY26 NII [10].
Quality of earnings
The core engine grew in line with the book: NII +15%, PPOP +17%. PAT stayed flat YoY because provisions jumped to ₹187 cr from ₹70 cr [1].
YoY growth here is depressed, not flattered, by the base. Q2 FY26 had unusually low provisions (annualised credit cost ~0.34%, my calculation). The +64% QoQ jump is flattered by a weak Q1 FY27, which carried ₹419 cr of provisions [2][10].
Other income is negligible: about ₹1 cr, or roughly 0.1% of PBT [11]. The tax rate was ~21.6%, against ~21.1% a year ago (calculated from [1]). I found no exceptional item in the P&L.
Two items sit outside the P&L:
- Auditors flagged ₹387 cr of loans held as Stage II (standard) under interim High Court orders, though they meet NPA criteria [2][6]. Classified as NPA, they would take GNPA to roughly 3.97% (my calculation).
- The Gensol group accounts (₹673 cr) have been declared fraud and are now 100% provided [6][18].
Margins (Chart 3)
My calculated NIM (quarterly NII annualised ÷ average gross loan book) over five quarters: 3.98% → 4.03% → 3.97% → 3.65% → 3.91%. The company reports an H1 NIM of 3.83%, against 3.72% in H1 FY26 [3].
The underlying spread is thinner. Yield on loans fell to 9.41% from 9.87%, while cost of borrowings barely moved (7.20% vs 7.24%). That took the spread down 42 bps to 2.21% [3].
NIM holding up despite this likely reflects a larger equity cushion (net worth +11% YoY [4]) and the Q1 dip reversing (interpretation). RBI's 25 bps repo hike on 9 Oct [16] could push borrowing costs up from here.
Guidance: what changed
- The press release gives no numeric guidance. As of midday 21 Oct I could not find a Q2 call transcript or call coverage.
- A FY27 performance MoU with MNRE was signed on 5 Oct, but the targets were not disclosed in coverage [14].
- At the AGM, the CMD flagged more lending to battery storage, pumped hydro, green hydrogen and smart meters, plus overseas funding via the GIFT City arm [12].
- So I cannot verify any change against earlier targets. Readers with call access, please add.
Market reaction (interpretation)
On 19 Oct the stock closed at ₹106.54 (−2.1%), before the results [7]. 20 Oct was a market holiday (Dussehra) [15]. On 21 Oct it opened at ₹107.95, then slid to ₹103.65 (−2.7%) by 10:22 AM [13]. That is below the ₹107.40 52-week low of 16 Sep [14].
Likely reasons, as I read it: flat YoY profit, H1 sanctions down 30% [5], 42 bps spread compression, and court-protected Stage II accounts. This comes on top of an already weak trend (~28% down over one year before results [19]).
Positives
- Disbursements +31% YoY; loan book +15% [4]
- NNPA down to 1.08%, PCR up to 70%, GNPA down in absolute terms QoQ (₹3,568 → ₹3,482 cr) [3]
- Core NII/PPOP growth in mid-teens; credit cost back to ~0.78% annualised after Q1's 1.78% (my calculation)
Concerns
- H1 sanctions ₹23,072 cr vs ₹33,148 cr (−30%), a weaker pipeline for H2 disbursements [5]
- Spread down 42 bps YoY; yields falling faster than borrowing costs [3]
- Provisions are lumpy: ₹70 → ₹129 → ₹215 → ₹419 → ₹187 cr across the five quarters [1][9][10]
- CRAR slipped to 19.83%, with debt-equity at 5.64x [3]
Things to track in Q3 FY27
- Sanctions trend: does the H1 decline reverse?
- Outcome of the High Court cases on the ₹387 cr Stage II accounts
- Spread and NIM after the repo hike
- Credit cost staying below ~1% annualised, and GNPA below 3.5%
Not a buy/sell recommendation. I am not a SEBI-registered analyst. Facts are sourced; opinions are labelled.
Sources [1] Indian Masterminds – Q2 FY27 results · [2] ScanX – Q2 FY27 · [3] IREDA Q2 FY27 investor presentation (NSE) · [4] Business Standard, 19 Oct 2026 · [5] Saur Energy – H1 sanctions/disbursements · [6] Whalesbook – fraud & Stage II · [7] Angel One – consolidated & price · [8] IREDA Q1 FY27 press release · [9] ICICI Direct Q3 FY26 note · [10] ICICI Direct Q1 FY27 note · [11] Screener.in · [12] Indian Masterminds – AGM · [13] Univest, 21 Oct · [14] Business Today – MoU / 52-wk low · [15] ClearTax – NSE holidays 2026 · [16] SCC Online – RBI policy · [17] ASL newsletter – Q3 FY26 · [18] Multibagg – Gensol fraud disclosure · [19] TradingView news – pre-results · [20] Solarquarter – FY26 results
Charts: (1) NII & PAT, last 5 quarters;
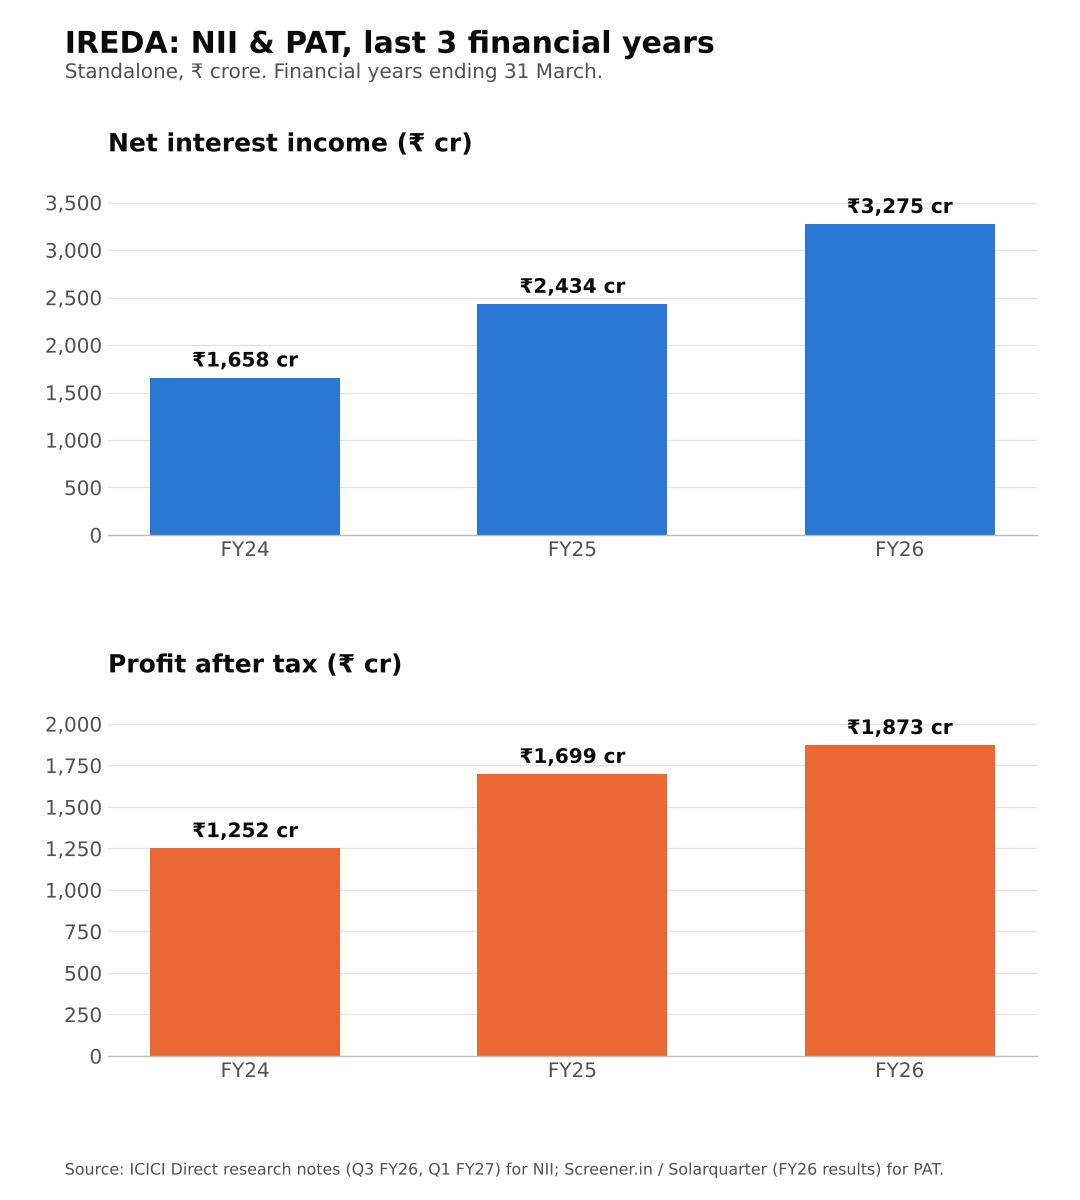
(2) NII & PAT, FY24–FY26;
(3) calculated NIM and GNPA/NNPA, last 5 quarters.