Hindustan Zinc (HINDZINC): Q2 FY27 results analysis (quarter ended 30 Sep 2026)
All figures consolidated, ₹ crore unless stated. Results filed 19 Oct 2026. YoY/QoQ %, margins and ratios are my calculations from reported numbers.
| Metric | Q2 FY27 | YoY | QoQ |
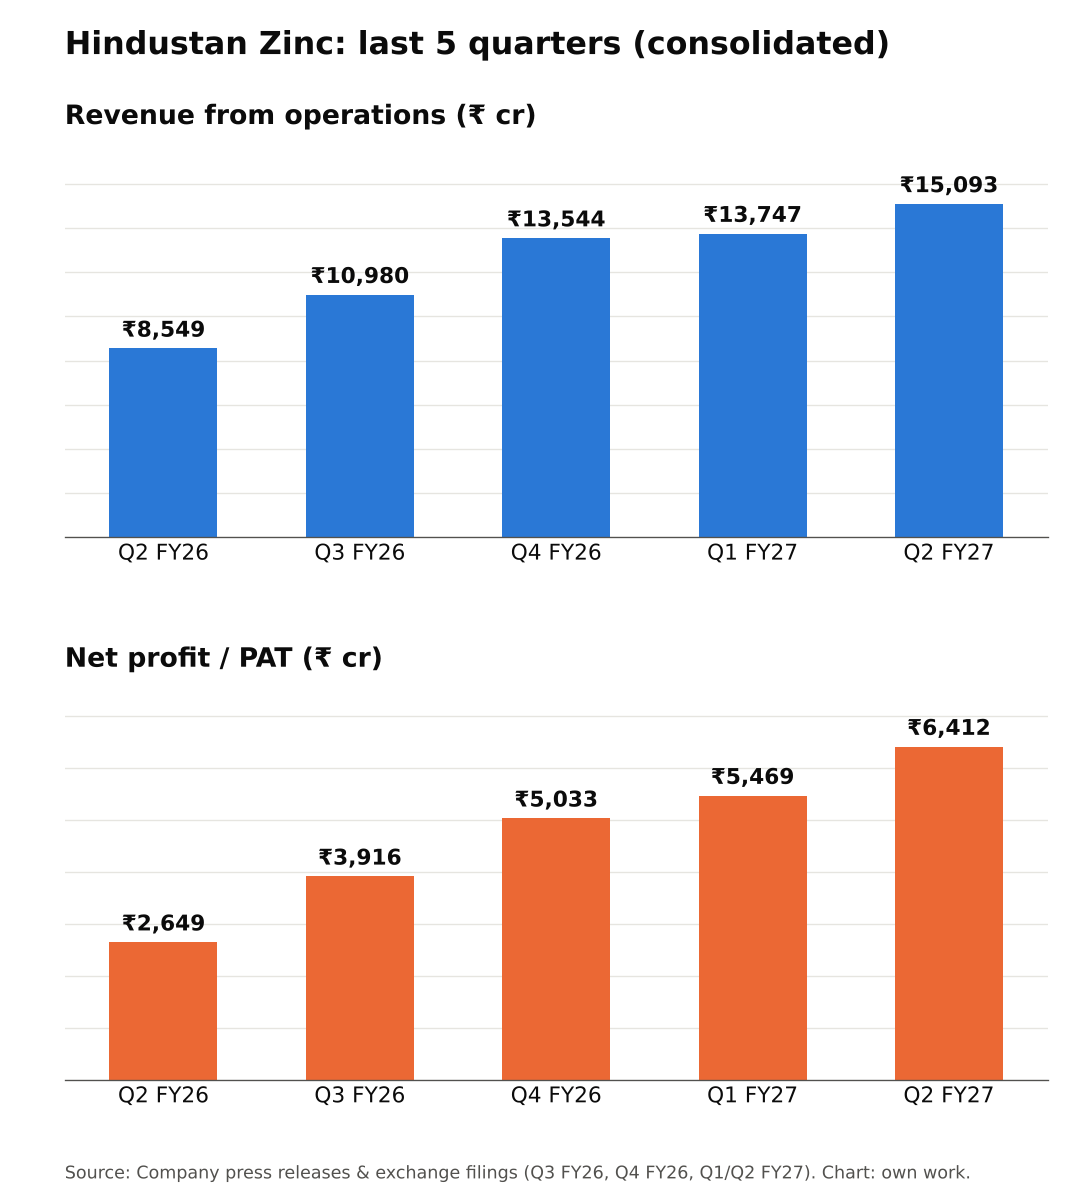
| Revenue from ops | 15,093 | +76.5% | +9.8% |
| EBITDA | 9,285 | +107.9% | +15.0% |
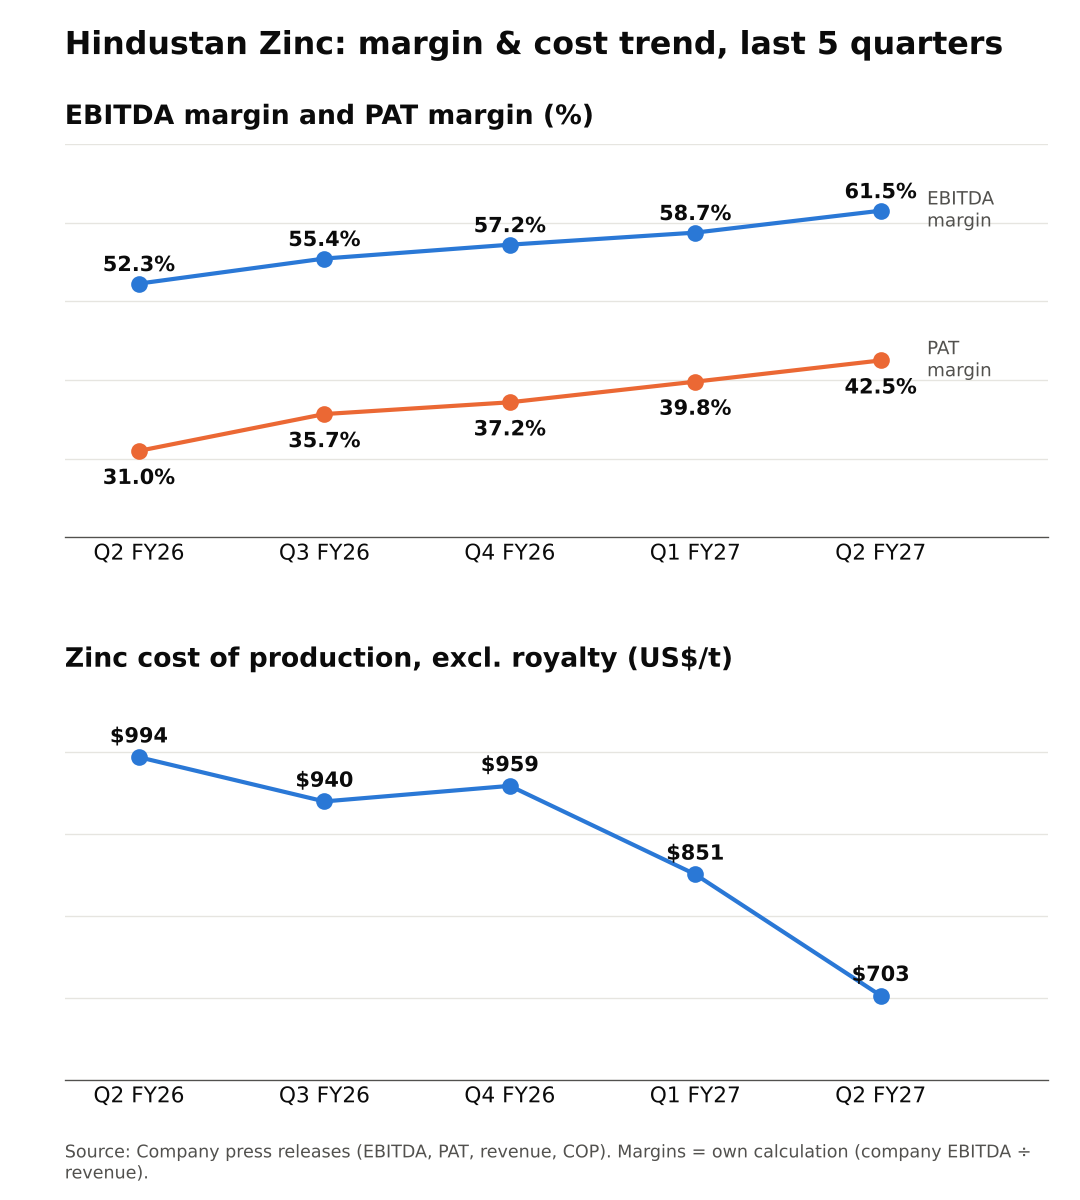
| EBITDA margin | 61.5% | 52.3% | 58.7% |
| PBT | 8,572 | +142.0% | +17.2% |
| PAT | 6,412 | +142.1% | +17.2% |
| PAT margin | 42.5% | 31.0% | 39.8% |
| Other income / PBT | 4.4% | 6.7% | 4.3% |
Sources: [1][4][5]
Source note: the company reports EBITDA of ₹9,285 cr (62% margin) [1].
Quality of earnings
This is a price-and-cost quarter. Silver revenue rose 141% YoY to ₹4,111 cr while silver output rose only 20% to 173 t, so most of the gain is price [1]. Silver is now ~27% of revenue. Zinc revenue rose 54% to ₹8,224 cr [1].
Zinc cost of production (ex-royalty) fell to $703/t from $994/t a year ago and $851/t in Q1 [1]. Management cited better grades, higher volumes and by-product credits (sulphuric acid) [2][7].
Other income is small at ₹374 cr (4.4% of PBT) [4]. Finance cost fell to ₹88 cr from ₹259 cr; D&A was ₹962 cr [5]. The tax rate held at ~25.2% [1]. No exceptional item is called out.
One minor one-off: 10 kt of lead concentrate was sold for ~₹300 cr revenue and ~₹155 cr profit; management says no further concentrate sales are planned [6].
Base effect: Q2 FY26 was not a weak base. Its 52% margin was higher than Q1 FY26's ~50% [1][5]. The +17% QoQ PAT growth is the cleaner read.
Margins (Chart 3)
EBITDA margin over five quarters: 52.3% → 55.4% → 57.2% → 58.7% → 61.5% [1][10][11]. Over the same period zinc COP fell from $994/t to $703/t. Higher silver and zinc prices plus lower unit costs drove the expansion (interpretation).
Guidance: what changed
- COP: FY27 guidance cut to $825–850/t from $975–1,000/t given in April [6][10]. Q3 is expected "broadly" similar [7].
- Volumes: Refined metal ~1,100 kt and silver ~680 t reiterated [7][8]. FY28 silver "could reach 730–750 t", subject to project progress [6][7].
- Capex: ~₹5,000 cr for FY27, unchanged, back-ended to H2 [6].
- Hedges: 76 kt of zinc for H2 at $3,476–3,698/t; 8 t of silver for Q3 at $68/oz [6].
- Timelines: The 250 ktpa expansion remains due 2QFY29 [10][11]; engineering and procurement are "almost complete" [6]. The 510 ktpa fertiliser plant was guided for 1QFY27 [11], then 2QFY27 [10], then "Q1 of next year" [12]. I couldn't find a Q2 update on it.
Balance sheet: Cash and investments ₹17,439 cr vs borrowings ₹6,171 cr, so net cash ~₹11,268 cr [1].
Positives
- Record EBITDA and PAT; PAT ~15% above consensus [1][15]
- COP down 29% YoY and full-year guidance cut sharply [1][6]
- Net cash ~₹11,268 cr; finance cost down 66% YoY [1][5]
Concerns
- Earnings now lean heavily on silver prices (my view)
- Fertiliser plant timeline has slipped twice [10][11][12]
- Management flags ~$50/t cost pressure from geopolitics/trade issues [6]
- By-product (acid) credits aren't guided and can reverse [6]
Things to track in Q3 FY27
- COP vs the new $825–850/t guidance
- Silver volumes toward 680 t (H1: 321 t) [1]
- H2 capex pace and any board approval for the new smelter
- LME zinc and silver price moves vs the hedge levels
Not a buy/sell recommendation. Facts are sourced; opinions are labelled.
Sources [1] NSE – HZL Q2 FY27 press release, 19 Oct 2026 · [2] Business Standard, 19 Oct · [3] Angel One, 20 Oct · [4] InvestyWise – results filing (total income, PBT) · [5] Screener.in – consolidated · [6] GuruFocus – Q2 call highlights · [7] DSIJ – MOFSL note summary · [8] Business Today, 21 Oct · [9] Kotak Neo, 21 Oct · [10] NSE – Q4 FY26 press release · [11] HZL – Q3 FY26 press release · [12] Q1 FY27 broker note (BS) · [13] Business Today, 19 Oct · [14] HDFC Sky – market holidays · [15] SMM – estimates vs actual
Charts: (1) last 5 quarters revenue & PAT [1][10][11];
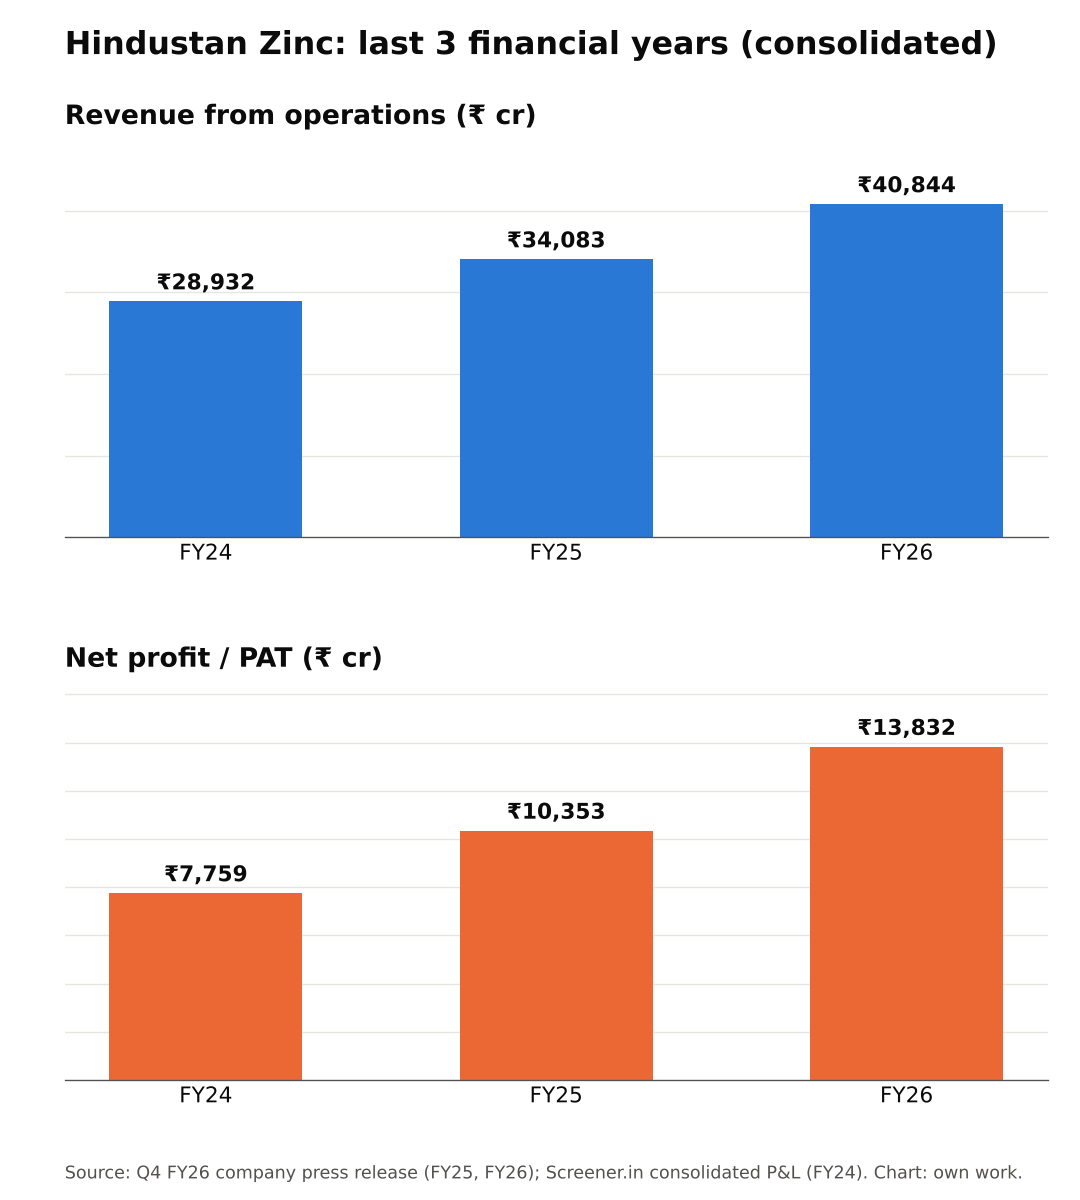
(2) FY24–FY26 revenue & PAT [5][10];
(3) EBITDA/PAT margin and zinc COP trend [1][10][11] (margins own calculation).