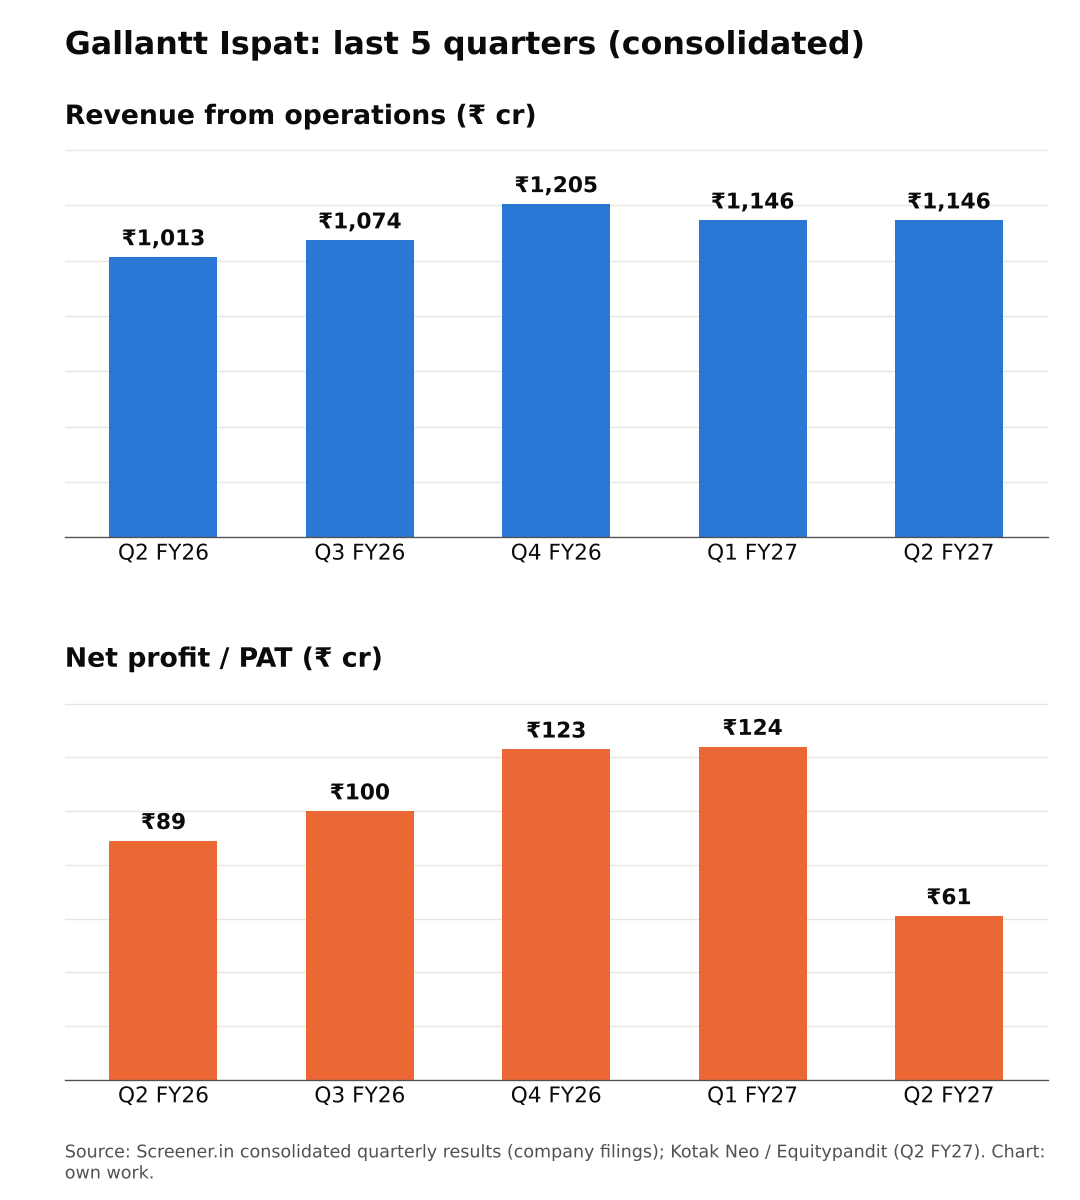
Gallantt Ispat (GALLANTT): Q2 FY27 results analysis (quarter ended 30 Sep 2026)
All figures consolidated, ₹ crore unless stated. Results approved and released after market hours on 19 Oct 2026 [1][2]. EBITDA excludes other income. YoY/QoQ %, margins and ratios are my calculations from reported numbers.
| Metric | Q2 FY27 | YoY | QoQ |
| Revenue from ops | 1,145.9 | +13.1% | flat |
| EBITDA | 109.6 | −16.7% | −40.8% |
| EBITDA margin | 9.6% | 13.0% | 16.1% |
| PBT | 83.2 | −19.3% | −49.6% |
| PAT | 60.5 | −32.0% | −51.1% |
| PAT margin | 5.3% | 8.8% | 10.8% |
| Other income / PBT | 21.8% | 12.8% | 10.9% |
Sources: [1][3][4]
Quality of earnings
This is a weak quarter at every level.
- Revenue mix: Revenue rose 13% YoY. But purchases of traded goods jumped to ₹98.9 cr from ₹5.1 cr [1][3]. About 9% of revenue may be low-margin trading rather than own manufacturing (my reading). The filing data I saw doesn't break this out.
- Other income: Rose to ₹18.2 cr, now ~22% of PBT vs ~13% a year ago [1]. Core profit fell more than the PBT line shows.
- Tax: The effective rate jumped to ~27% from ~14% [1][3]. That is why PAT fell 32% while PBT fell 19%. The Q2 FY26 base had an unusually low tax rate, which flatters the base (my calculation).
- D&A plus finance cost: ~₹44.6 cr, vs ~₹41.7 cr [3]. Not a major driver.
Base effect: Q2 FY26 was itself the weakest quarter of FY26 (13.0% margin) [4]. So the YoY decline is not because of a high base. QoQ, PAT halved on flat revenue.
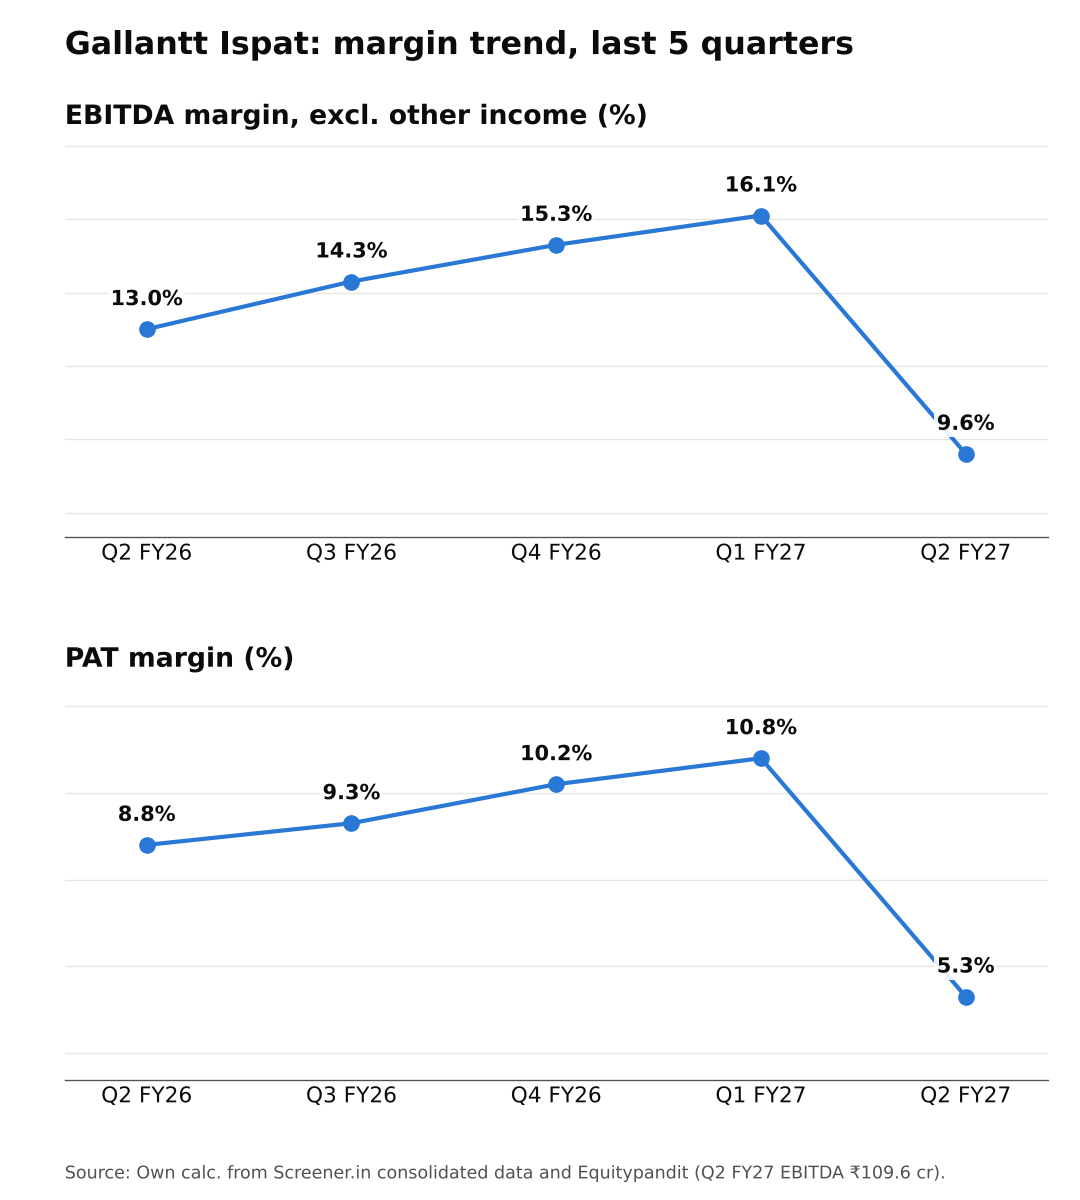
Margins (Chart 3)
EBITDA margin over five quarters: 13.0% → 14.3% → 15.3% → 16.1% → 9.6% [3][4]. Q2 broke a four-quarter improving trend.
In Q1, management blamed seasonal softness, lower TMT/rebar prices, high coal and iron ore costs, and a pellet-plant shutdown [5]. Q2 is monsoon-affected for construction steel.
Management guidance: what we know
The Q2 presentation and call were not available at the time of writing. From Q1 (July 2026):
- Capacity: Expansion from 1.0 to 1.23 MTPA under a ~₹3,000 cr capex plan, "on track" for H2 FY27 [5]. Equitypandit cites 1.29 MTPA [3]; I couldn't reconcile the two.
- Funding: Capex funded from internal accruals; no term loans; net cash surplus [5].
- Renewables: ~85 MW across Gujarat and Gorakhpur, being commissioned in stages within FY27 [5].
- Gujarat rolling mill: Utilisation was 66% in Q1, flagged as a Q2 focus area [5]. Worth checking in the Q2 presentation.
- Mines: Own iron ore mines under development [3].
Positives
- Revenue growth of 13% YoY [1]
- Capacity expansion on schedule as of Q1, funded internally [5]
- Raw material cost as % of revenue fell to ~69% from ~72% [3]
Concerns
- EBITDA margin at a five-quarter low [3][4]
- Rise in traded-goods purchases (possibly lower-quality revenue) [1]
- Tax normalisation is hurting PAT [1]
- No Q2 management commentary yet (my view)
Things to track in Q3 FY27
- Commissioning of the expanded capacity in H2 FY27
- EBITDA per tonne vs ₹8,787 in Q1 [5]
- Traded vs manufactured revenue mix
- Gujarat rolling-mill utilisation
Not a buy/sell recommendation. Facts are sourced; opinions are labelled.
Sources [1] Kotak Neo – Q2 FY27 results · [2] Whalesbook · [3] Equitypandit · [4] Screener.in – consolidated · [5] Kalkine – Q1 FY27 call · [6] MarketsMojo, 21 Oct · [7] Moneycontrol via TradingView, 21 Oct · [8] HDFC Sky – market holidays
Charts:
(1) last 5 quarters revenue & PAT [1][4];
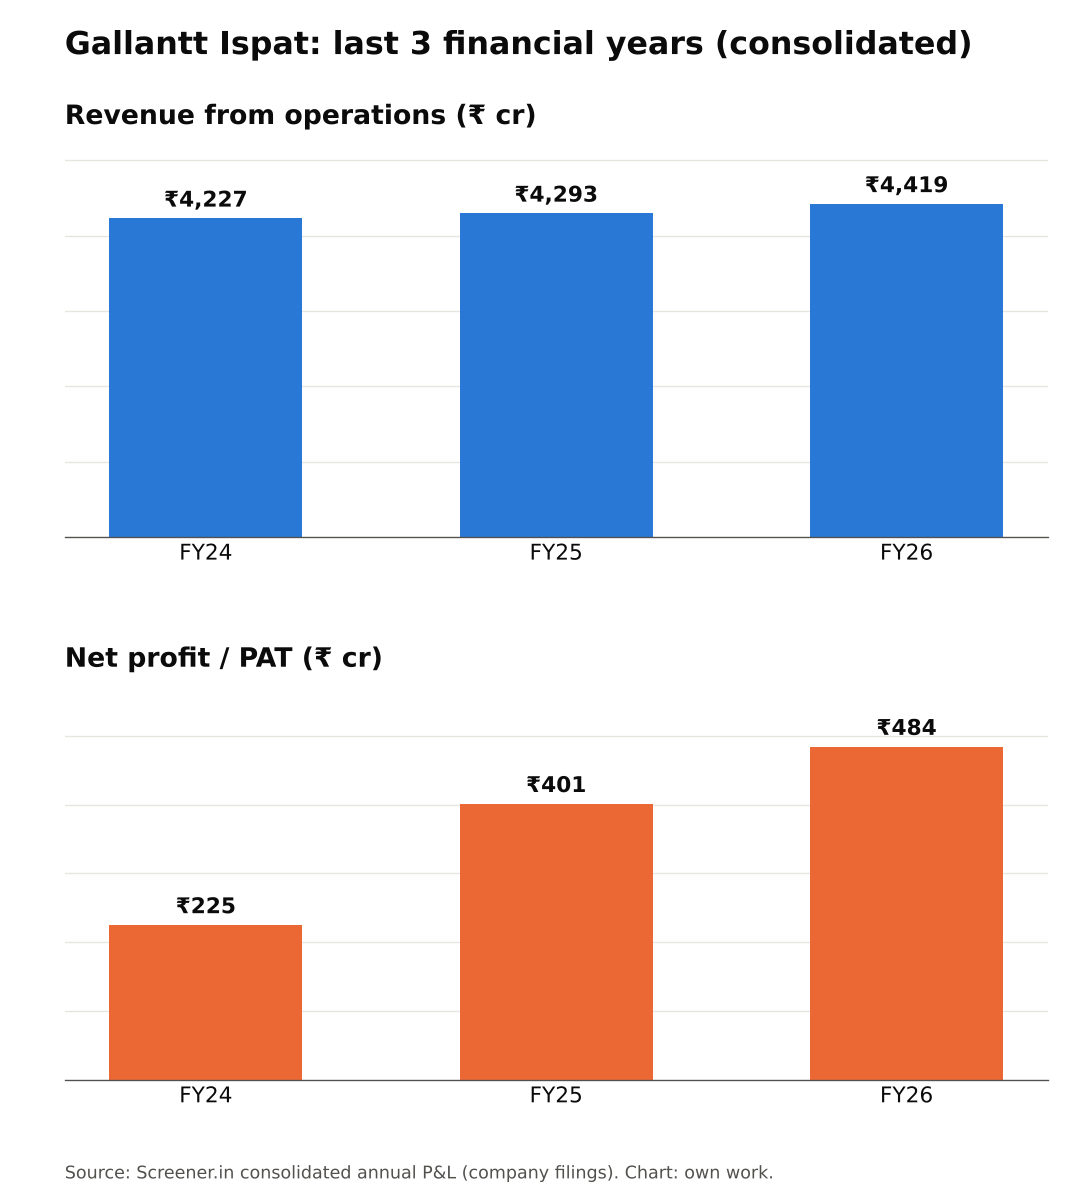
(2) FY24–FY26 revenue & PAT [4];
(3) EBITDA and PAT margin (own calc. from [3][4]).