All figures consolidated, ₹ crore unless stated. Results declared after market hours on 19 Oct 2026. YoY/QoQ % are my calculations from reported numbers.
| Metric | Q2 FY27 | YoY | QoQ |
| AUM | 5,84,624 | +26.5% | +6.9% |
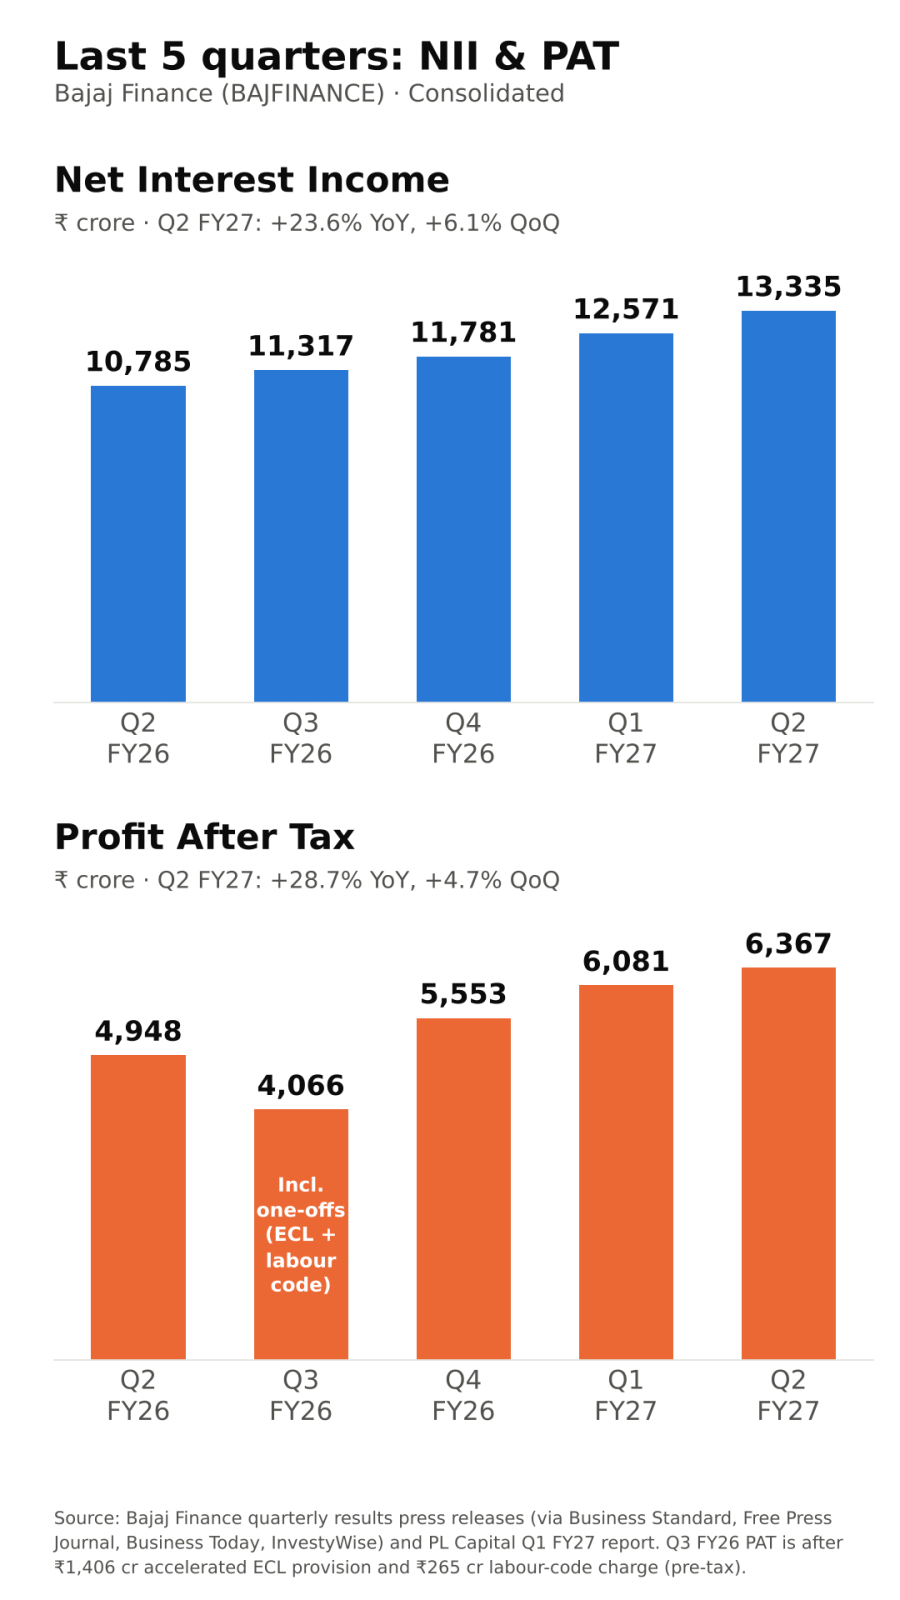
| NII | 13,335 | +23.6% | +6.1% |
| Net total income | 15,974 | +23.0% | +4.9% |
| Pre-provision op. profit | 10,699 | +23.2% | – |
| Loan losses & provisions | 2,166 | +4.1% | +8.7% |
| PAT | 6,367 | +28.7% | +4.7% |
| Credit cost (annualised) | 1.56% | 1.88% a yr ago | – |
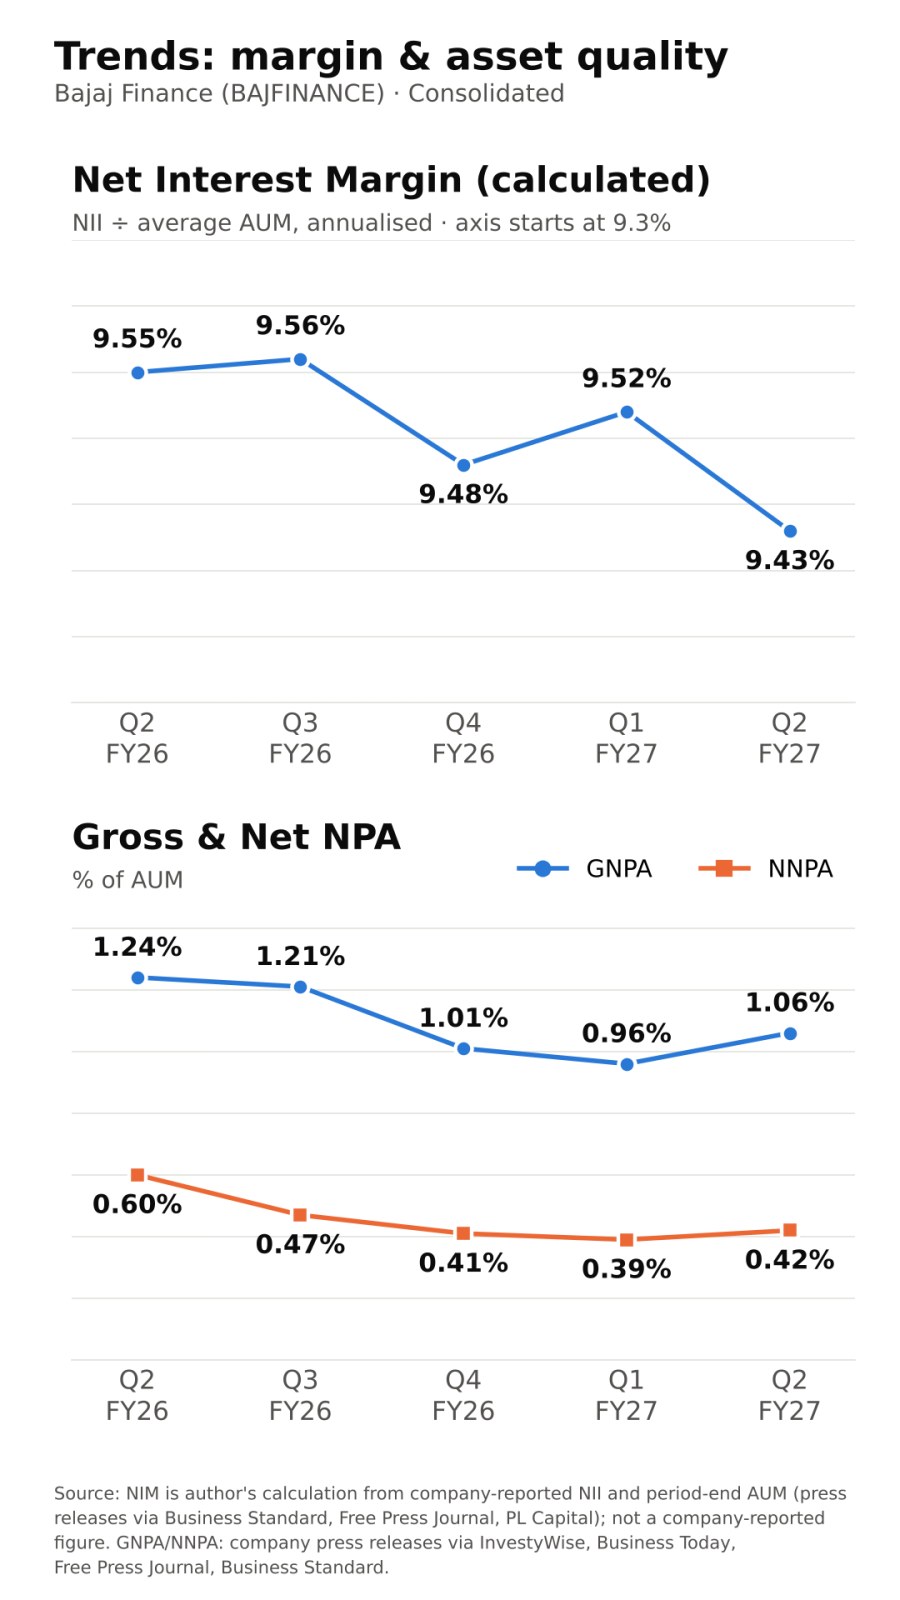
| GNPA / NNPA | 1.06% / 0.42% | 1.24% / 0.60% | 0.96% / 0.39% |
| PCR (Stage 3) | 60% | 52% | – |
| Cost of funds | 7.31% | – | −9 bps |
| RoA / RoE | 4.6% / 20.6% | 4.5% / 19.1% | – |
Quality of earnings
PAT (+29%) grew faster than NII (+24%) and PPOP (+23%). The gap comes from provisions, which rose only 4% YoY. The Q2 FY26 base carried an elevated 1.88% credit cost, so YoY profit growth is partly flattered by a high-provision base (my view).
On the other side, this quarter absorbed a ₹337 cr management/macro overlay; excluding it, provisions fell 12% YoY. Fee and other income (NTI minus NII) was about ₹2,639 cr, +20% YoY but flat QoQ (my calculation). PBT was ₹8,537 cr , implying a normal ~25% tax rate. Standalone results show no exceptional items.
Margins
The press release doesn't state NIM, so I calculate NII ÷ average AUM: 9.55% → 9.56% → 9.48% → 9.52% → 9.43% over five quarters (Chart 3). Management said Q2 NIM fell 10–12 bps QoQ [4].
Cost of funds actually fell 9 bps to 7.31% [3]. So the dip likely reflects yield/mix: faster growth in lower-yield mortgages (+30%), loans against securities (+42%) and gold loans (+105%) [3] (interpretation).
Note: one transcript summary shows cost of funds at 7.87% ; the 7.31% figure matches the investor-deck summary.
Guidance: what changed
- FY27 AUM growth guidance raised to 26–27%, from 23–25% [4][5]. (CNBC-TV18 cites the earlier range as 22–24% [7].)
- NIM: the earlier FY27 guidance was 10–15 bps compression; management now flags a "marginal headwind" beyond that, after RBI's 25 bps repo hike to 5.50% on 9 Oct.
- Credit cost: FY27 expected to be among the lowest in four years.
- Capital: ₹11,700 cr QIP plus ₹5,800 cr warrants to Bajaj Finserv (subject to approval). The leverage corridor drops to 5.0–5.5x from 5.5–6x.
Market reaction (interpretation)
The stock closed at ₹957.35 (−2.5%) on 19 Oct, before the results. After the Dussehra holiday, it traded ~2.3% lower at ₹935 on 21 Oct. Likely reasons: tighter margin guidance, GNPA up 10 bps QoQ, a Stage 2 bump in gold loans, and dilution from the capital raise outweighing the growth upgrade.
Positives
- 26.5% AUM growth with a raised full-year target
- Credit cost down 32 bps YoY despite the overlay; PCR up to 60%
- Opex/NTI at 33.0%, RoE 20.6%
Concerns
- NIM compression set to deepen in H2 as rate hikes flow through
- Stage 2+3 rose ₹1,601 cr in the quarter, ~₹1,047 cr from gold-loan schemes, now discontinued
- MSME AUM grew just 3%; management cites rural/monsoon stress
- Near-term RoE dilution from the ₹17,500 cr raise
Things to track in Q3 FY27
- Calculated NIM: does compression stay near the guided band?
- Whether the gold-loan Stage 2 assets roll back to Stage 1, as management expects
- Credit cost staying near 1.3–1.6%, plus any further overlays
- QIP pricing/timing and the new leverage corridor