Adani Energy Solutions (ADANIENSOL): Q2 FY27 Results Analysis
(Quarter ended 30 Sep 2026)
All figures consolidated, ₹ crore unless stated. Results released on 22 Oct 2026 [1]. EBITDA here excludes other income and regulatory items. PAT is the owners' share. YoY/QoQ %, margins and ratios are my calculations.
| Metric | Q2 FY27 | YoY | QoQ |
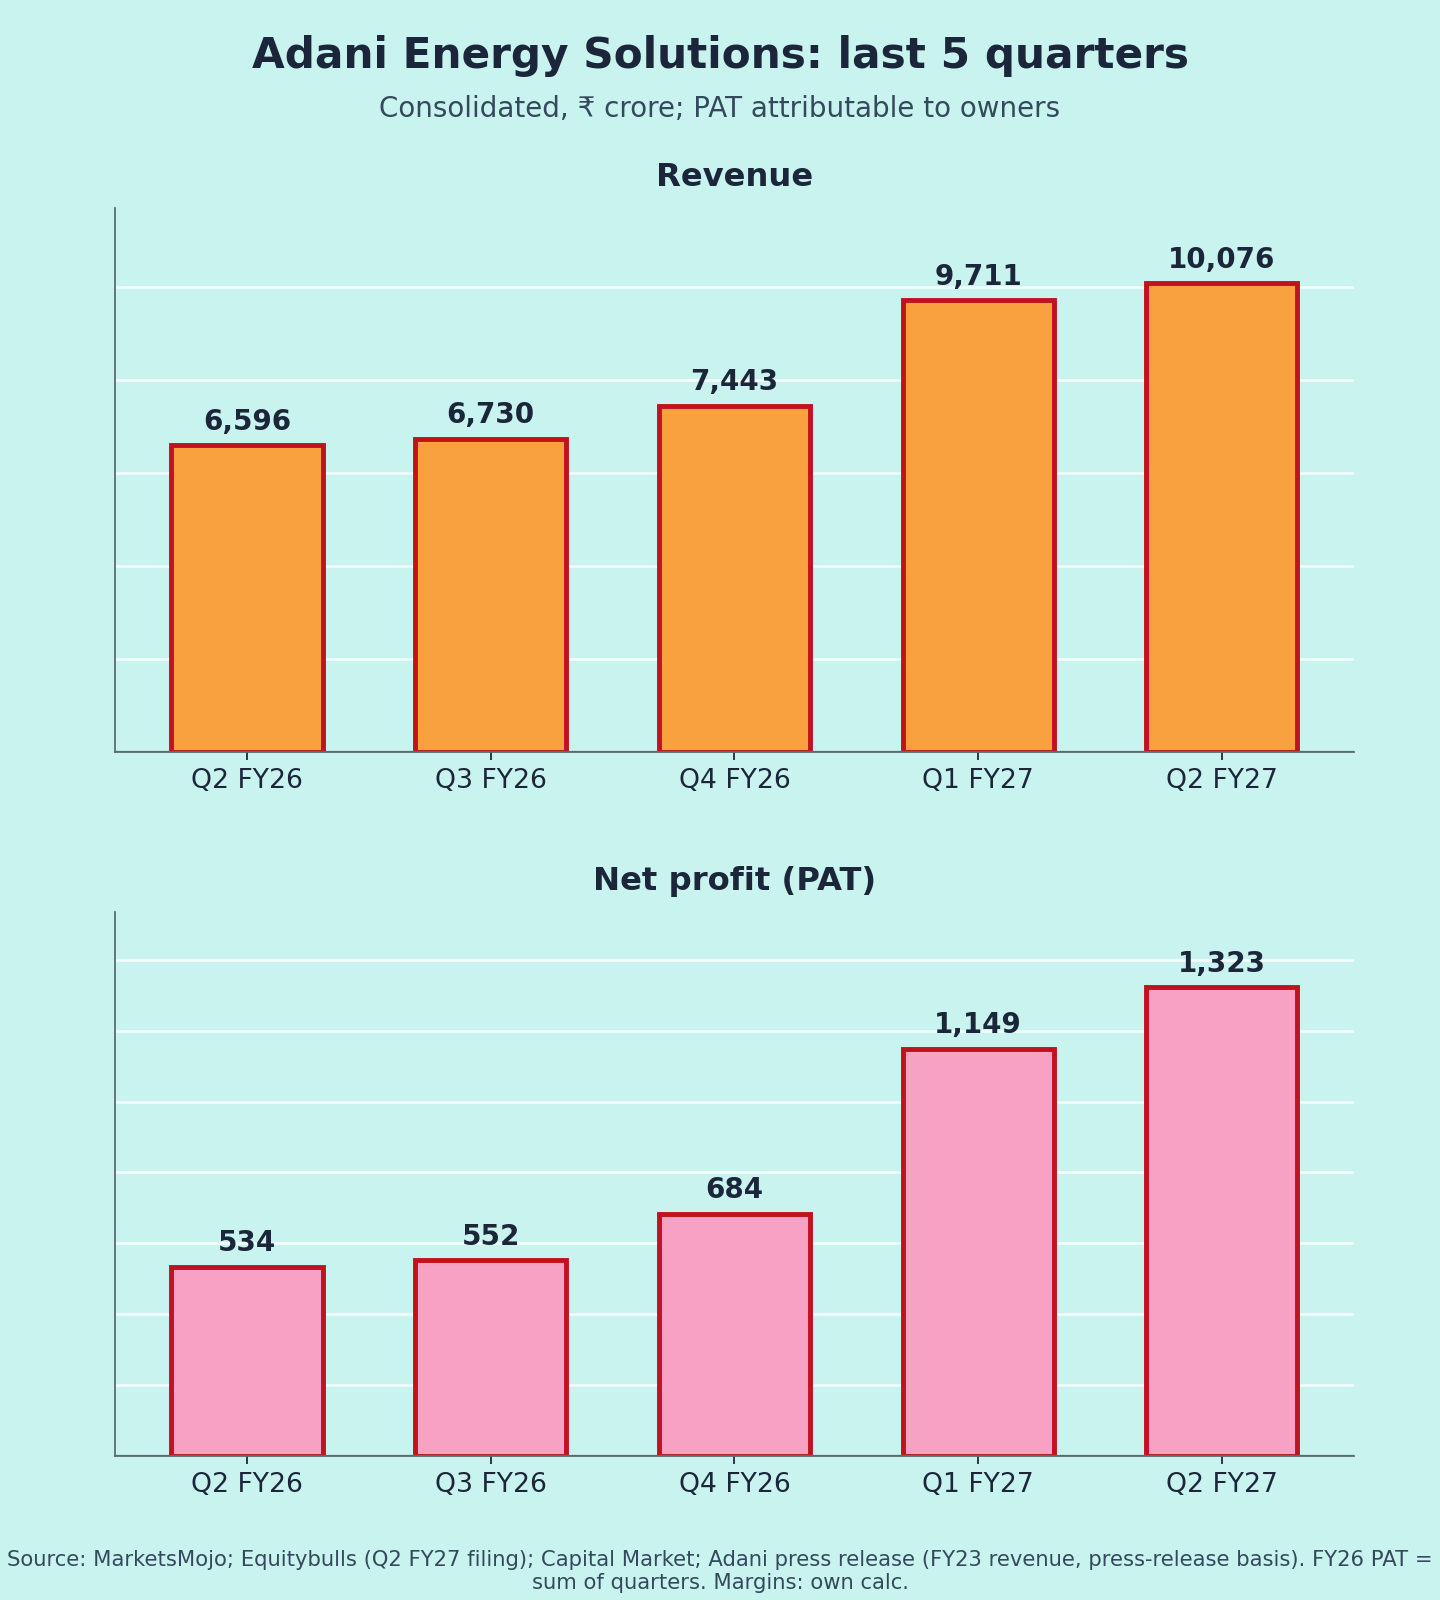
| Revenue from ops | 10,076 | +52.8% | +3.8% |
| EBITDA (ex-OI) | 3,101 | +35.5% | +3.1% |
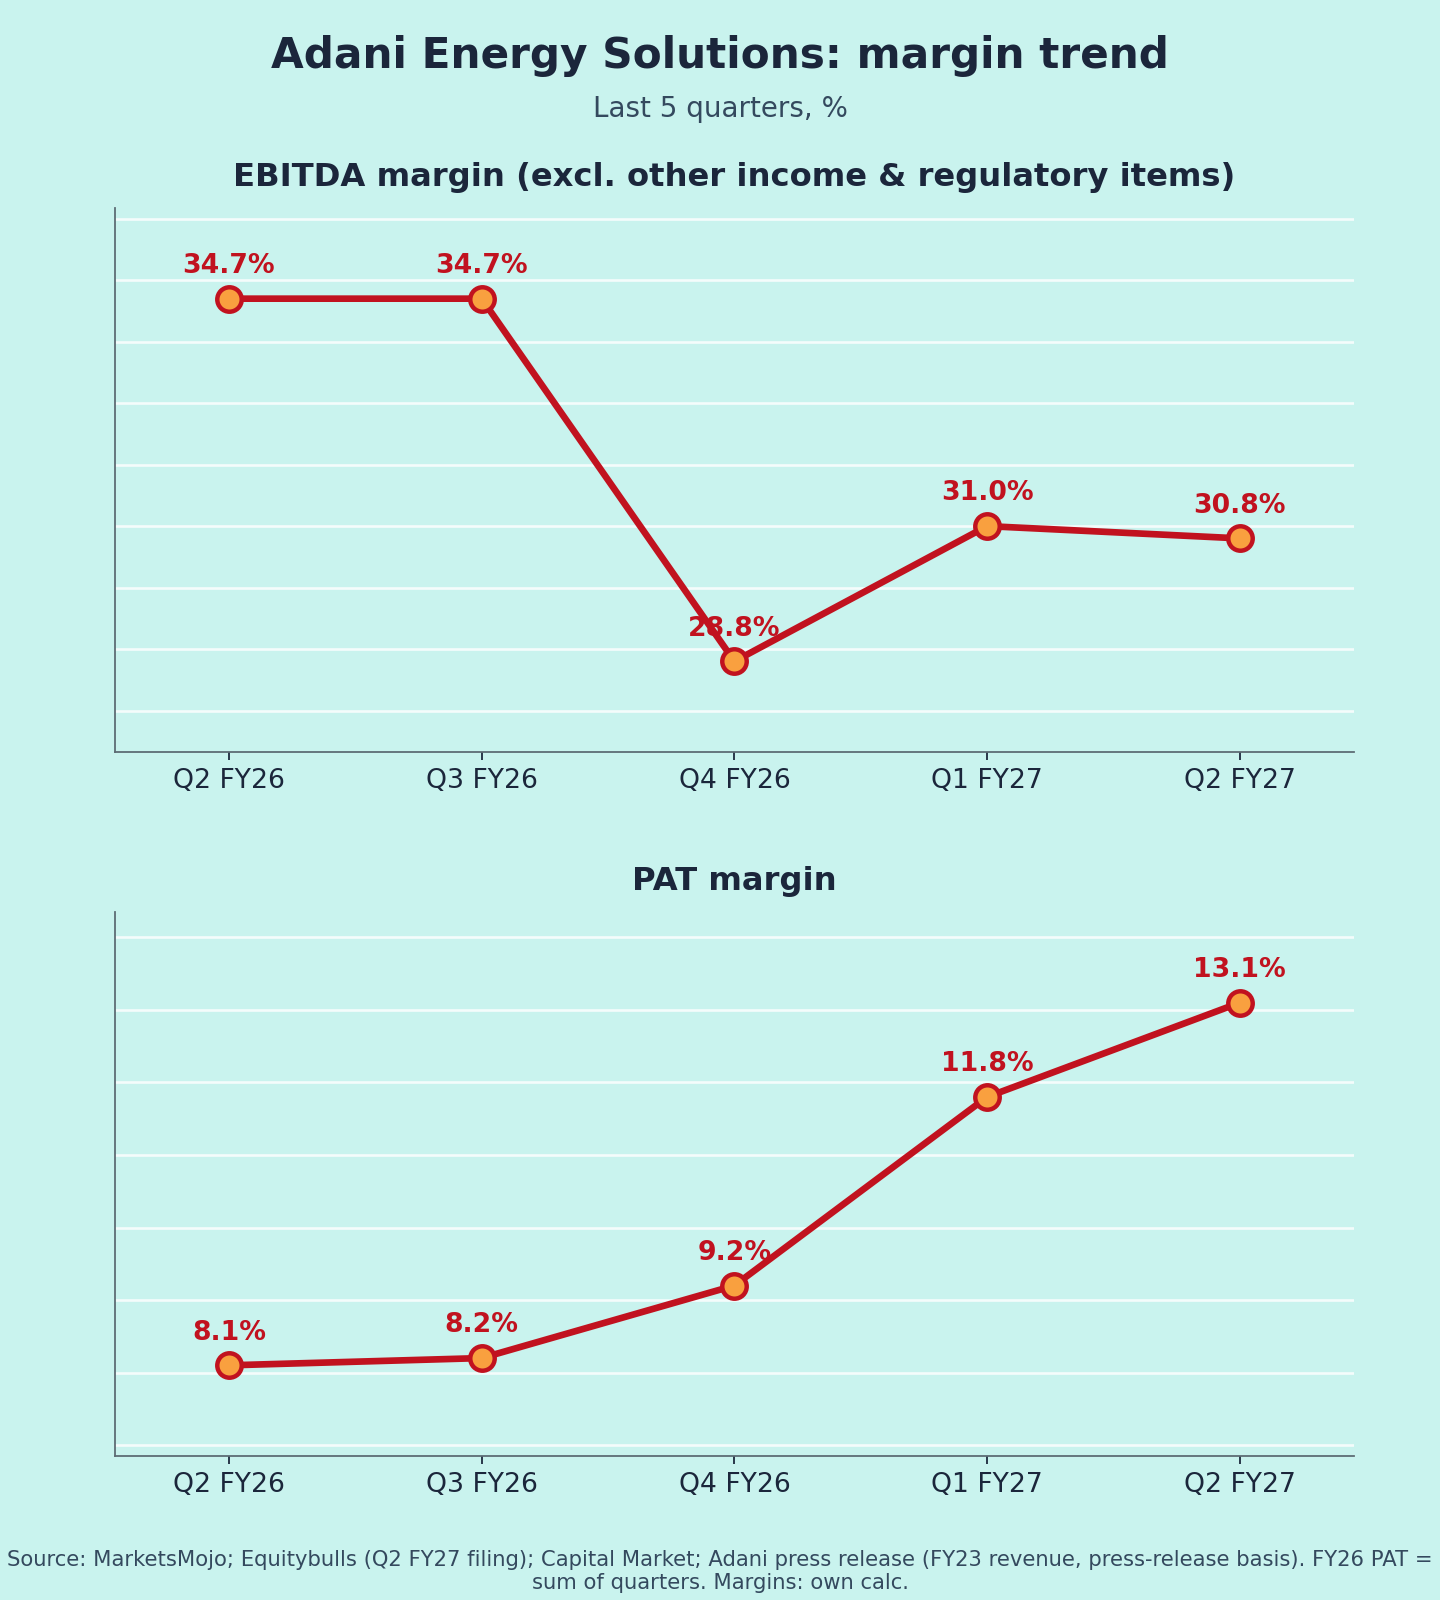
| EBITDA margin | 30.8% | 34.7% | 31.0% |
| Core PBT (before regulatory items) | 1,484 | +37.5% | +5.0% |
| PAT (owners) | 1,323 | +148% | +15.1% |
| PAT margin | 13.1% | 8.1% | 11.8% |
| Other income / core PBT | 11.0% | 15.9% | 10.0% |
Sources: [1][2][3]
Source notes:
- The company's EBITDA is ₹3,548 cr (+67%) [4]. It includes other income (₹164 cr) and regulatory deferral income (₹284 cr). Kotak Neo shows ₹3,101.5 cr and a 30.7% margin [5]. That ties to my ex-OI figure.
- Total PAT is ₹1,364 cr (+145%); the owners' share is ₹1,323 cr [1].
Quality of earnings
What did lift PAT:
- Core growth: PBT before regulatory items rose ~37.5% (my calculation).
- Regulatory accounting: a +₹284 cr regulatory deferral credit this quarter [1]. Last year this area was a net drag of roughly ₹334 cr (my estimate, PBT gap in [2] vs [6]). This swing explains much of the jump from +37% to +148%.
So underlying profit growth is closer to ~35–40% than ~150% (my view). Finance costs rose ~35% to ₹1,180 cr [1][2].
Much of the revenue jump is low-margin: construction (service concession) revenue of ₹2,256 cr and power purchase costs of ₹3,244 cr [1].
Margins (Chart 3)
EBITDA margin (ex-OI): 34.7% → 34.7% → 28.8% → 31.0% → 30.8% [2]. The dip reflects a higher share of pass-through and construction revenue, not weaker transmission economics (interpretation).
Guidance: what changed
- FY27 capex plan (April): ~₹22,000 cr, of which ₹15,500 cr is transmission [7]. H1 transmission capex: ₹5,542 cr, 1.7x last year [4]. That is ~36% of the full-year plan, so H2 is back-ended (my calculation).
- Smart meters: target of at least 1 crore installs in FY27 [7]. Cumulative installs are now 14.8 mn, up from just over 1 crore in March [7][3]. That implies roughly 4.5–5 mn in H1 (my estimate), slightly behind pace.
- Order book: transmission book ~₹87,000 cr after the Vizag and Satara wins. The smart-meter book is 24.6 mn meters (~₹29,519 cr) [3].
- Capital: ₹3,500 cr QIP closed [8].
Positives
- EBITDA +35% and core PBT +37% [1][5]
- ₹87,000 cr transmission order book [3]
- Net worth up to ₹30,212 cr after the QIP [1]
Concerns
- Borrowings ₹51,520 cr; interest +35% [1]
- Headline PAT inflated by regulatory accounting (my view)
- Capex back-ended to H2 [4][7]
Things to track in Q3 FY27
- Core PBT growth, separate from regulatory items
- Transmission capex pace vs ₹15,500 cr
- Smart-meter installs vs the 1 crore target
- Debt and interest cost after the QIP
Not a buy/sell recommendation. Facts are sourced; opinions are labelled.
Sources [1] Equitybulls – Q2 FY27 filing detail · [2] MarketsMojo – consolidated quarterly · [3] The Machine Maker – press release · [4] InvestyWise – press release · [5] Kotak Neo, 22 Oct · [6] 5paisa – quarterly · [7] Swarajya – FY27 capex · [8] Whalesbook · [9] Capital Market – FY25 · [10] pv magazine – FY23
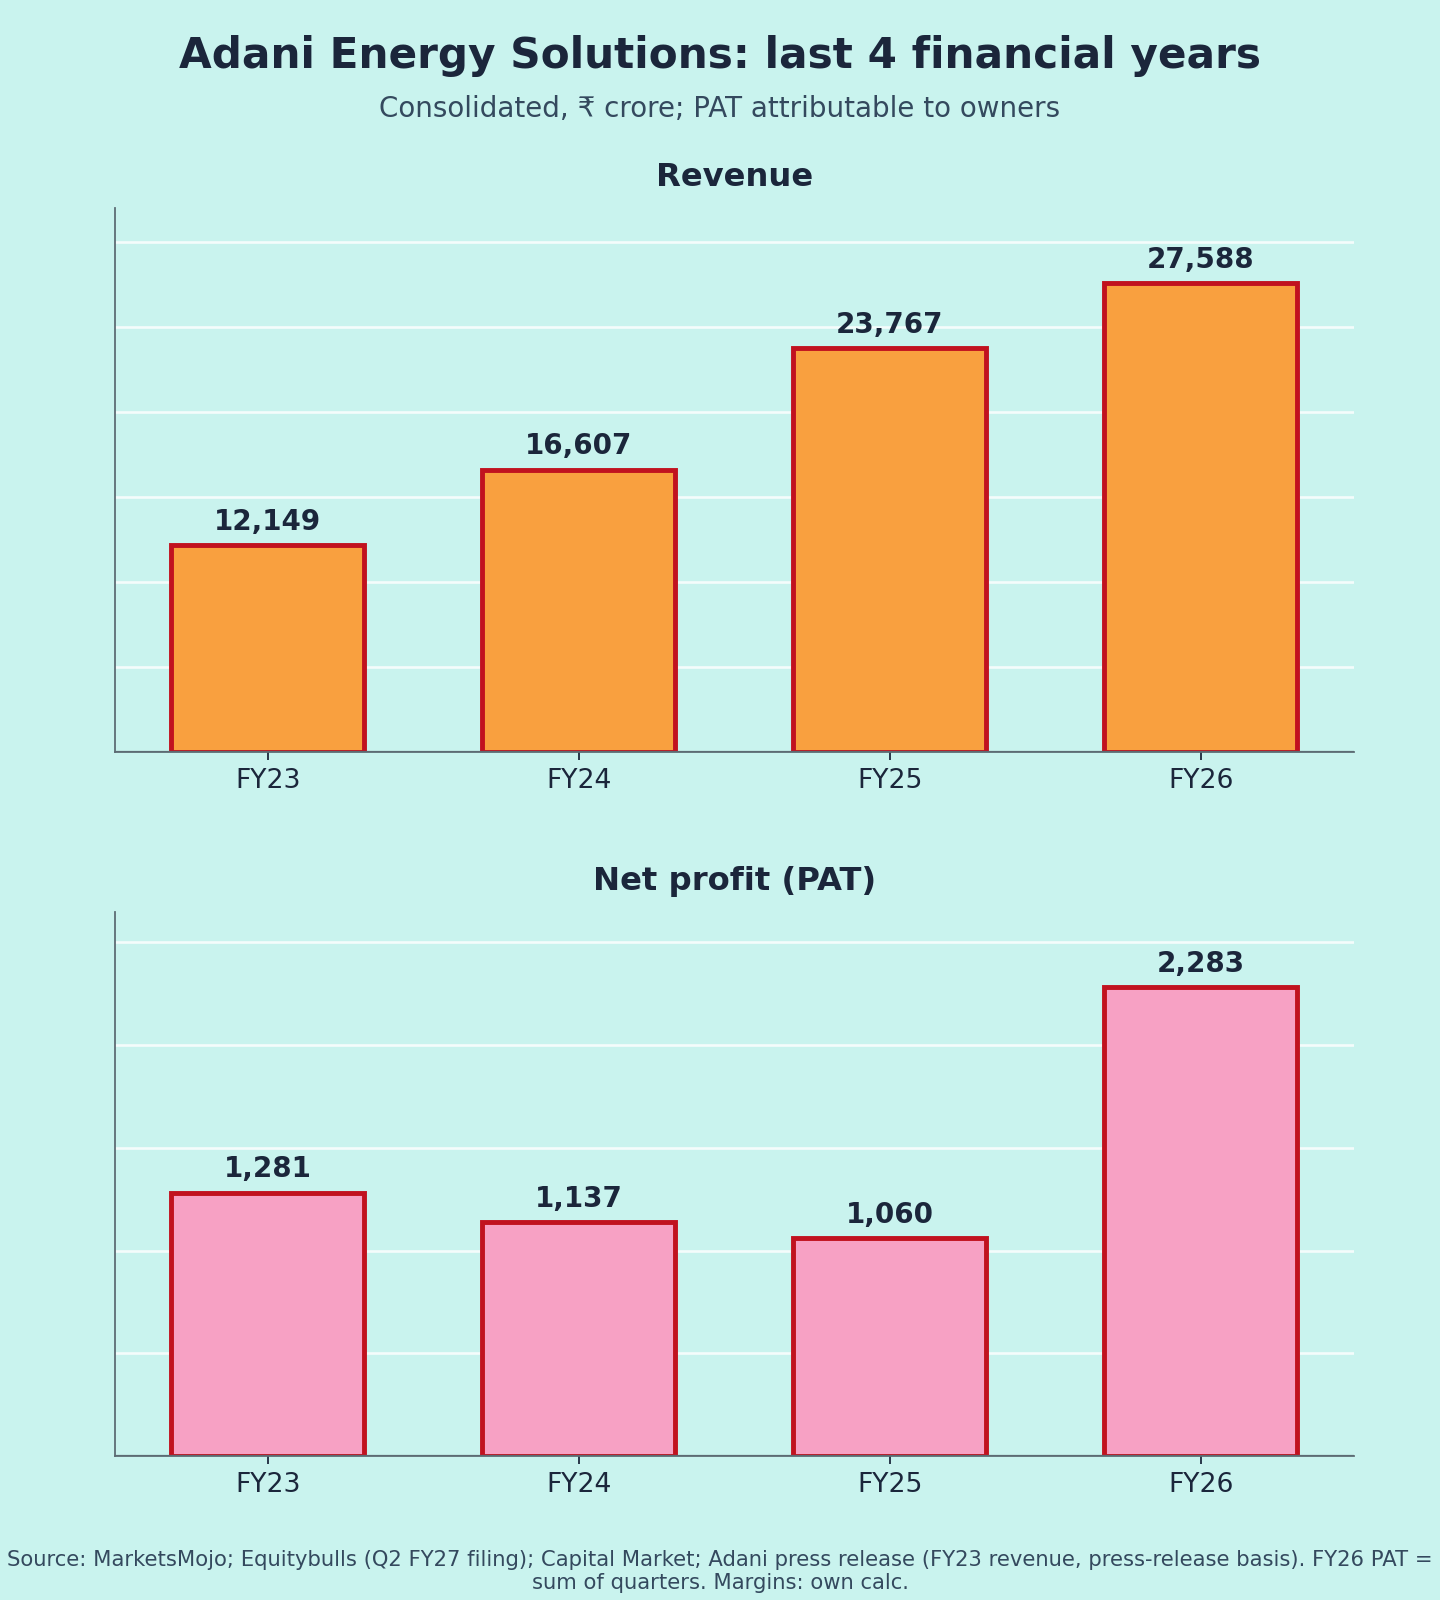
Charts: (1) last 5 quarters revenue & PAT [1][2]; (2) FY23–FY26 revenue & PAT [1][2][9][10] (FY23 revenue is the press-release figure; FY26 PAT summed from quarters); (3) EBITDA and PAT margin (own calc.).