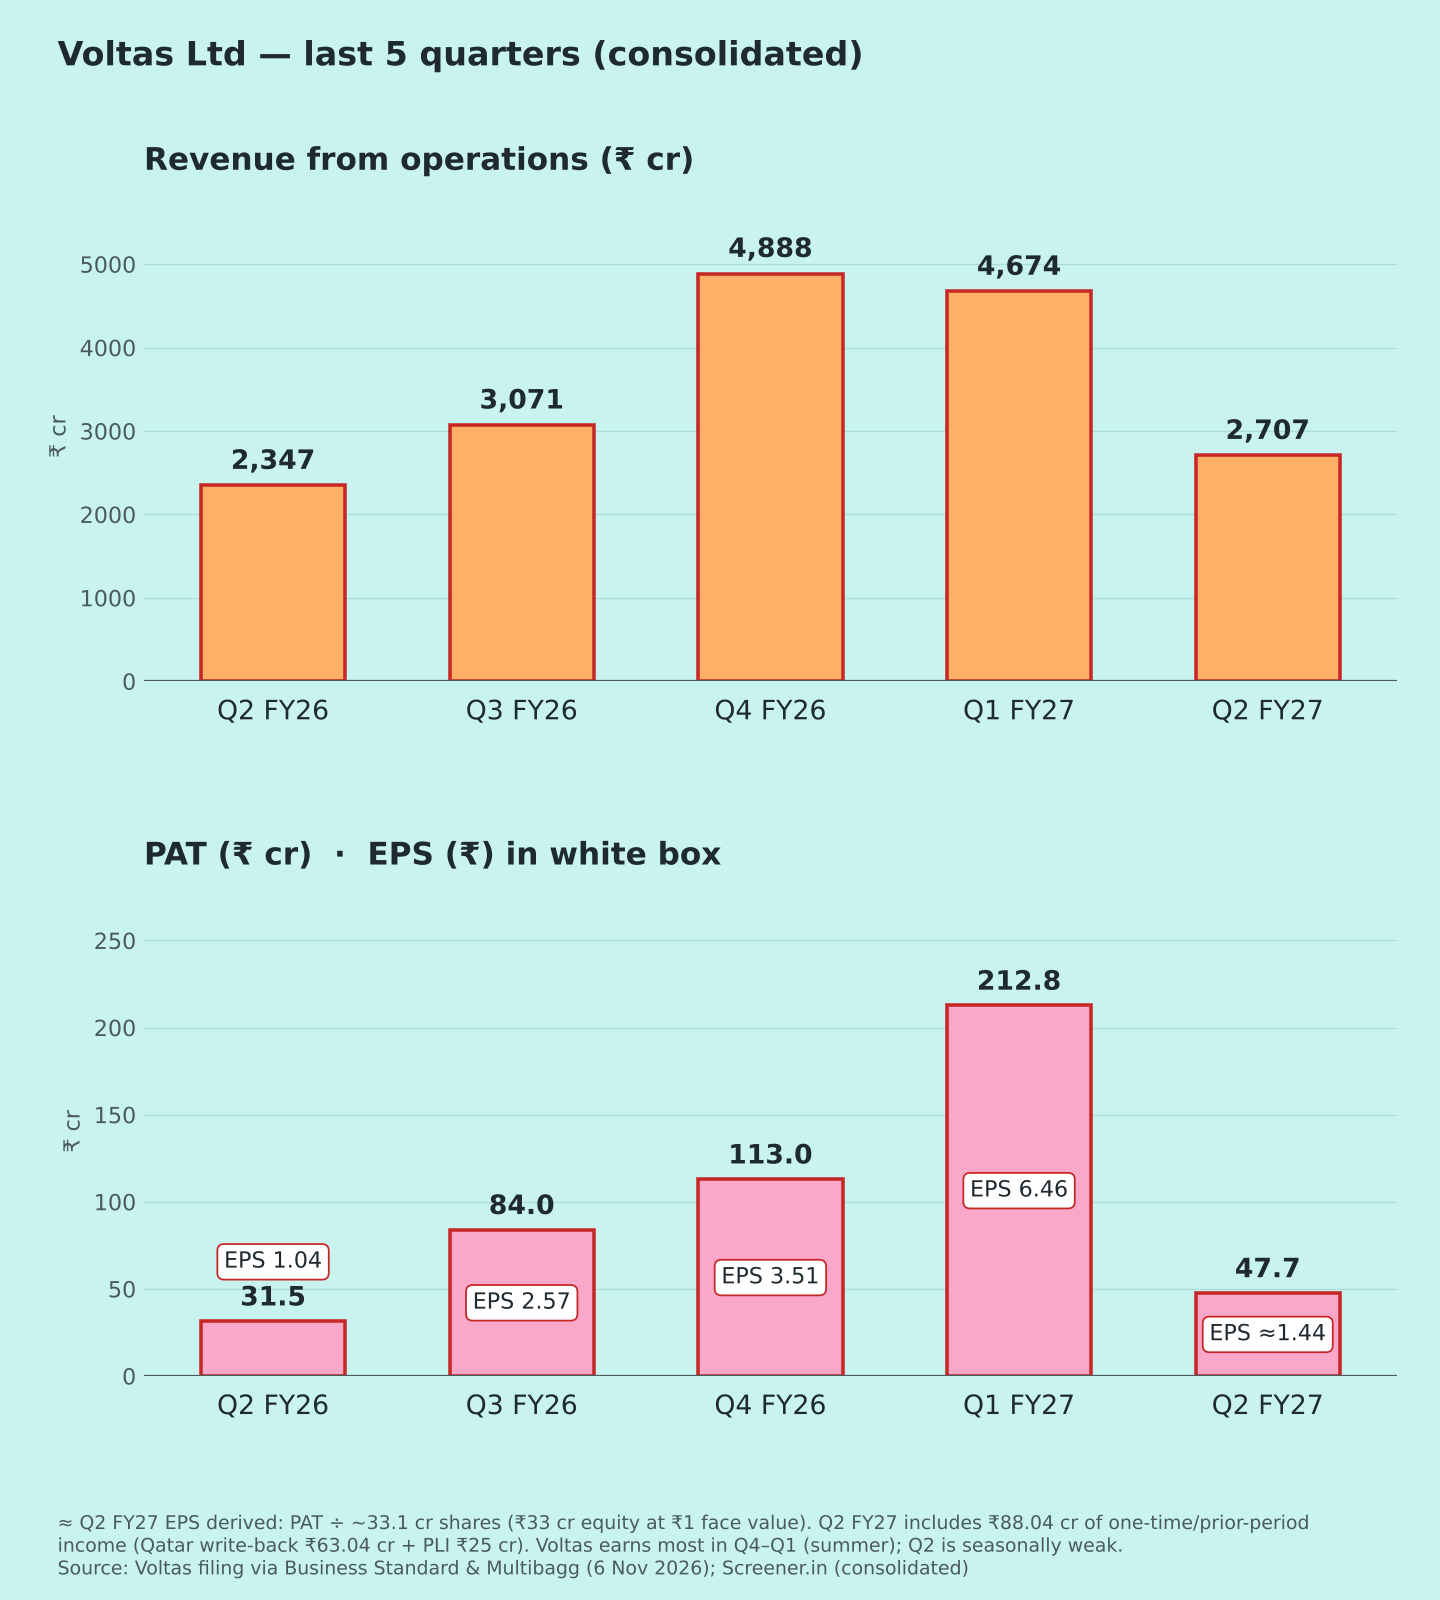
Consolidated figures, ₹ crore. Results announced 6 Nov 2026. EBITDA is left out: Reported Q2 EPS wasn't in coverage, so it is derived. Q2 is a seasonally small quarter for Voltas; the summer quarters (Q4–Q1) are the largest.
| Metric | Q2 FY27 | YoY | QoQ |
| Revenue from ops | 2,706.6 | +15.3% | −42.1% |
| Revenue excl. other income | ≈2,567.6 | ≈+10.9% | — |
| PBT | 82.9 | +53.2% | ≈−71% |
| PAT | 47.71 | +51.4% | −77.6% |
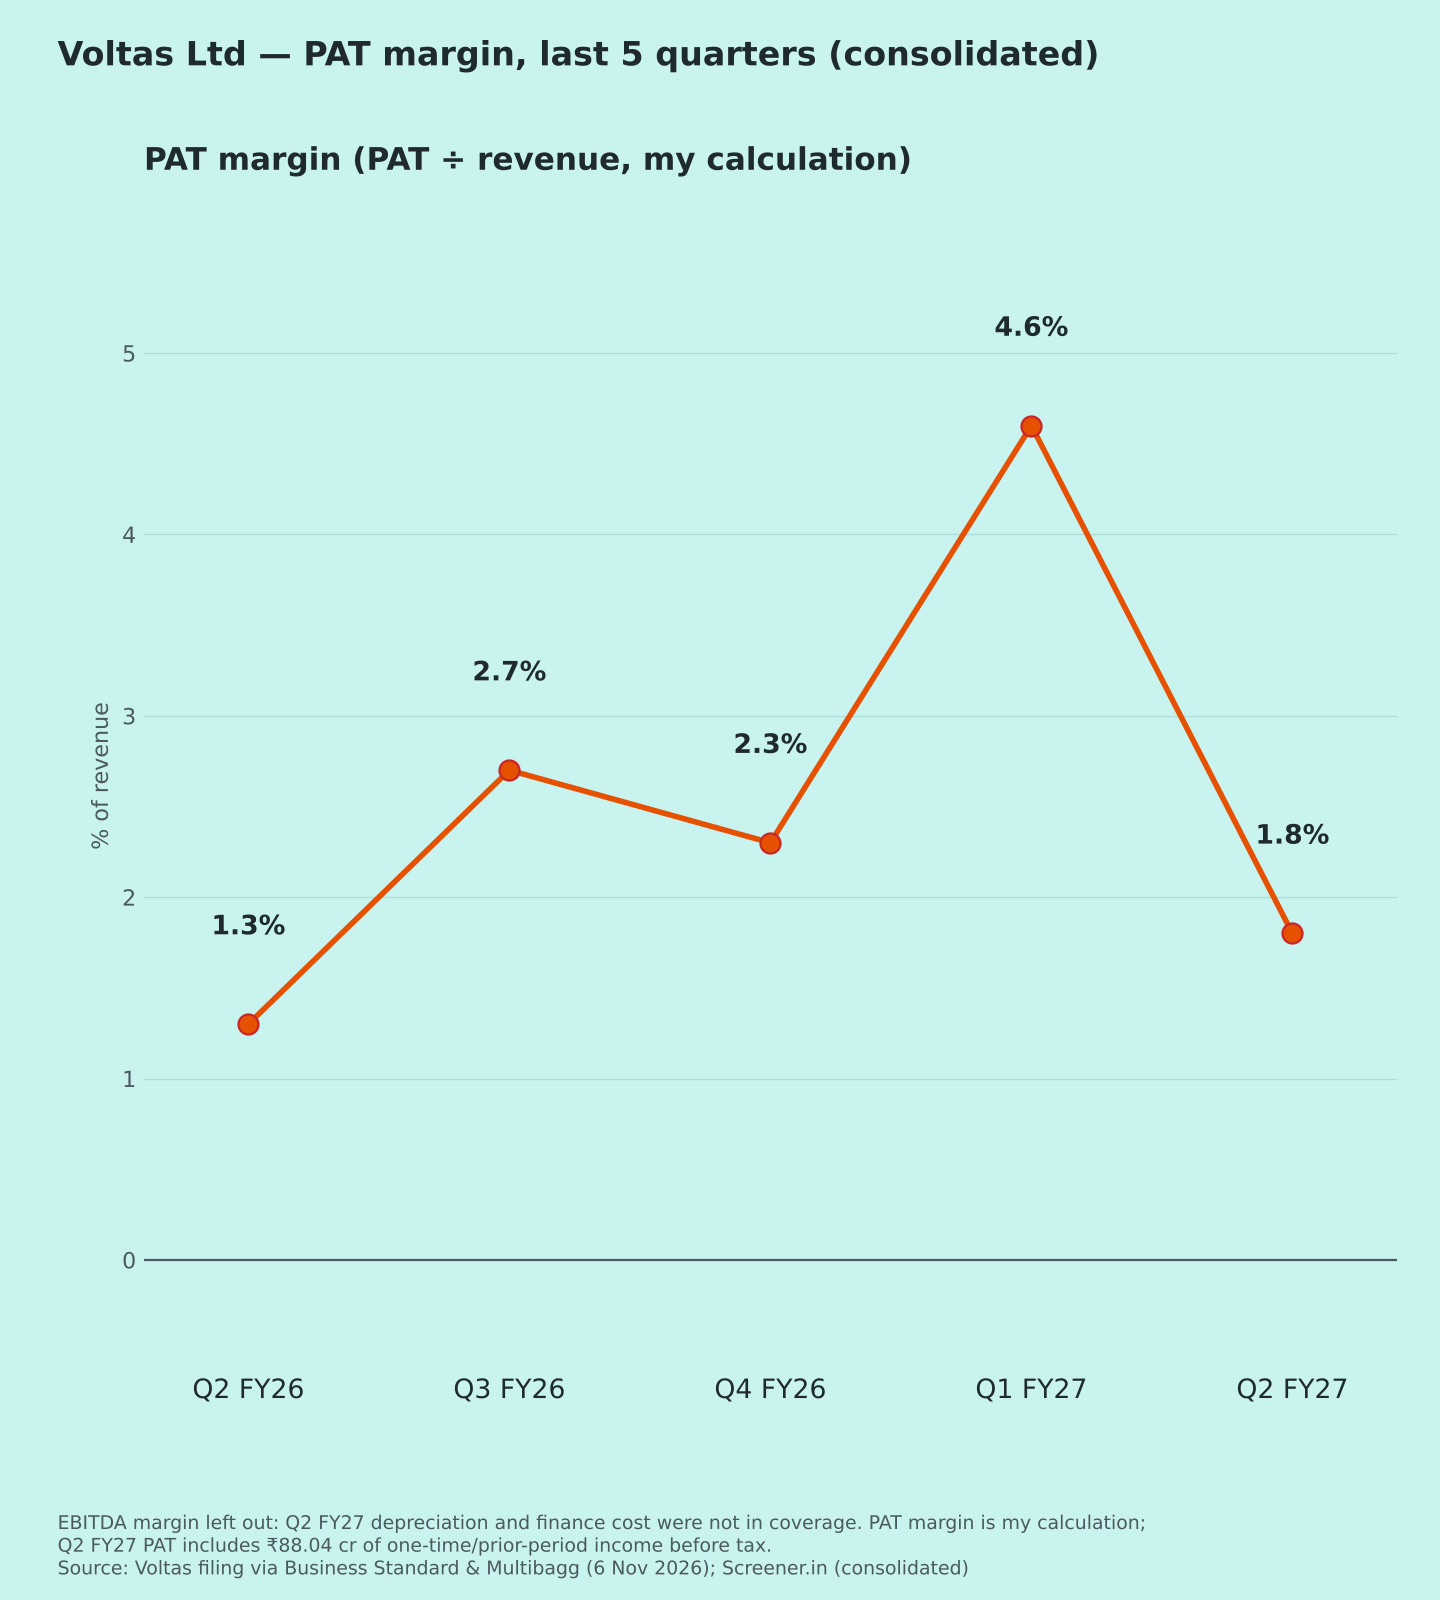
| PAT margin | 1.8% | 1.3% | 4.6% |
| EPS (₹, ≈ derived) | ≈1.44 | 1.04 → ≈1.44 | 6.46 → ≈1.44 |
| Other income / PBT (≈) | ≈48% | ≈119% | ≈32% |
Margin and ratio rows show year-ago and last-quarter values. ≈ derived: other income = total income ₹2,746.08 cr − revenue; EPS = PAT ÷ ~33.1 cr shares. % changes are my calculations except revenue and PAT YoY [1].
Source notes: Whalesbook's "revenue ₹2,746 cr" [5] is total income, which includes other income. Revenue from operations is ₹2,706.57 cr [1]. "29% growth" in some headlines is the cooling (UCP) segment only [3].
Quality of earnings: one-offs explain the profit
Revenue includes ₹139 cr of "other operating income" [2]. Of this, ₹88.04 cr is one-time or prior-period:
- ₹63.04 cr Qatar write-back: project provisions and payables were reversed after a Qatar court dismissed the main contractor's appeal. ₹438 cr of bank guarantees were cancelled [2].
- ₹25 cr PLI incentives, of which ₹15 cr relates to last year [2].
Without these items, Q2 PBT would be about −₹5 cr (₹82.93 cr − ₹88.04 cr, my calculation). In other words, the underlying quarter was roughly break-even.
Two other drags: other income fell to ~₹40 cr from ~₹65 cr, and the share of loss from joint ventures, mainly Voltbek, was ₹41.1 cr vs ₹36.5 cr [1][2].
Margins (Chart 3)
PAT margin: 1.3% → 2.7% → 2.3% → 4.6% → 1.8% (my calculation). Q2 is always thin for Voltas, so YoY is the fairer comparison.
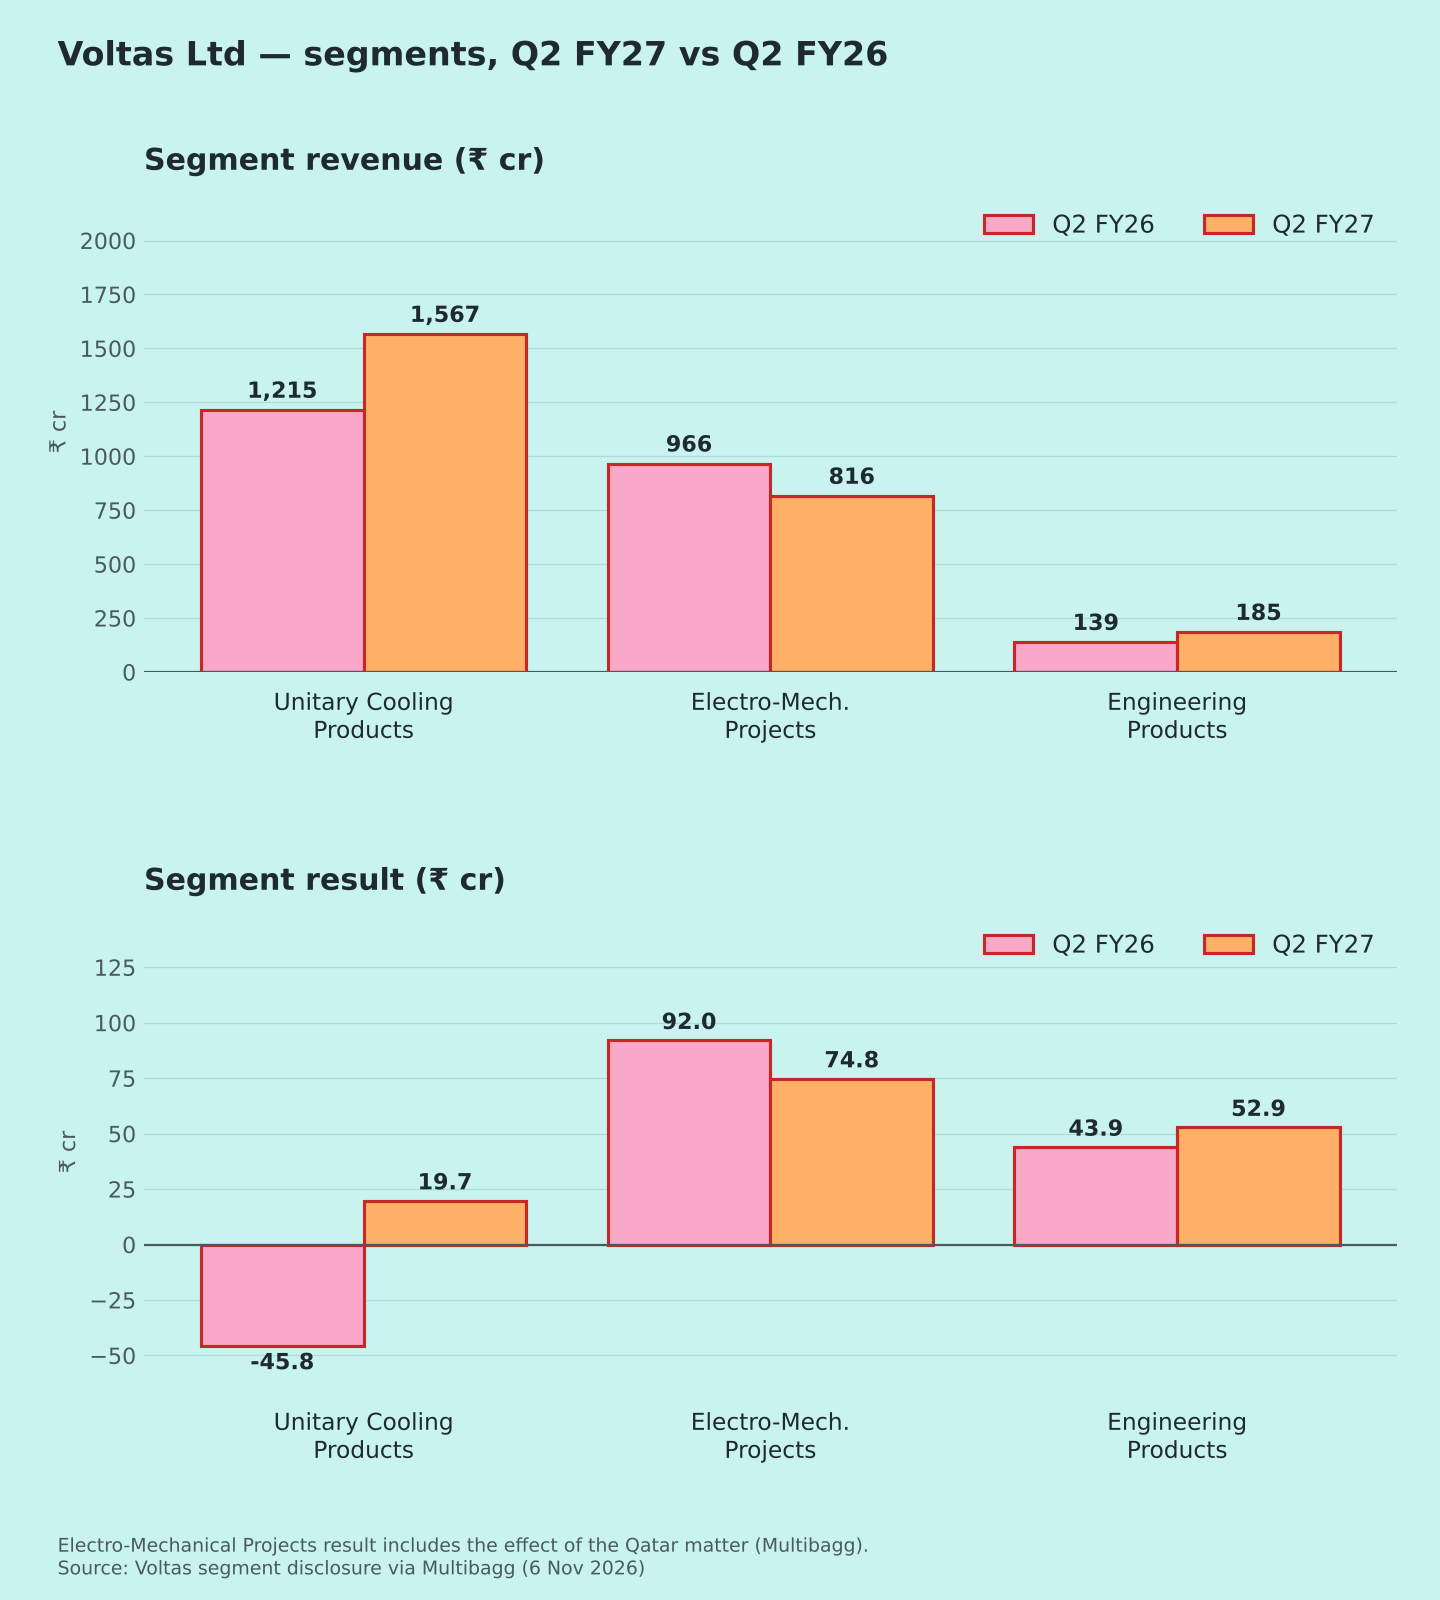
Segments (Chart 5) [2][3]
- Unitary Cooling (ACs, coolers): revenue +29% to ₹1,567 cr; result ₹19.7 cr vs a ₹45.8 cr loss. AC volumes rose 32%, and the AC market share was 17.4% year-to-date (+1.5 points), 4.2 points ahead of the next brand [4]. Management cited an extended summer.
- Electro-Mechanical Projects: revenue −15.5% to ₹816 cr; result ₹74.8 cr vs ₹92.0 cr. The order book is over ₹6,800 cr.
- Engineering Products: revenue +33% to ₹185 cr; result ₹52.9 cr vs ₹43.9 cr.
Positives
- AC volumes +32% with market-share gains
- Cooling segment back to profit
Concerns
- Core profit near zero without one-offs (my calculation)
- Voltbek JV losses continuing [1]
- Projects revenue down [2]
Things to track in Q3 FY27
- Underlying PBT without one-offs
- Pre-summer channel stocking
Not a buy/sell recommendation. I am not a SEBI-registered analyst. Facts are sourced; opinions are labelled.
Sources [1] Business Standard – Q2 results · [2] Multibagg – profit, one-off income, segments · [3] Multibagg – cooling growth & AC lead · [4] Multibagg – AC market share (presentation) · [5] Whalesbook – Q2 PAT · [6] Screener.in – consolidated
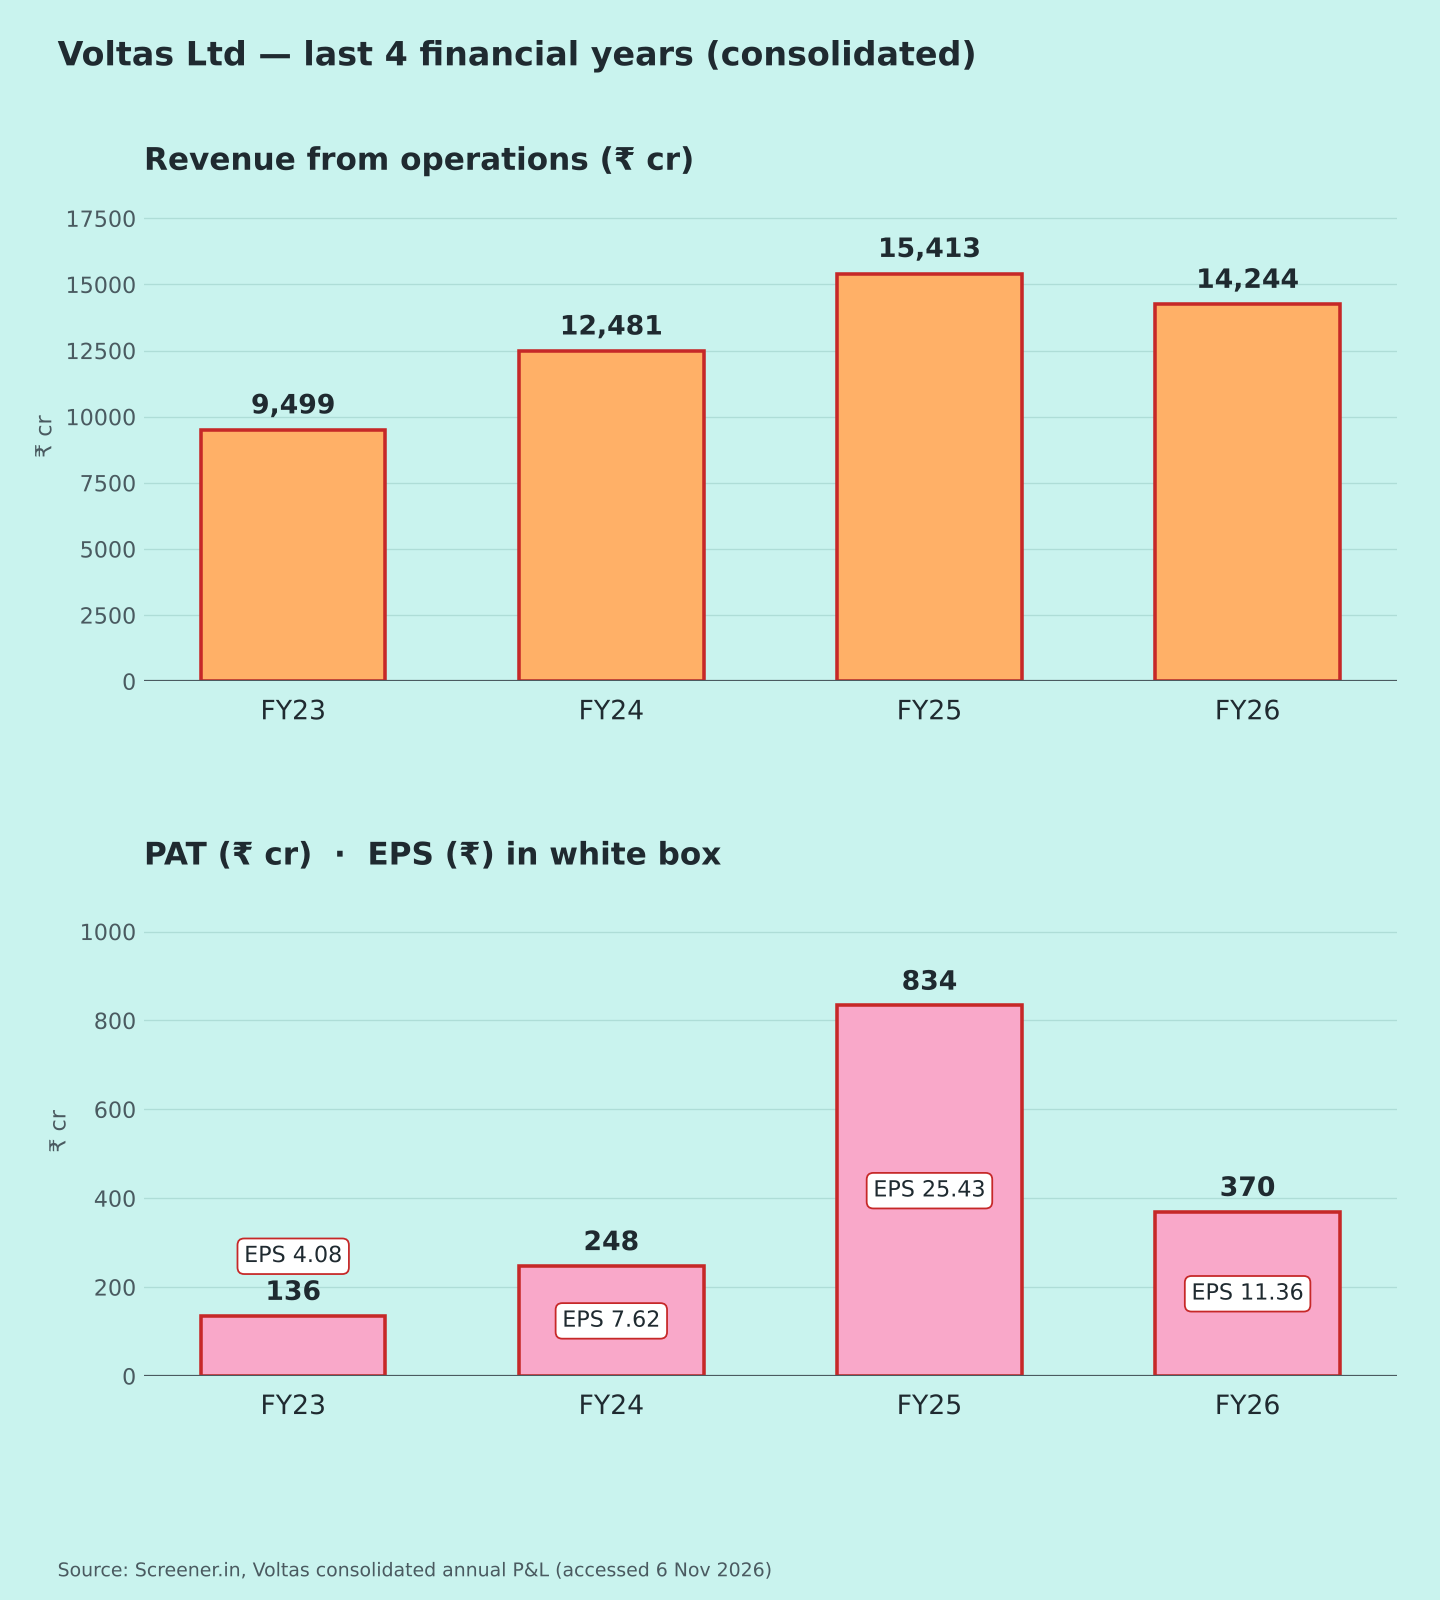
Charts: (1) 5 quarters revenue & PAT with EPS [1][6]; (2) FY23–FY26 [6]; (3) PAT margin [1][6]; 4) segments [2].