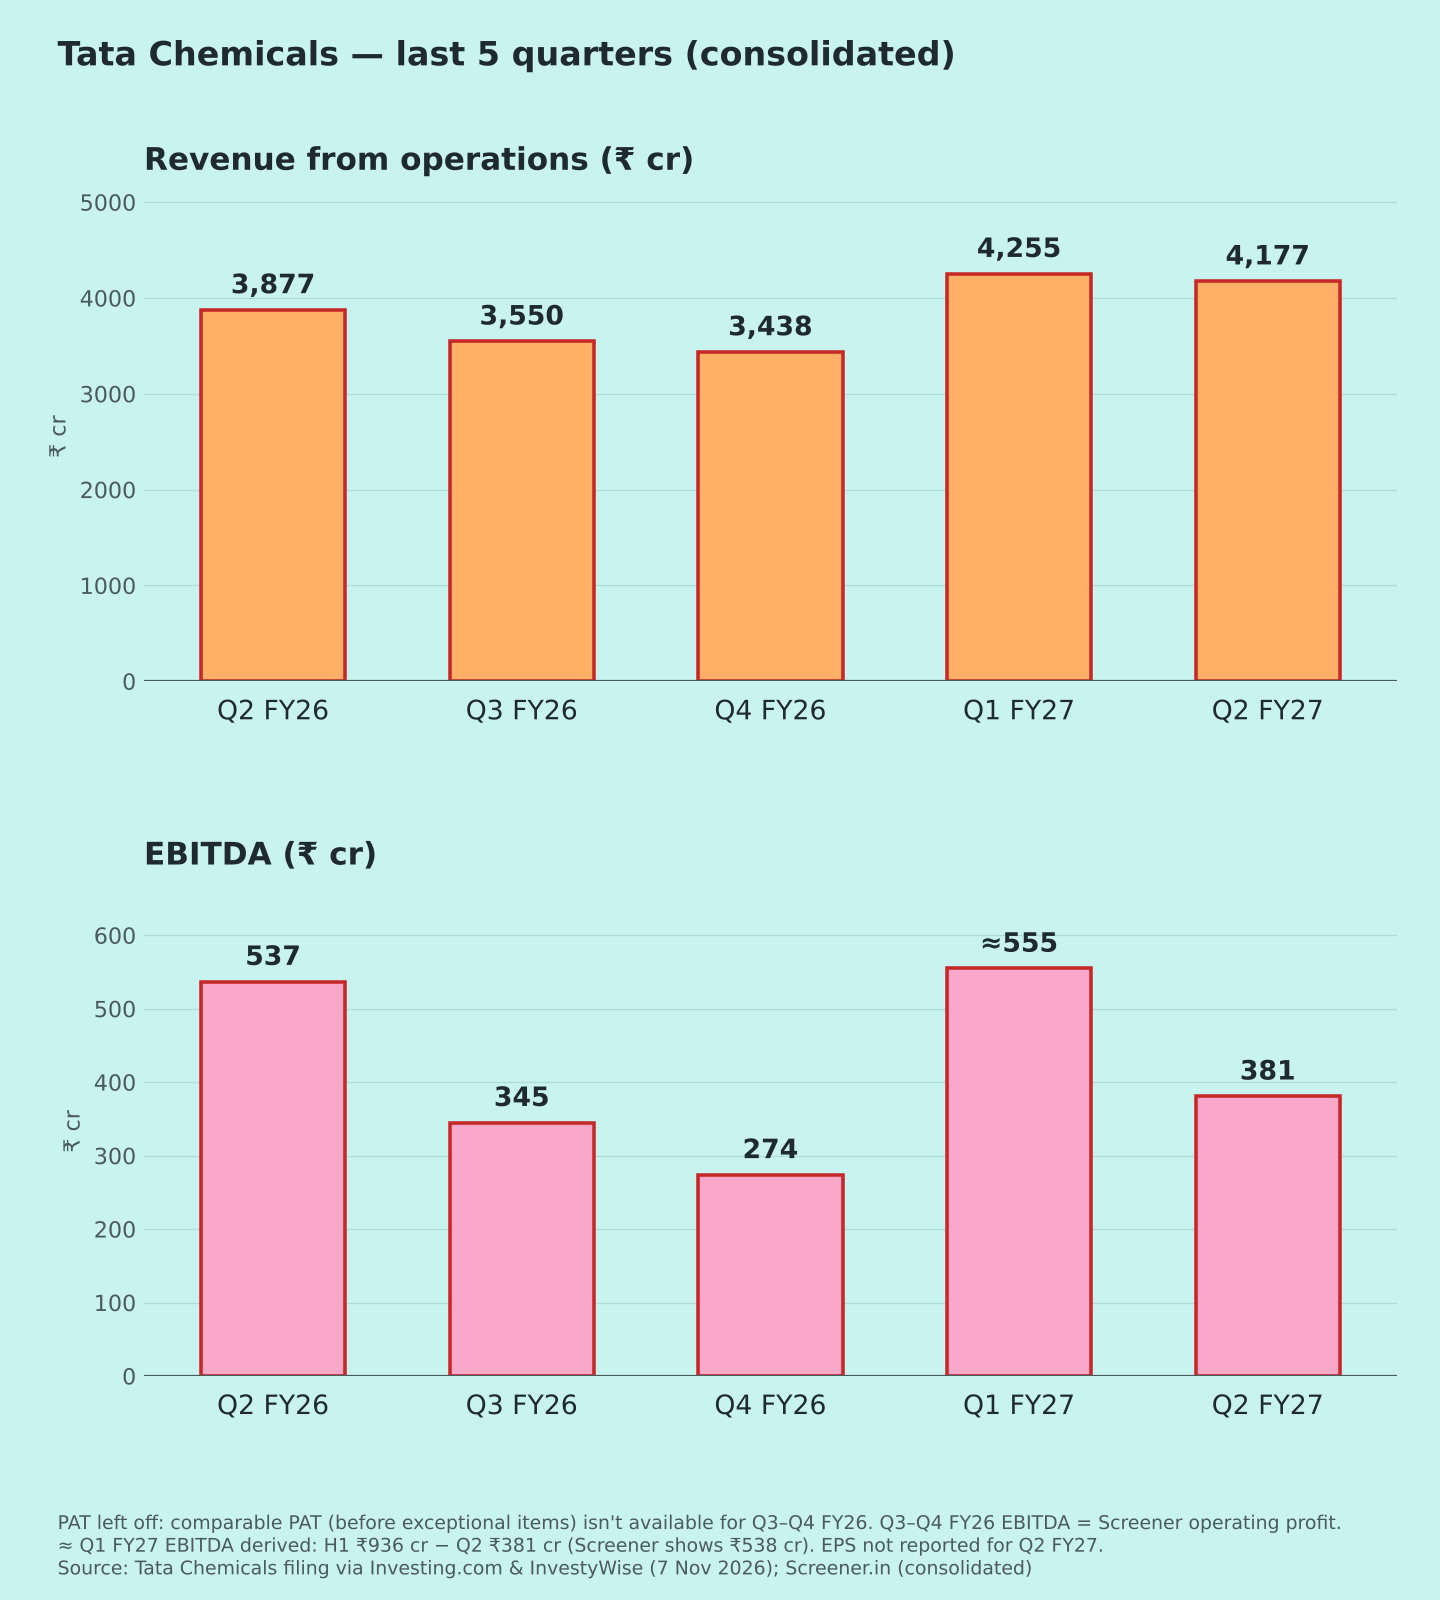
Consolidated figures, ₹ crore. Board meeting 7 Nov 2026. PAT here is total PAT before exceptional items, as the company reports it. The exceptional-items amount, PAT attributable to shareholders and EPS weren't in coverage, so they are left out. The company's EBITDA appears to exclude other income (Q2 FY26 matches Screener's operating profit [7]).
| Metric | Q2 FY27 | YoY | QoQ |
| Revenue from ops | 4,177 | +8% | −1.8% |
| EBITDA | 381 | −29.1% | ≈−31% |
| EBITDA margin | 9.1% | 13.9% | ≈13.0% |
| PAT before exceptional items | −50 (loss) | from +219 | from +60 |
| Net debt (excl. leases) | 6,127 | — | 5,961 (Mar 2026) |
Margin and debt rows show year-ago and earlier values. ≈ derived: Q1 EBITDA = H1 ₹936 cr − Q2 ₹381 cr; Q1 PAT = H1 ₹10 cr − Q2 (−₹50 cr). QoQ % are my calculations.
Source notes: One InvestyWise article headlines "₹248 crore profit" [6]. Investing.com [1][2] and other InvestyWise reports [3][5] all show a loss of ₹50 cr, and the H1 figure only adds up with a loss. My guess is that ₹248 cr is a different measure (total comprehensive income was ₹198 cr). Please check the filing.
Quality of earnings
- India is doing fine; overseas is the drag. Standalone (India) EBITDA rose 22% to ₹292 cr, a 22.4% margin [3].
- Overseas problems [2]:UK: gas and logistics costs rose sharply.
- US: realisations fell.
- Kenya: operations were suspended all quarter.
- Singapore (Novabay): CO₂ costs rose.
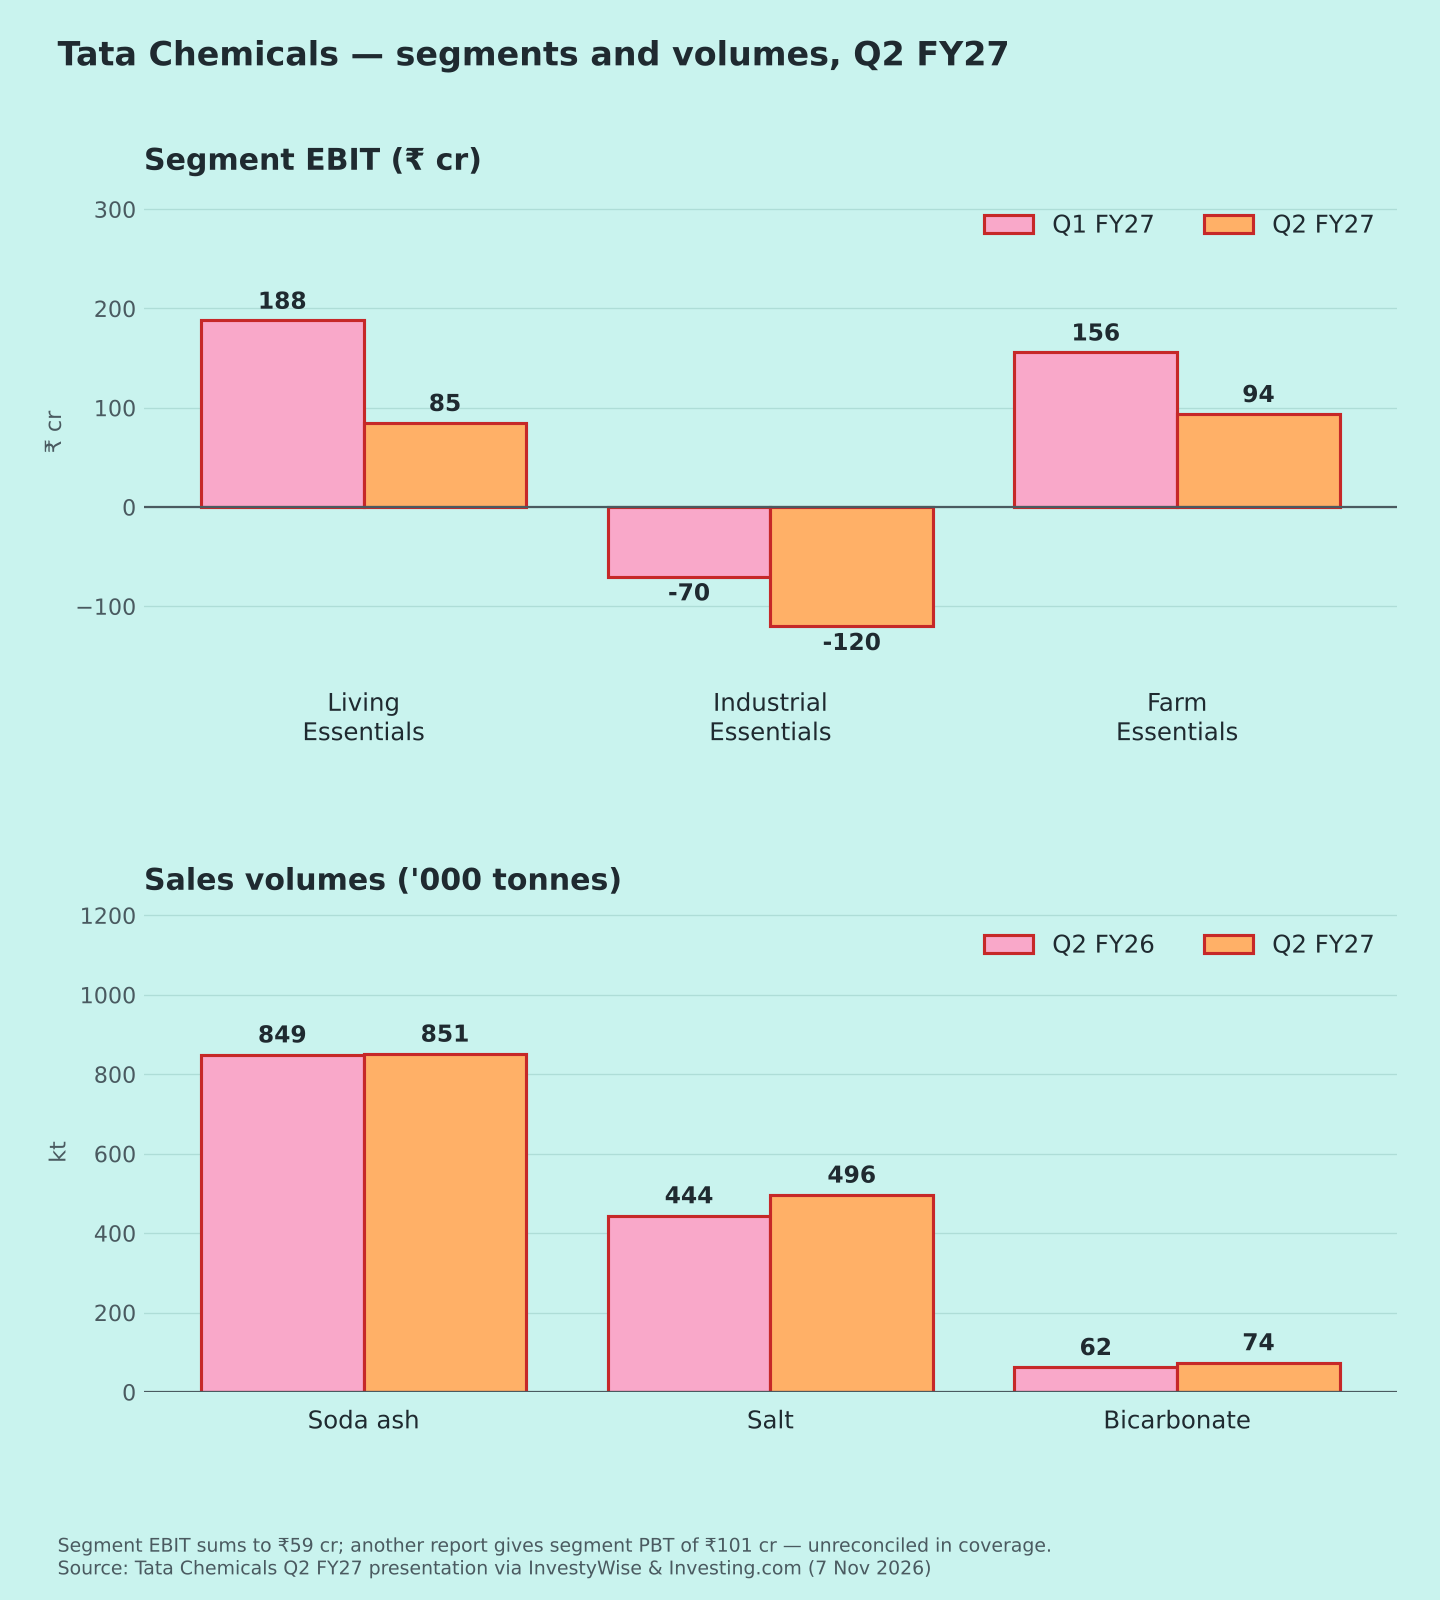
- Industrial Essentials (mainly soda ash) posted a segment loss of ₹120 cr vs ₹70 cr in Q1 [5].
- Volumes held: soda ash 851 kt (849 kt a year ago), salt 496 kt (444 kt), bicarbonate 74 kt (62 kt) [1]. The pressure is on price and cost, not demand.
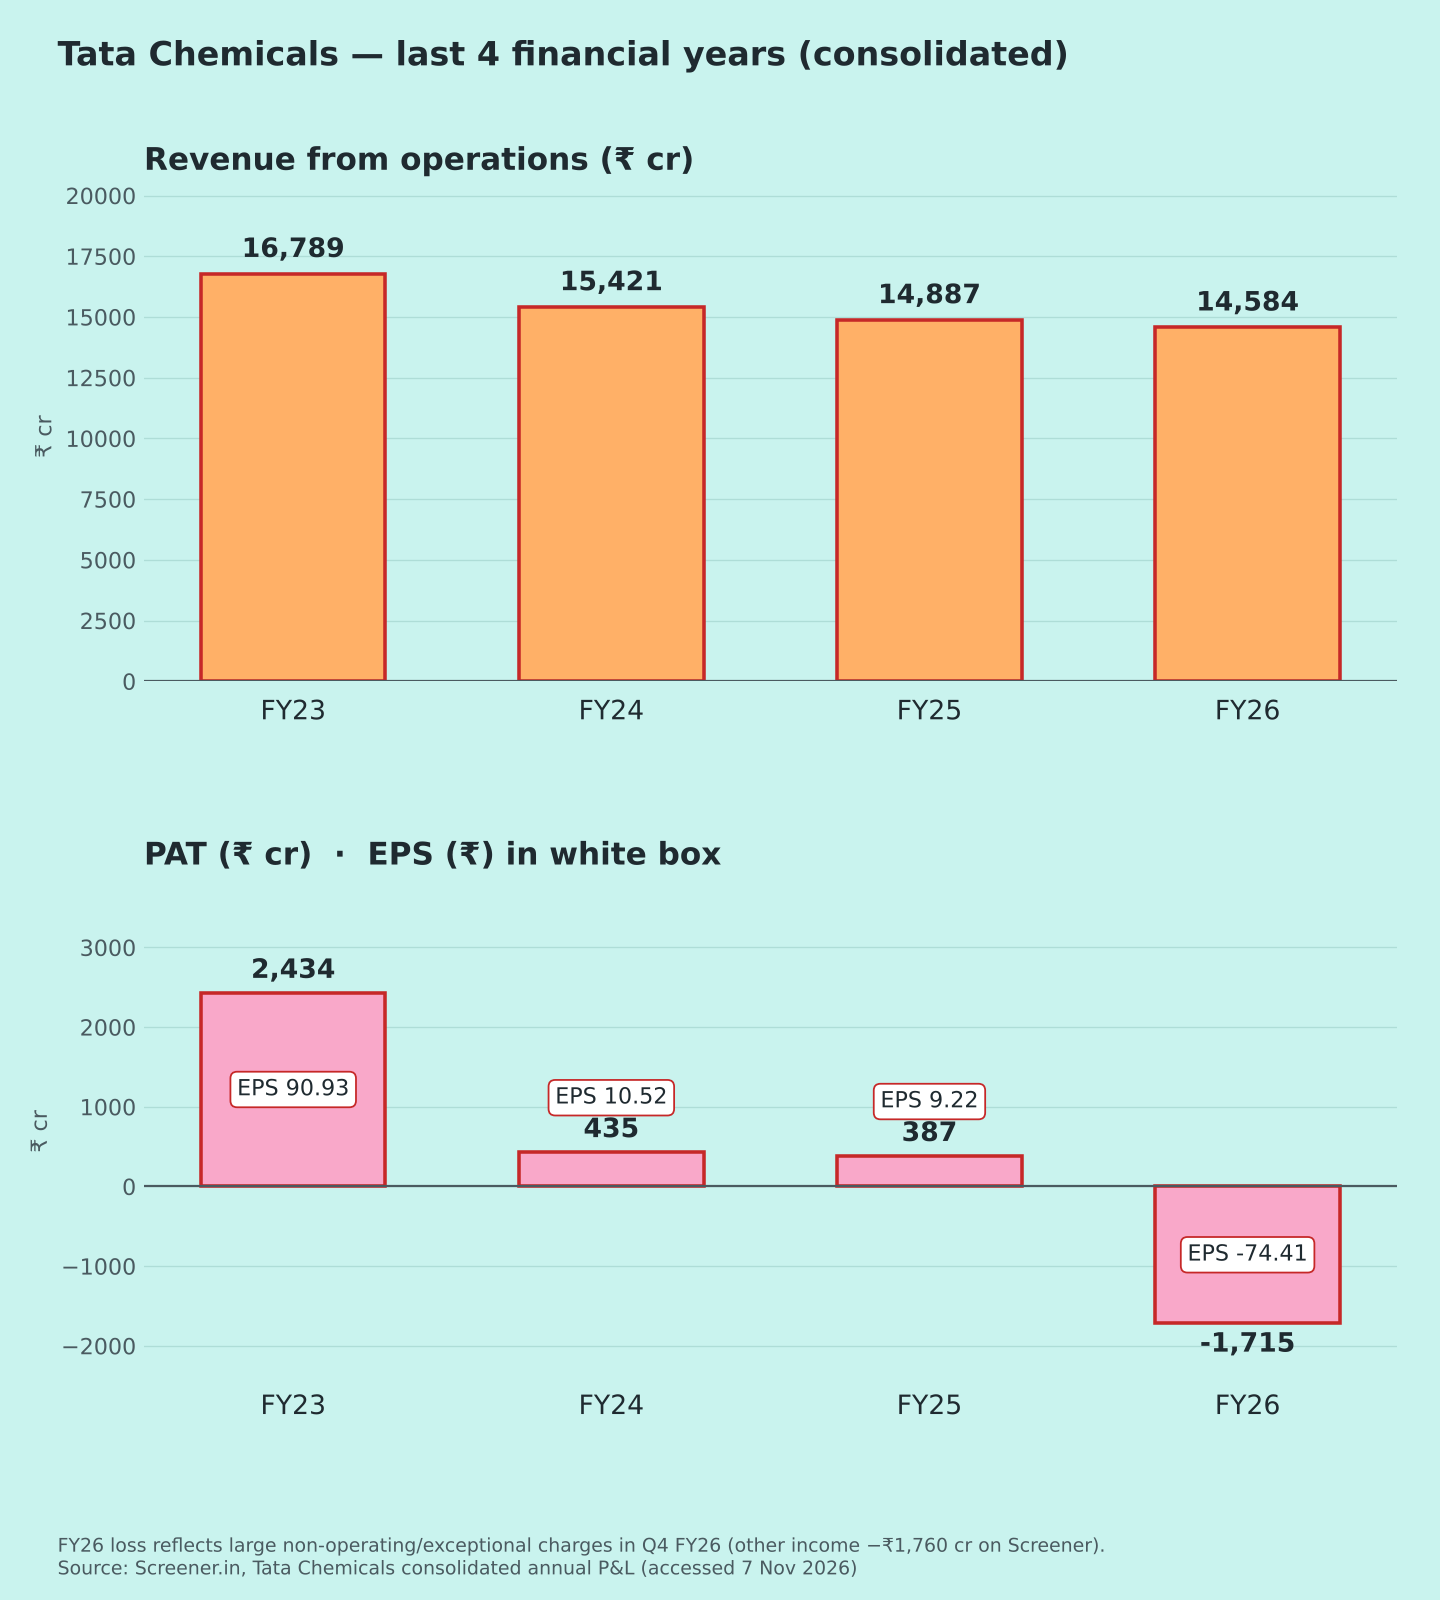
- Exceptional items exist but weren't quantified in coverage. FY26 had a ₹2,116 cr loss in Q4 on large one-off charges [7].
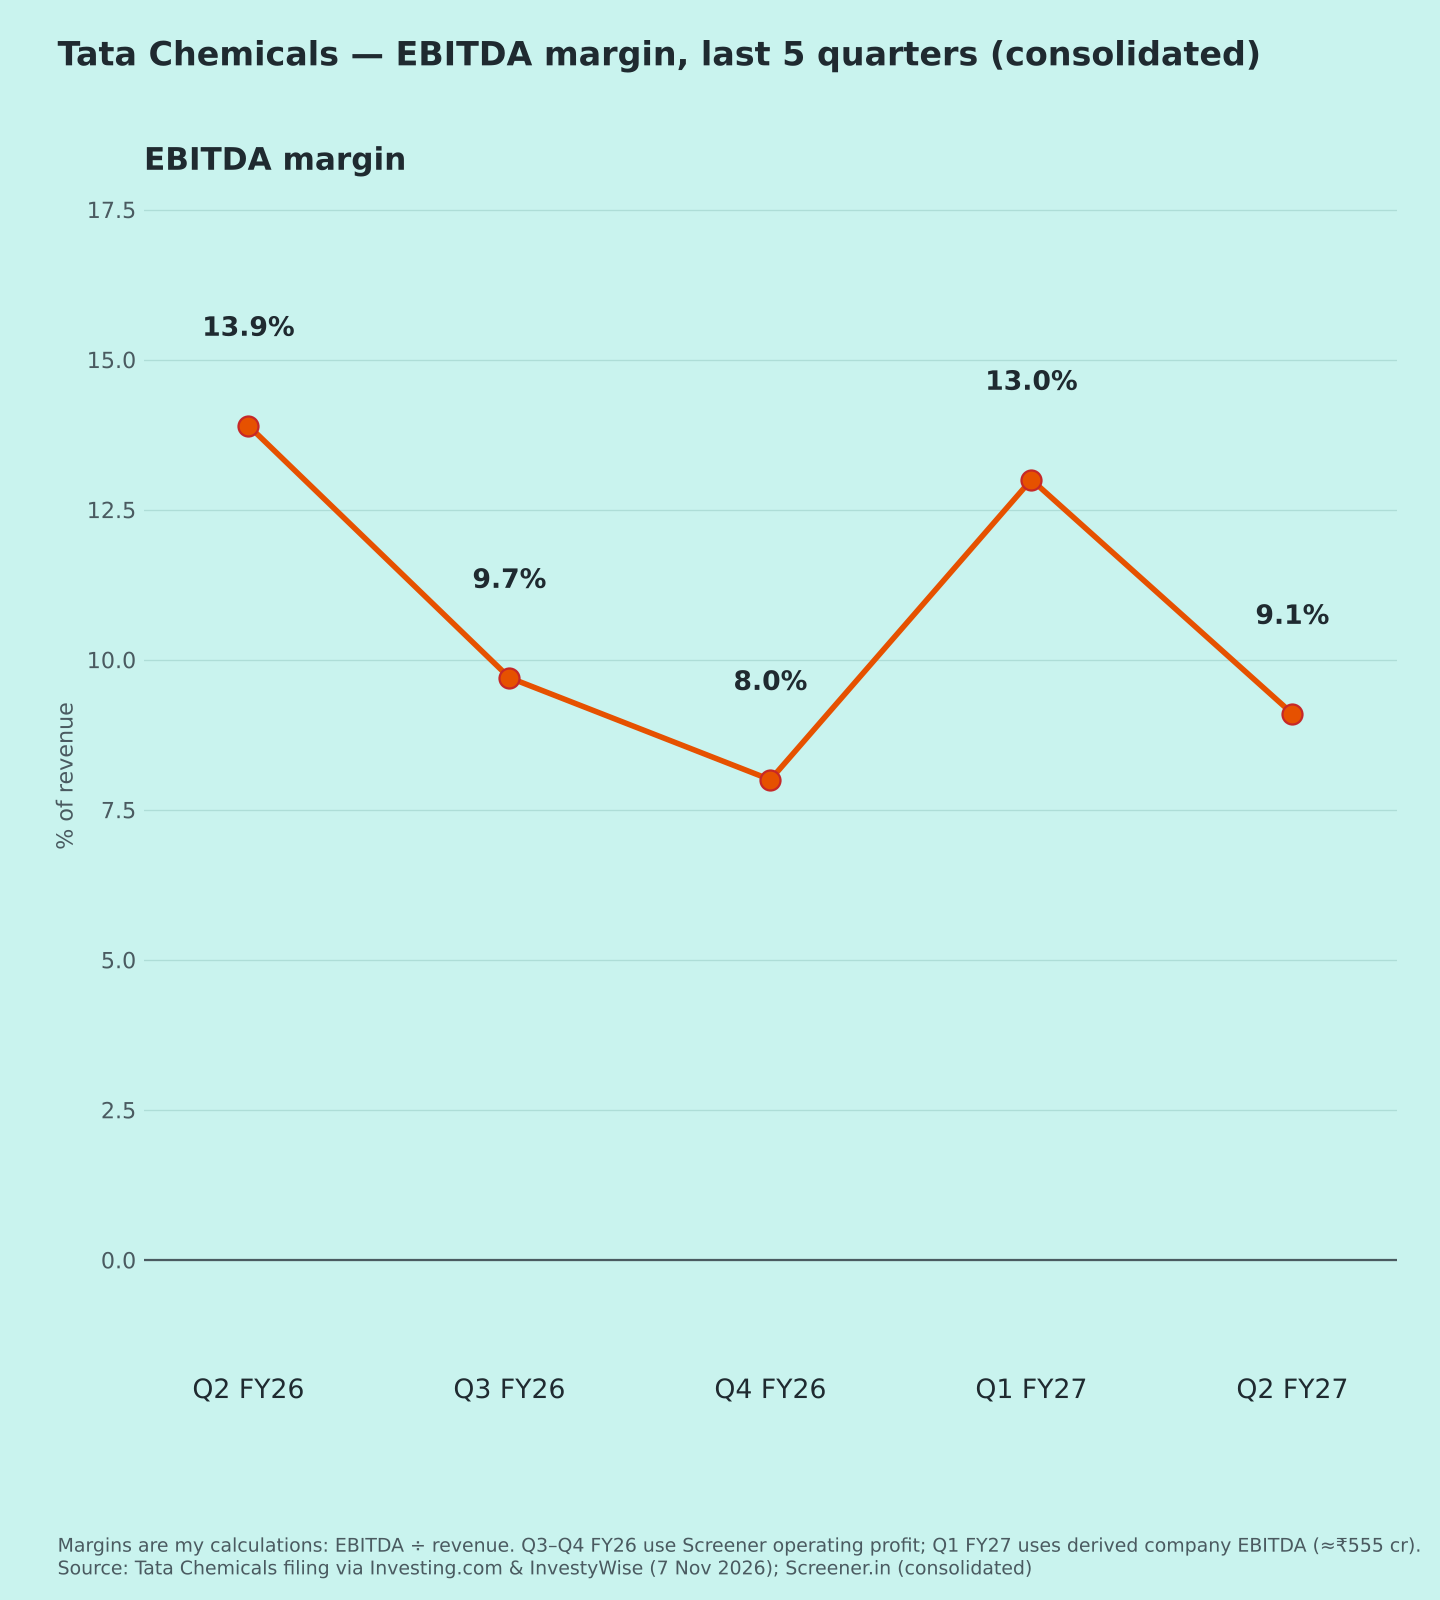
Margins (Chart 3)
EBITDA margin: 13.9% → 9.7% → 8.0% → 13.0% → 9.1% (my calculation). The Q1 recovery reversed in Q2.
Management commentary (call, 7 Nov)
- Global soda ash "remains oversupplied". Chinese producer inventory was about 1.89 mn tonnes.
- India's trade-remedies regulator (DGTR) has recommended two years of import quantity restrictions on soda ash.
- The US unit is exiting loss-making exports to Southeast Asia.
- Capex is about ₹1,000 cr this year and a similar amount next year. Debt reduction and cash flow are priorities; ₹796 cr from selling group-company shares was used to repay US and UK debt.
Positives
- India business margins improving [3]
- Volumes steady or rising [1]
Concerns
- Overseas costs and the Kenya shutdown [2]
- Back to a loss; net debt rising [1][5]
Things to track in Q3 FY27
- Whether the soda ash import restrictions are implemented
- UK energy costs and Kenya restart
- Exceptional items and attributable PAT in the filing
- Net debt trend
Not a buy/sell recommendation. I am not a SEBI-registered analyst. Facts are sourced; opinions are labelled.
Sources [1] Investing.com – Q2 FY27 slides · [2] Investing.com – earnings call transcript · [3] InvestyWise – Q2 results · [4] InvestyWise – board outcome · [5] InvestyWise – investor presentation · [6] InvestyWise – "₹248 crore profit" article · [7] Screener.in – consolidated
Charts: (1) 5 quarters revenue & EBITDA [1][7]; (2) FY23–FY26 revenue & PAT with EPS [7]; (3) EBITDA margin [1][7]; (4) headline revenue & PAT before exceptional items [1][2]; (5) segments & volumes [1][5]. Chart 1 shows EBITDA instead of PAT: comparable PAT isn't available for Q3–Q4 FY26.