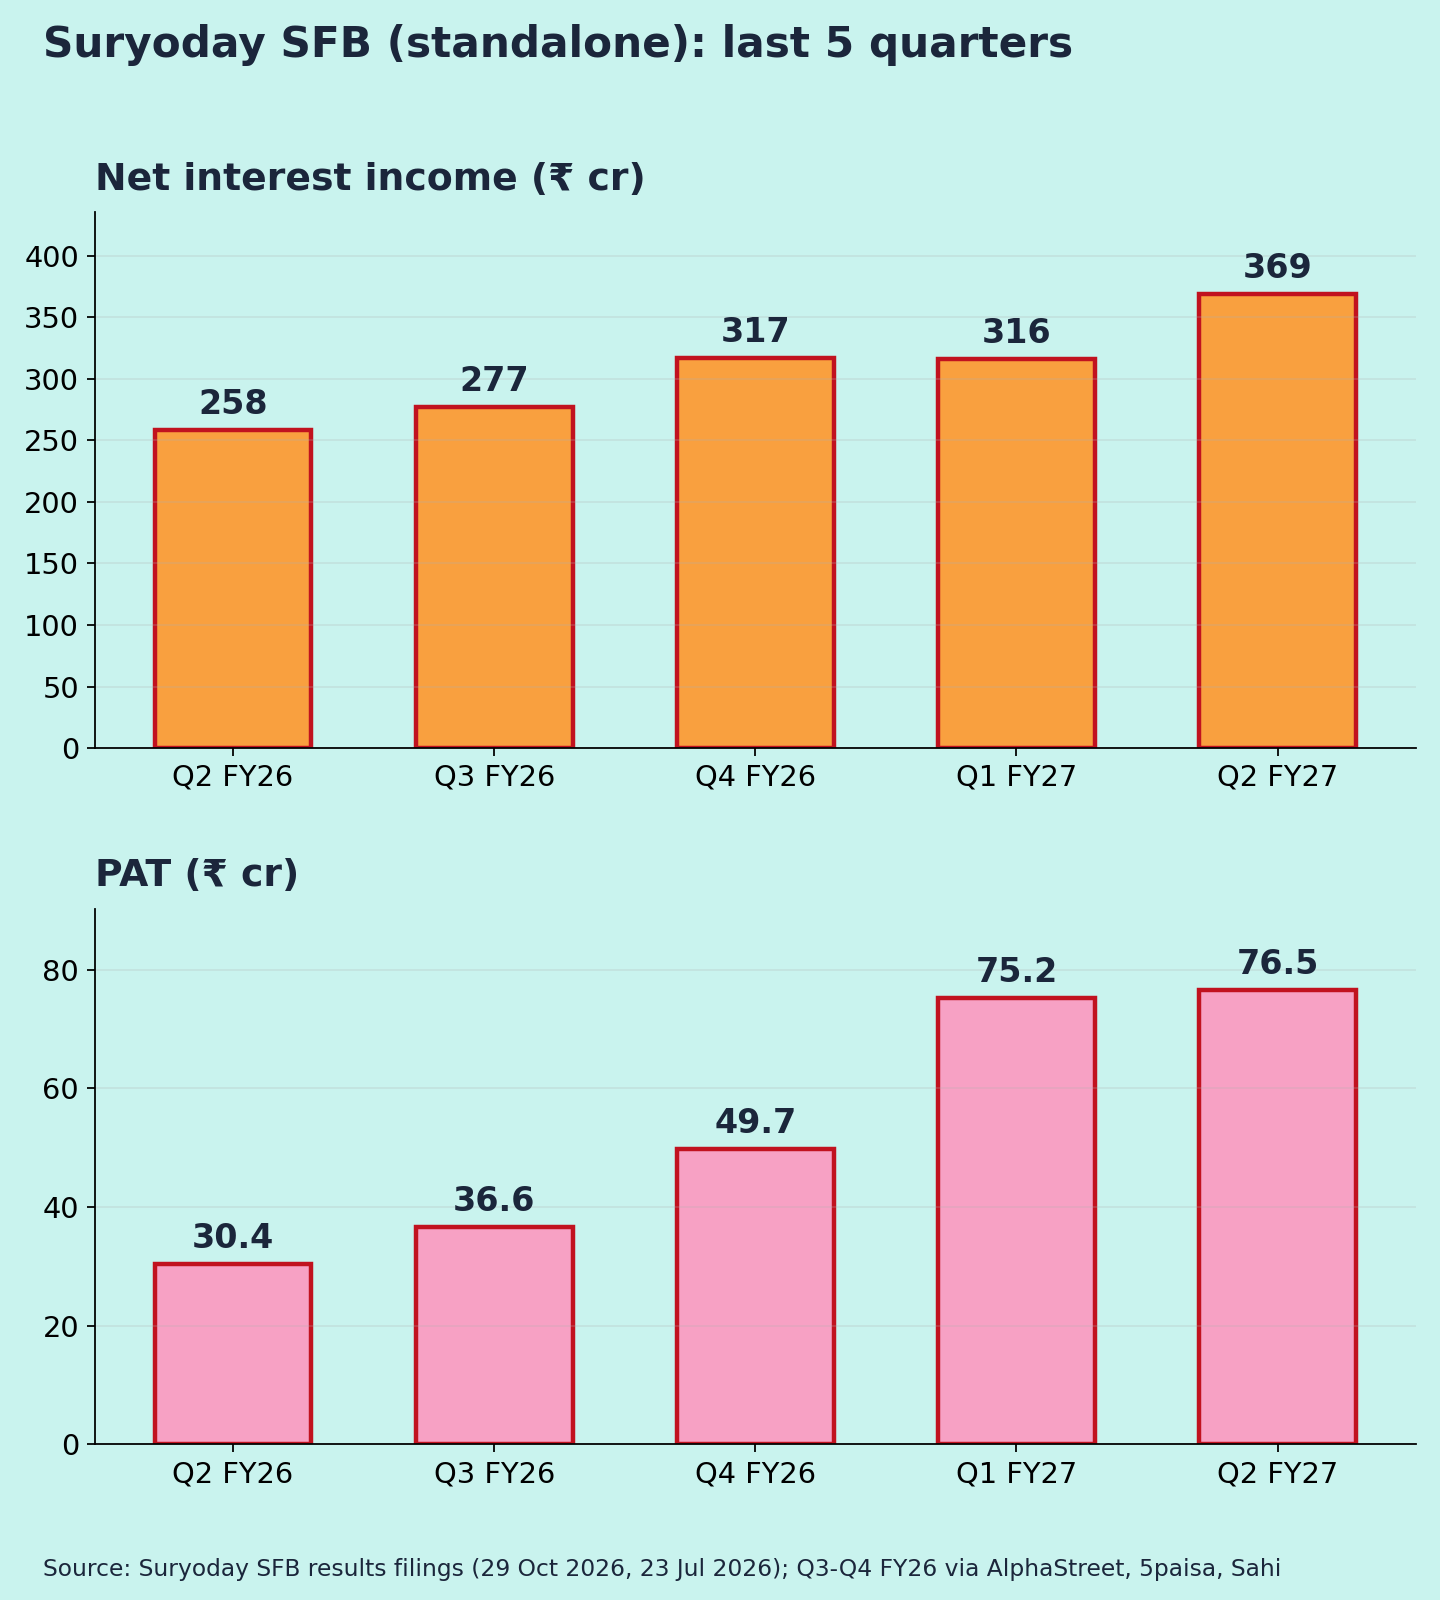
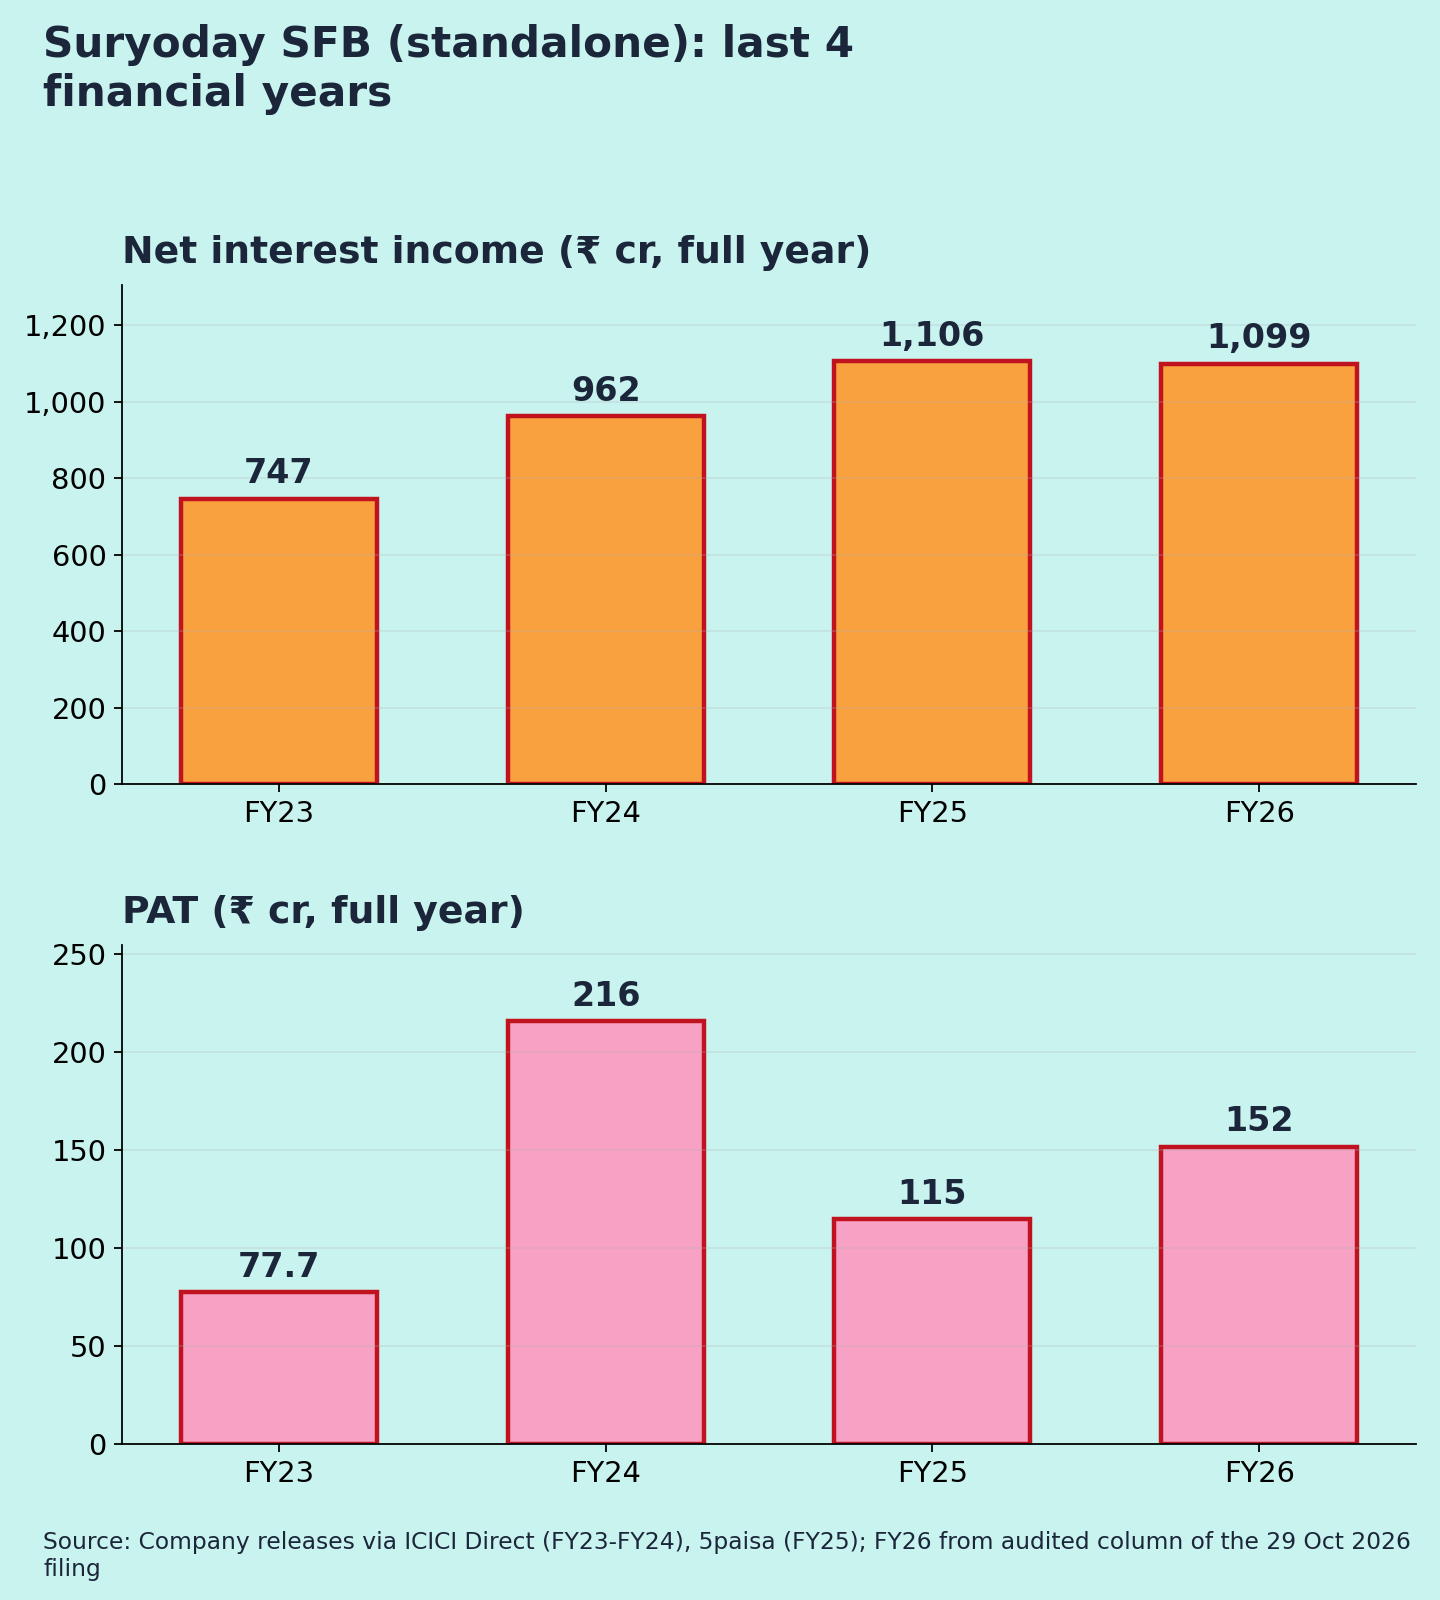
All figures standalone, ₹ crore unless stated. Results approved at a board meeting that ended at 6:10 PM on 29 Oct 2026, after market hours. P&L lines are from the filing; YoY/QoQ %, CD ratio and annualised ratios are my calculations.
| Metric | Q2 FY27 | YoY | QoQ |
| Gross advances (incl. IBPC) | 14,972 | +34.6% | +4.2% |
| Deposits | 16,184 | +35.0% | +10.6% |
| NII | 368.8 | +42.8% | +16.8% |
| NIM | 7.2% | 6.9% | 7.2% |
| Other income | 126.5 | +58.5% | −14.4% |
| Operating expenses | 349.8 | +35.1% | +7.6% |
| Operating profit (PPOP) | 145.5 | +83.8% | +5.0% |
| Provisions | 41.3 | +3.5% | +12.5% |
| PAT | 76.5 | 2.5x | +1.8% |
| Cost-to-income | 70.6% | 76.6% | 70.1% |
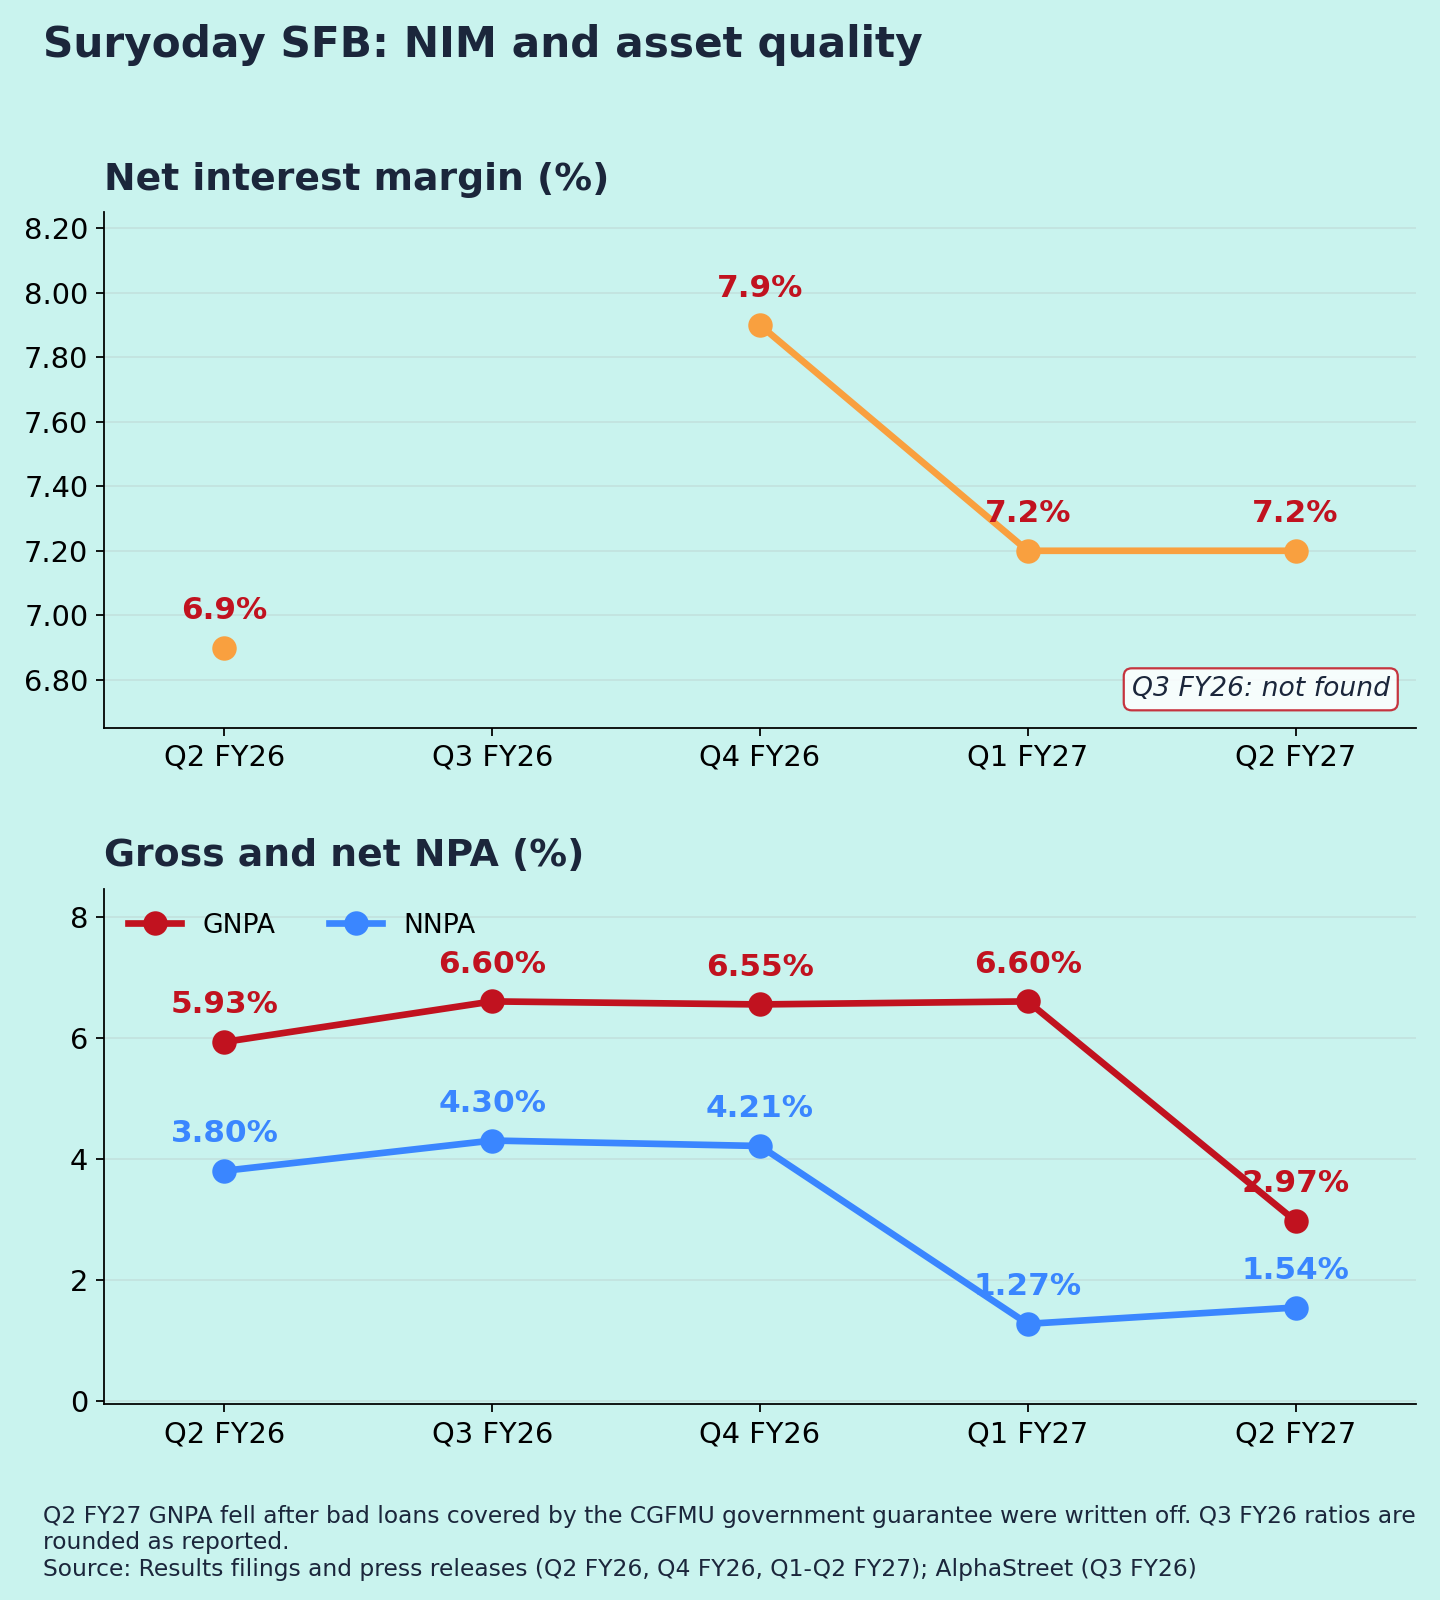
| GNPA / NNPA | 2.97% / 1.54% | 5.93% / 3.80% | 6.60% / 1.27% |
| PCR (excl. write-offs) | 48.8% | 37.3% | 81.8% |
| CASA | 19.4% | 20.7% | 21.0% |
| CD ratio | 92.5% | 92.8% | 98.2% |
| CRAR | 19.37% | 23.41% | 20.03% |
| RoA (annualised) | ~1.5% | ~0.8% | ~1.5% |
For ratio rows, the YoY and QoQ columns show the prior-period value. Sources: [1][2]
Quality of earnings
The YoY jump is flattered by a weak base. Q2 FY26 PAT was only ₹30.4 cr [1]. QoQ, profit was flat (+1.8%).
The core is improving. NII grew 43% YoY on 35% loan growth, and loan yield rose to 16.8% while cost of funds fell to 7.4% [2].
Three flags:
- Other income is volatile. Q1 included about ₹46 cr of income from selling priority-sector lending certificates (PSLC), which is seasonal [5]. Management guided only ₹10–15 cr a quarter for Q2–Q3 [4].
- Costs are rising fast. Opex is up 35% YoY. "Other operating expenses" rose 53% to ₹202 cr [1]. Cost-to-income, at ~71%, is high for a bank (my view).
- Tax. The rate rose to ~27% from ~23% a year ago (my calculation from [1]).
Asset quality (Chart 3) — read carefully
GNPA fell from 6.60% to 2.97% in one quarter [1]. This did not come from borrowers repaying. Most of the bank's microfinance loans are covered by CGFMU, a government credit guarantee. Once guarantee claims were received, the bad loans were written off [2]. The H1 cash-flow statement shows ₹596 cr of write-offs and ₹409 cr of claims received [1].
Meanwhile, net NPA actually rose QoQ, to ₹224 cr from ₹170 cr. PCR fell to 48.8% from 81.8% [1][2]. Of the ₹224 cr net NPA, ₹181 cr is still receivable from CGFMU [2].
Collection efficiency improved to 93.6%, from 85.3% a year ago [2].
NIM: 6.9% → n.a. → 7.9% → 7.2% → 7.2%. It is stable, and well below the ~9.8% of FY24 [12]. Part of that gap may be a change in calculation basis (interpretation).
Guidance: what changed
- FY27 guidance (Q1 call): ~30% advances growth, credit cost 0.8–1%, cost of funds ~7.5%, and an exit RoA of ~1.6% [4][5][6]. Q2 is close: RoA ~1.5%, advances +35%. Credit cost was ~1.1% annualised (my calculation), slightly above the range.
- Track record: for FY26, the bank initially guided an RoA of 1.5–1.6% [11] but delivered 1.1% [10]. Treat targets with some caution (my view).
- New lines: a digital banking push (credit line on UPI, secured credit cards). Customers nearly doubled to ~7 million [2].
- Board: investor director Ranjit Shah retires on 2 Nov after his 8-year term [1].
Positives
- Strong growth in loans (+35%) and deposits (+35%) [2]
- PAT in H1 FY27 (₹151.7 cr) already matches the whole of FY26 [2]
- CGFMU cover limits final losses on microfinance loans [2]
Concerns
- CASA falling (19.4%) and retail deposit share down to 84.5% [2]
- PCR down sharply; net NPA up QoQ [1]
- High cost-to-income and volatile other income [1][5]
- CRAR down ~400 bps YoY as growth consumes capital [1]
Things to track in Q3 FY27
- Credit cost vs the 0.8–1% guidance
- Fresh slippages, now that old bad loans are cleared
- CASA and retail deposit share
- Cost-to-income falling below 70%
Not a buy/sell recommendation. Facts are sourced; opinions are labelled.
Sources [1] NSE – Outcome of board meeting & unaudited results, 29 Oct 2026 · [2] NSE – Q2 FY27 press release, 29 Oct 2026 · [3] NSE – Q1 FY27 press release · [4] GuruFocus via Yahoo – Q1 FY27 call · [5] AlphaSpread – Q1 FY27 call summary · [6] NSE – Q1 FY27 call transcript · [7] AlphaStreet – Q3 FY26 · [8] 5paisa – Q4 FY26 · [9] Sahi – Q4 FY26 · [10] Suryoday – FY26 investor presentation · [11] Suryoday – Q1 FY26 call transcript · [12] ICICI Direct – FY24 results
Charts: (1) last 5 quarters NII & PAT; (2) FY23–FY26 NII & PAT; (3) NIM [2][3][8] (Q3 FY26 not found) and GNPA/NNPA [1][7][8].