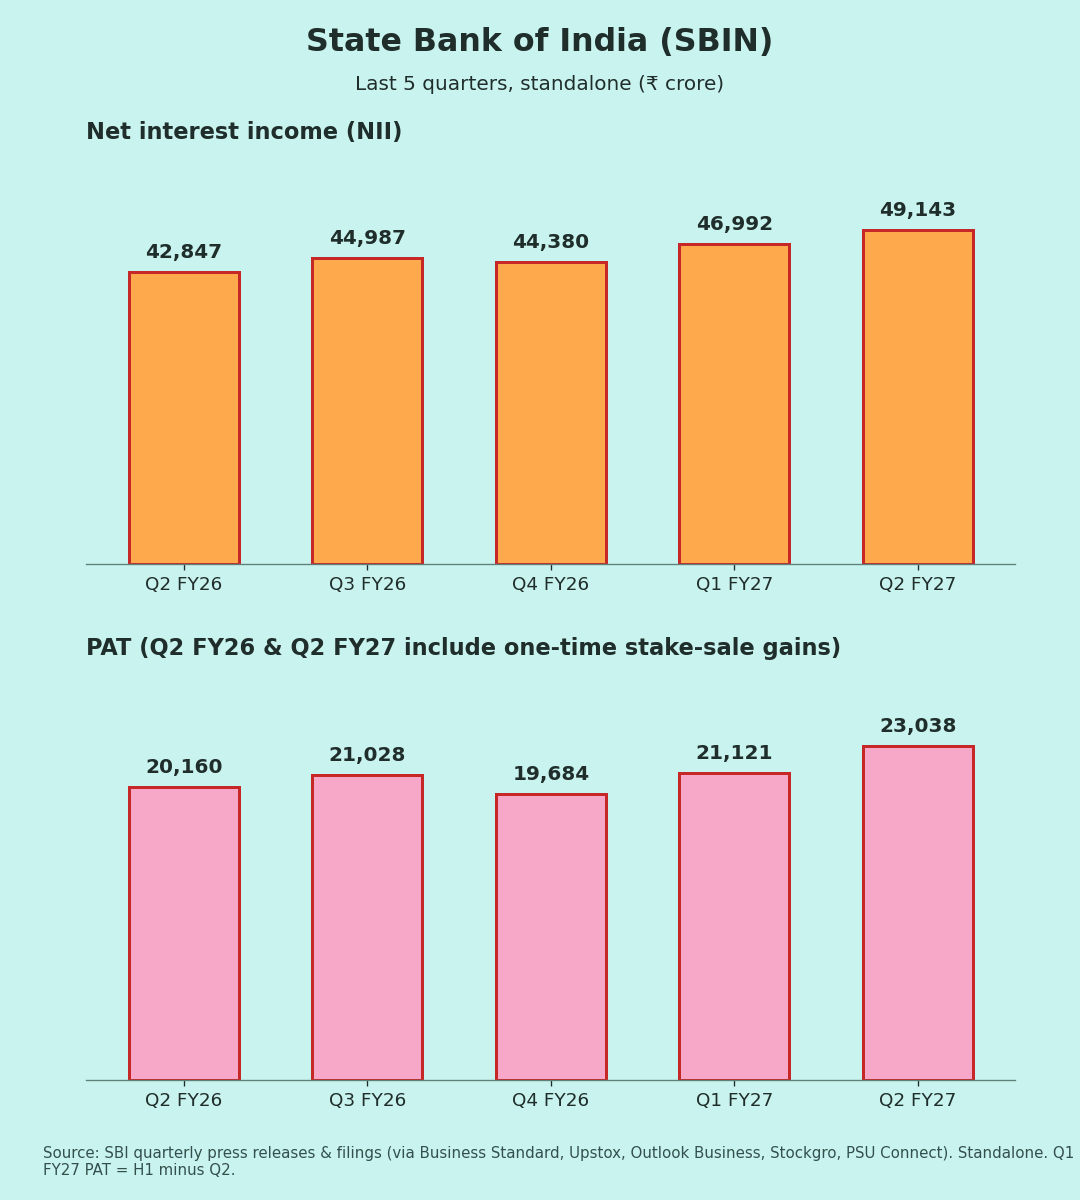
Standalone figures, ₹ crore unless stated. Results were declared on 3 Nov 2026 during market hours. YoY/QoQ % and some ratios are my calculations.
| Metric | Q2 FY27 | YoY | QoQ |
| NII | 49,143 | +14.7% | +4.6% |
| Domestic NIM | 3.11% | 3.08% | 3.00% |
| Whole-bank NIM | 2.94% | 2.97% | 2.86% |
| Operating profit (ex one-offs) | 26,937 | −1.4% | – |
| Provisions | 4,217 | −21.9% | −16.4% |
| Credit cost | 0.22% | 0.39% | – |
| PAT | 23,038 | +14.3% | +9.1% |
| GNPA / NNPA | 1.39% / 0.36% | 1.73% / 0.42% | 1.47% / 0.38% |
| PCR | 74.4% | 75.8% | – |
| Advances / deposits growth | +17.8% / +12.3% | – | – |
| CASA ratio | 38.3% | 39.6% | 39.2% |
| CD ratio | ~82% | ~78% | – |
| CRAR | 16.09% | 14.62% | – |
Ratio rows show the year-ago and last-quarter values.
Quality of earnings: separate the one-off
Both this quarter and the year-ago quarter include a one-time stake-sale gain:
- Q2 FY27: ₹7,288 cr pre-tax from selling 6.3% of SBI Funds Management [3][4]. That is about a quarter of PBT (my calculation).
- Q2 FY26: ₹4,593 cr from selling 13.18% of Yes Bank [9].
Excluding both, operating profit slipped 1.4% YoY (₹26,937 cr vs ₹27,310 cr) [3][10]. PBT before exceptional items rose about 4% (my calculation). So the 14% headline profit growth overstates the core trend.
What drove the core:
- Helped: NII grew 15%, and provisions fell 22% [1].
- Hurt: Other income fell 24% YoY to ₹11,777 cr [1].
- Stake gains outside the P&L: Gains from selling NSE and ARCIL stakes went to capital reserve under new RBI rules, so they are not in profit [4].
- Tax: The rate was a normal ~23% (my calculation from [3]).
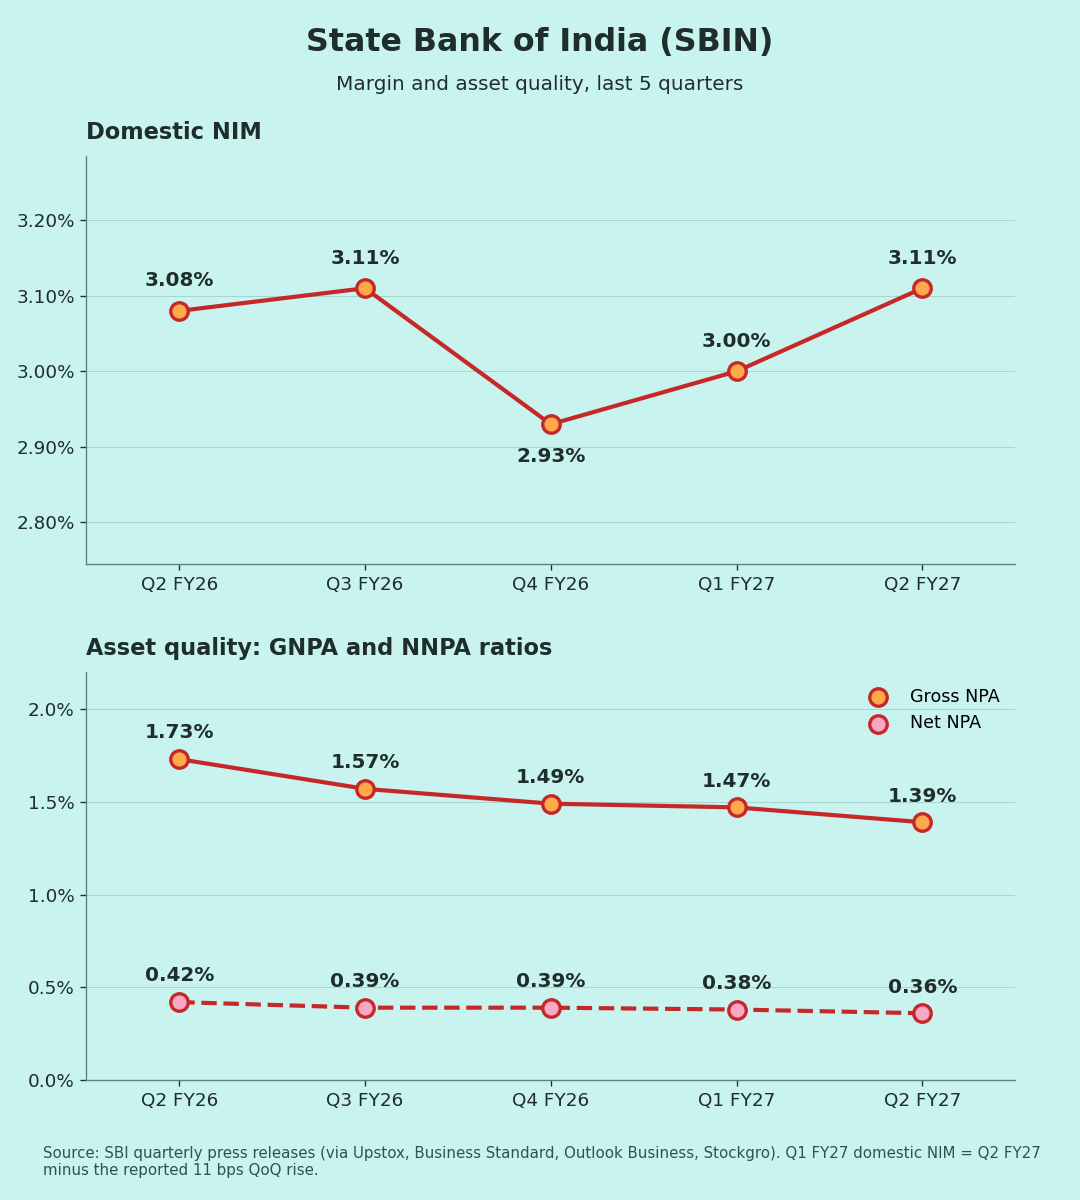
Margins and asset quality (Chart 3)
Domestic NIM over five quarters: 3.08% → 3.11% → 2.93% → 3.00% → 3.11% [2][6][11]. Margin has recovered fully from the Q4 FY26 dip.
GNPA fell steadily over the same period: 1.73% → 1.57% → 1.49% → 1.47% → 1.39% [1][6]. The slippage ratio improved to 0.41% [5].
Balance sheet
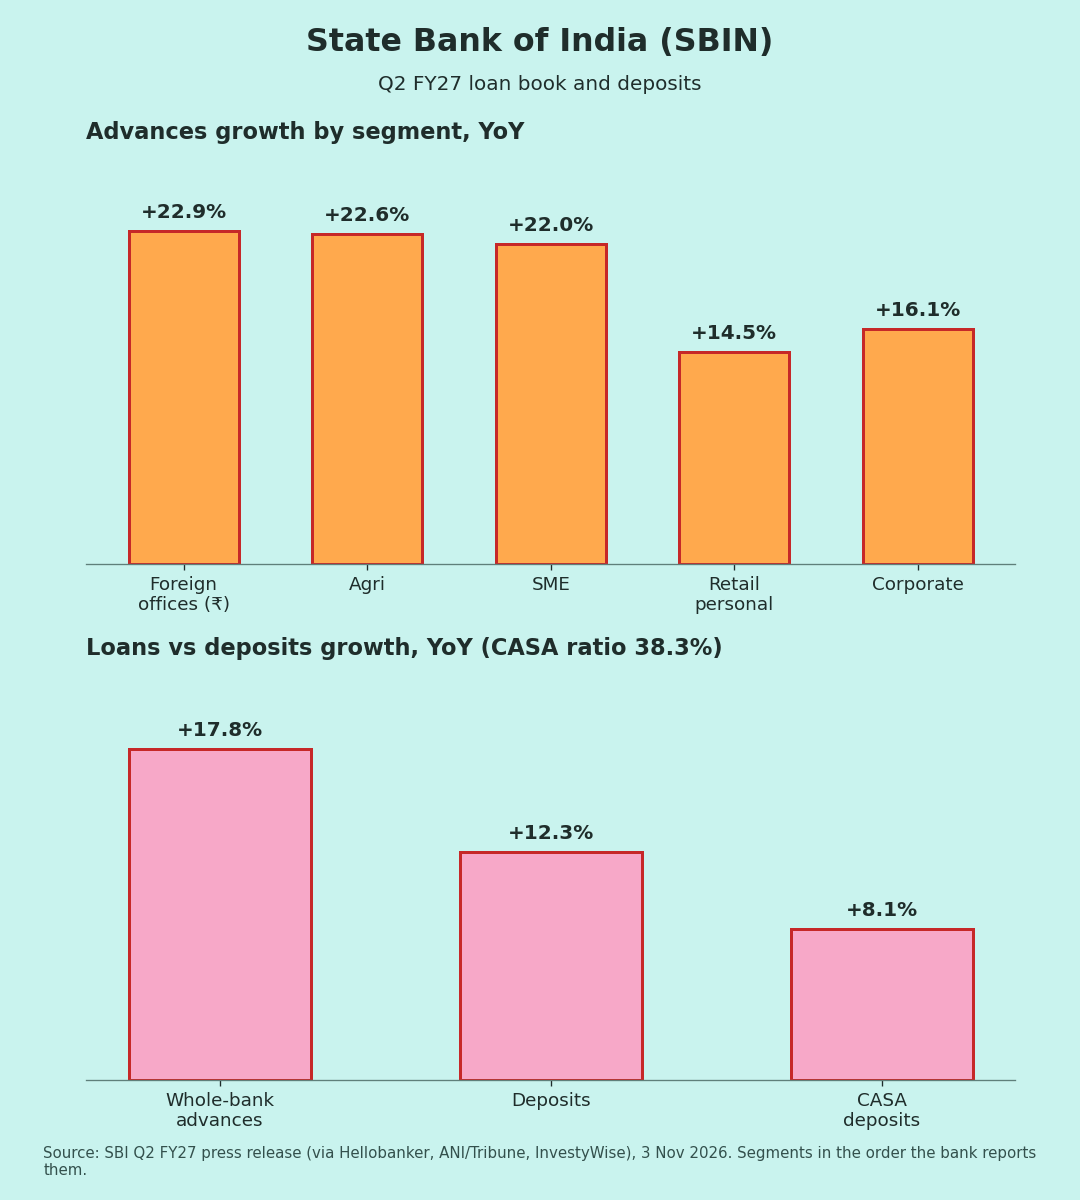
Loans are growing faster than deposits: +17.8% vs +12.3% [5]. Segment growth [7]:
- Foreign offices: +22.9% (in rupee terms)
- Agri: +22.6%
- SME: +22.0%
- Retail personal: +14.5%
- Corporate: +16.1%
The CASA ratio dipped to 38.3% [5], and the CD ratio rose to about 82% (my calculation from [1]).
Guidance: what changed
- May 2026 (Q4 call): FY27 credit growth 13–15%, credit cost about 50 bps, domestic NIM above 3% [12].
- August (after Q1): Credit growth raised to 14–16%; NIM guidance about 3% [13].
- Q2 so far: Loan growth (17.8%) is above the raised range. Credit cost (0.22%) is well below 50 bps. Domestic NIM (3.11%) is in line.
- This quarter's call: I found no coverage of management's comments yet. Readers who heard them, please add.
Positives
- NII +15% YoY and NIM back above 3% [1][2]
- GNPA at 1.39%, the lowest in this five-quarter series [1]
- CRAR up to 16.09% [3]
Concerns
- Core operating profit was flat to down YoY [3][10]
- Other income down 24% [1]
- Deposits lag loans; CASA share slipping [5]
- PCR slightly lower than a year ago [1][14]
Things to track in Q3 FY27
- Core operating profit, excluding stake-sale gains
- Deposit growth and CASA vs loan growth
- Domestic NIM holding above 3% after the October repo hike
- Credit cost vs the ~50 bps guidance
Not a buy/sell recommendation. Facts are sourced; opinions are labelled.
Sources [1] Business Standard – Q2 FY27, 3 Nov 2026 · [2] Upstox – Q2 FY27 live blog · [3] PSU Connect – filing highlights · [4] DSIJ – exceptional item & capital reserve · [5] InvestyWise – press release summary · [6] Outlook Business – Q4 FY26 · [7] Hellobanker – segment growth · [8] Multibagg – Q2 preview (whole-bank NIM history) · [9] Business Today – Q2 FY26 Yes Bank gain · [10] ScanX – Q2 FY26 operating profit · [11] Stockgro – Q3/Q4 FY26 table · [12] Indian Banking News – FY27 guidance, May · [13] Trade Brains – raised guidance · [14] Business Standard – Q2 FY26 analysis · [15] SBI IR – five-year financials · [16] SBI Q4 FY26 press release
Charts:
(1) last 5 quarters NII & PAT
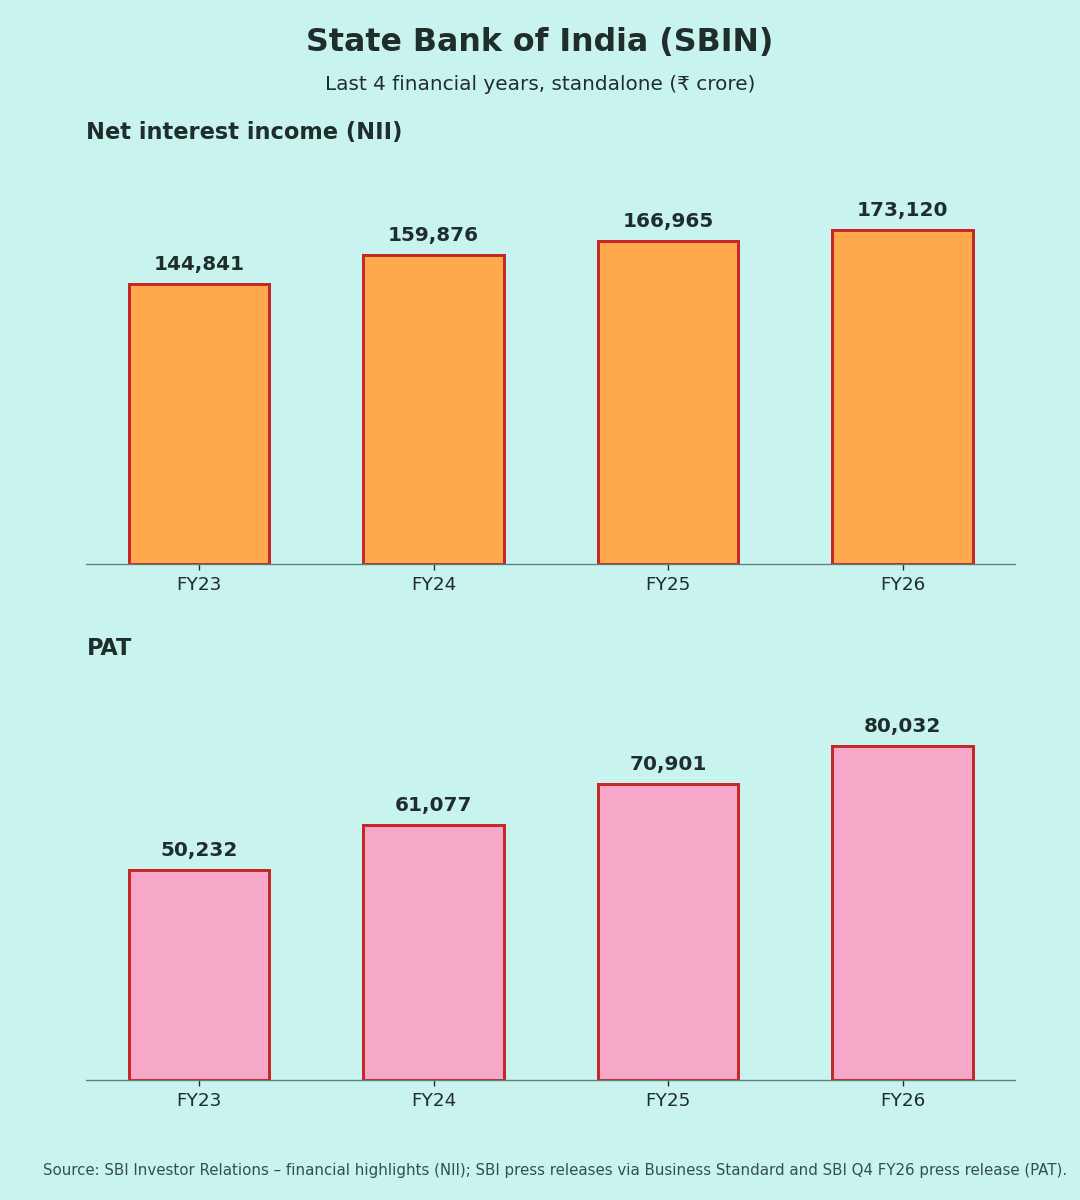
(2) FY23–FY26 NII & PAT
(3) domestic NIM and GNPA/NNPA
(4) segment growth and loans vs deposits