Charts:
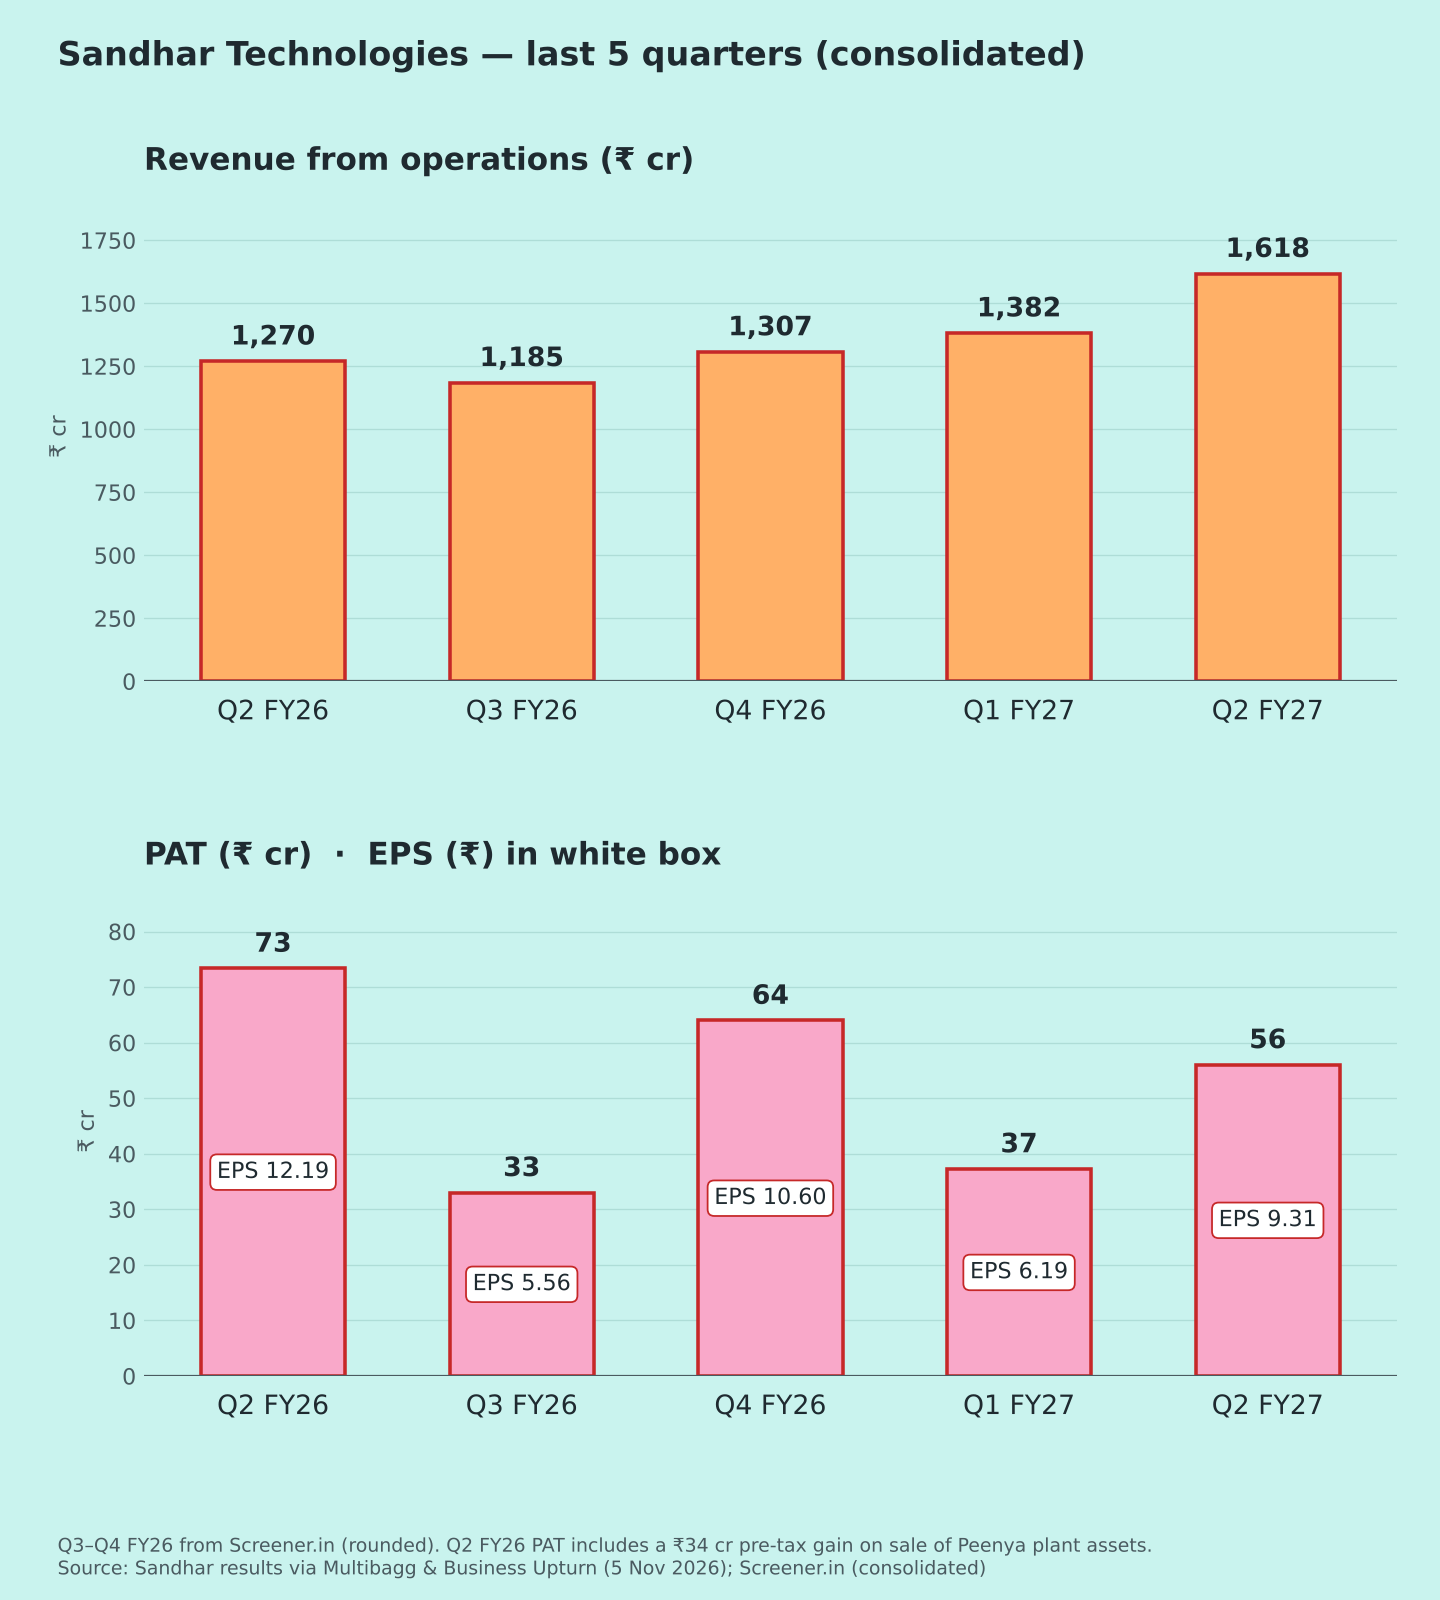
(1) 5 quarters revenue & PAT with EPS;
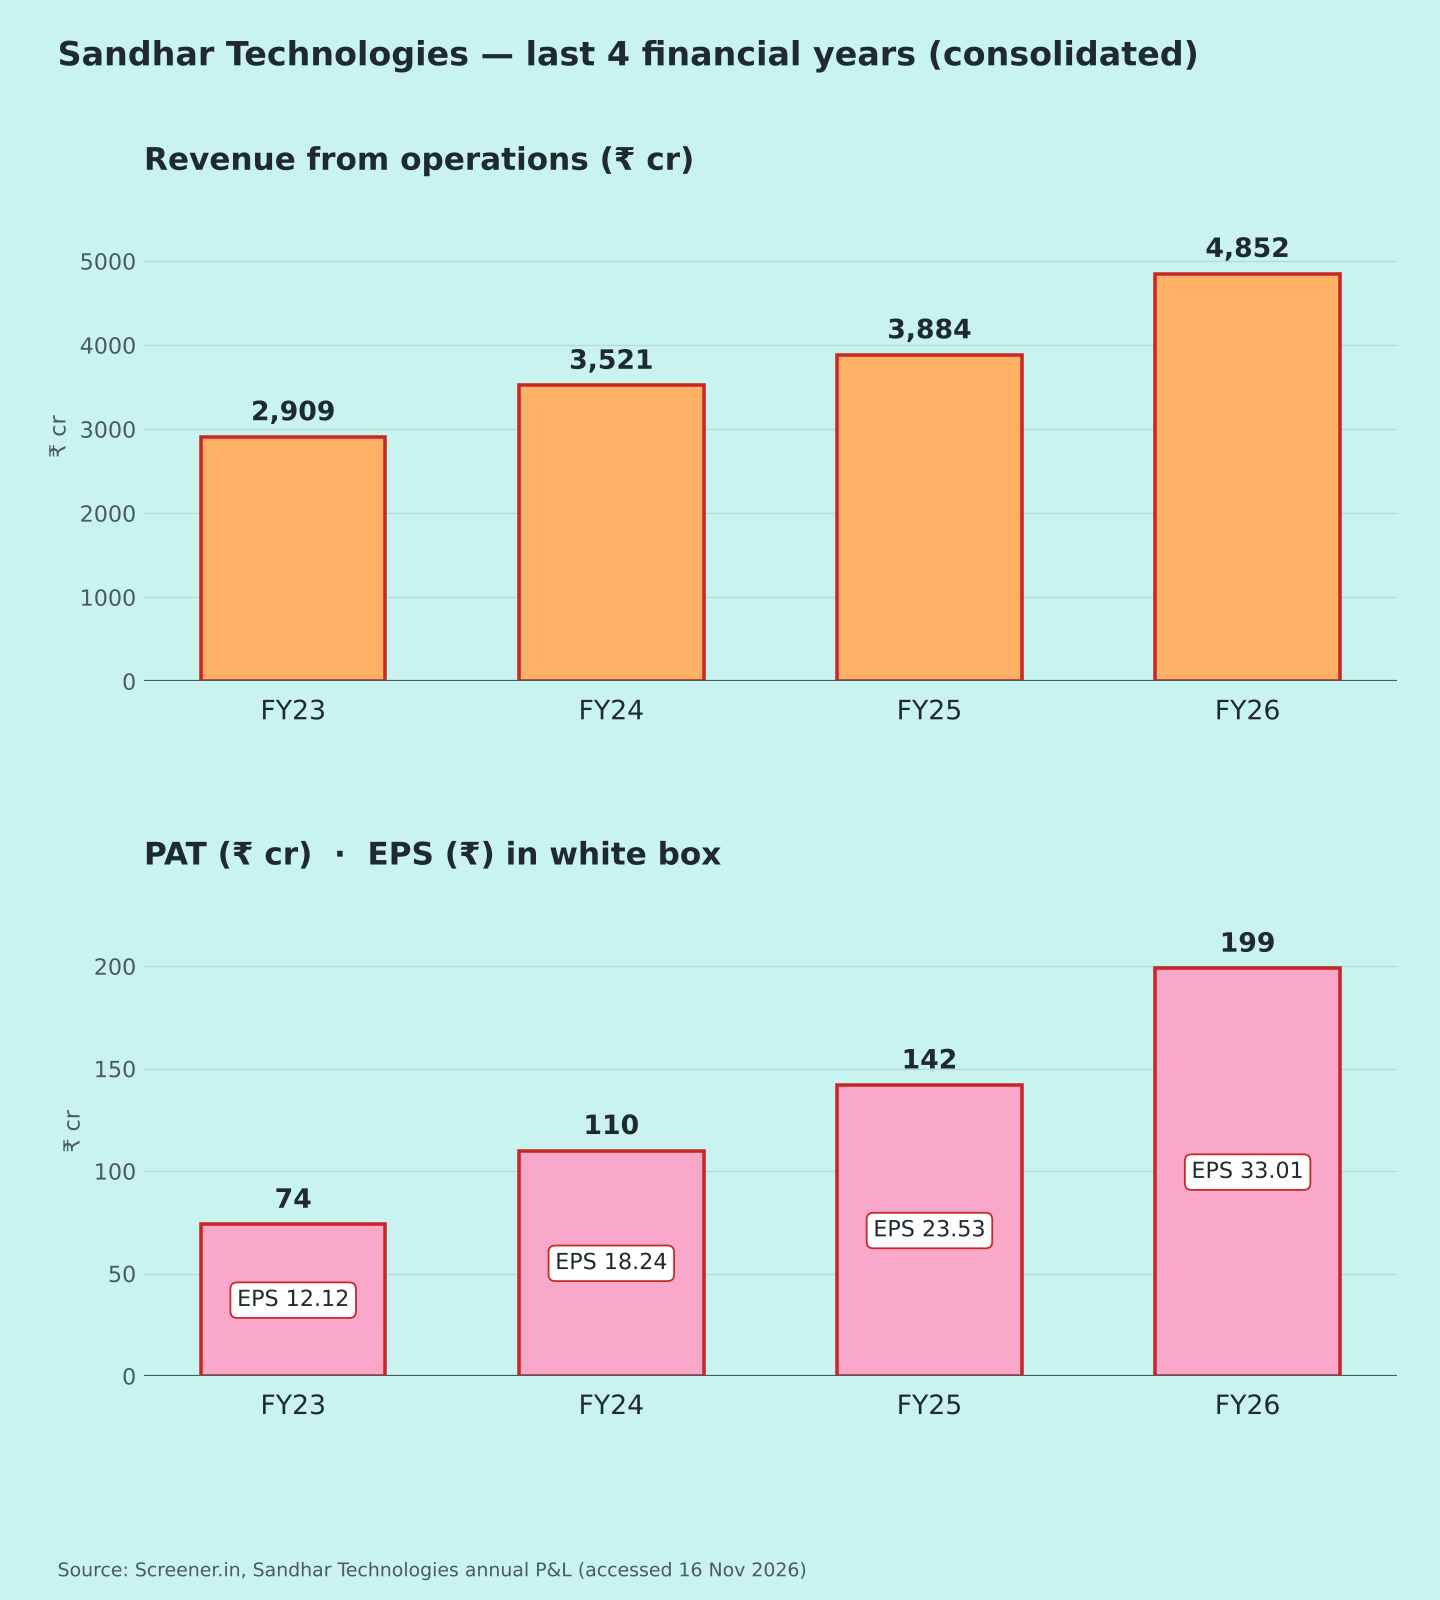
(2) FY23–FY26
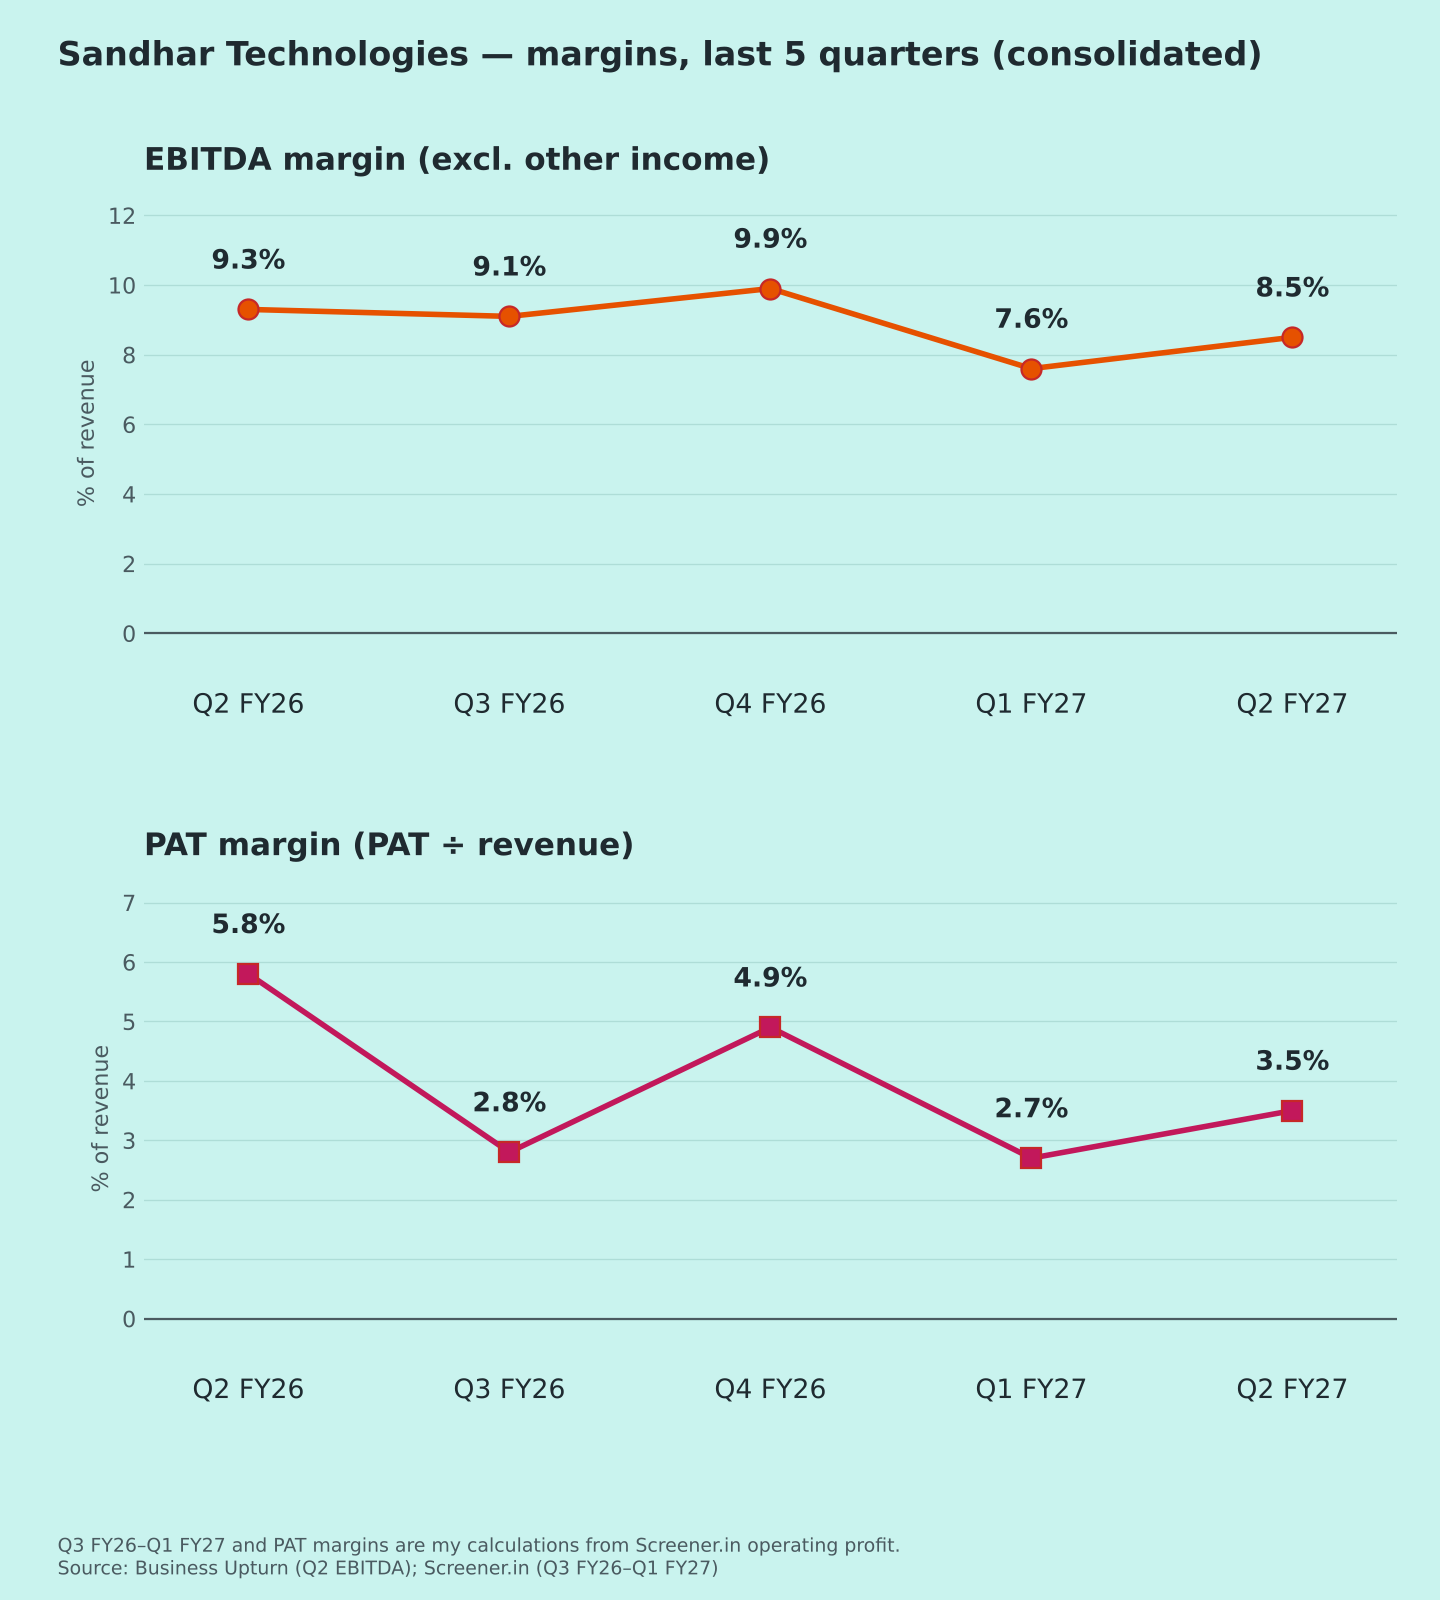
(3) margins
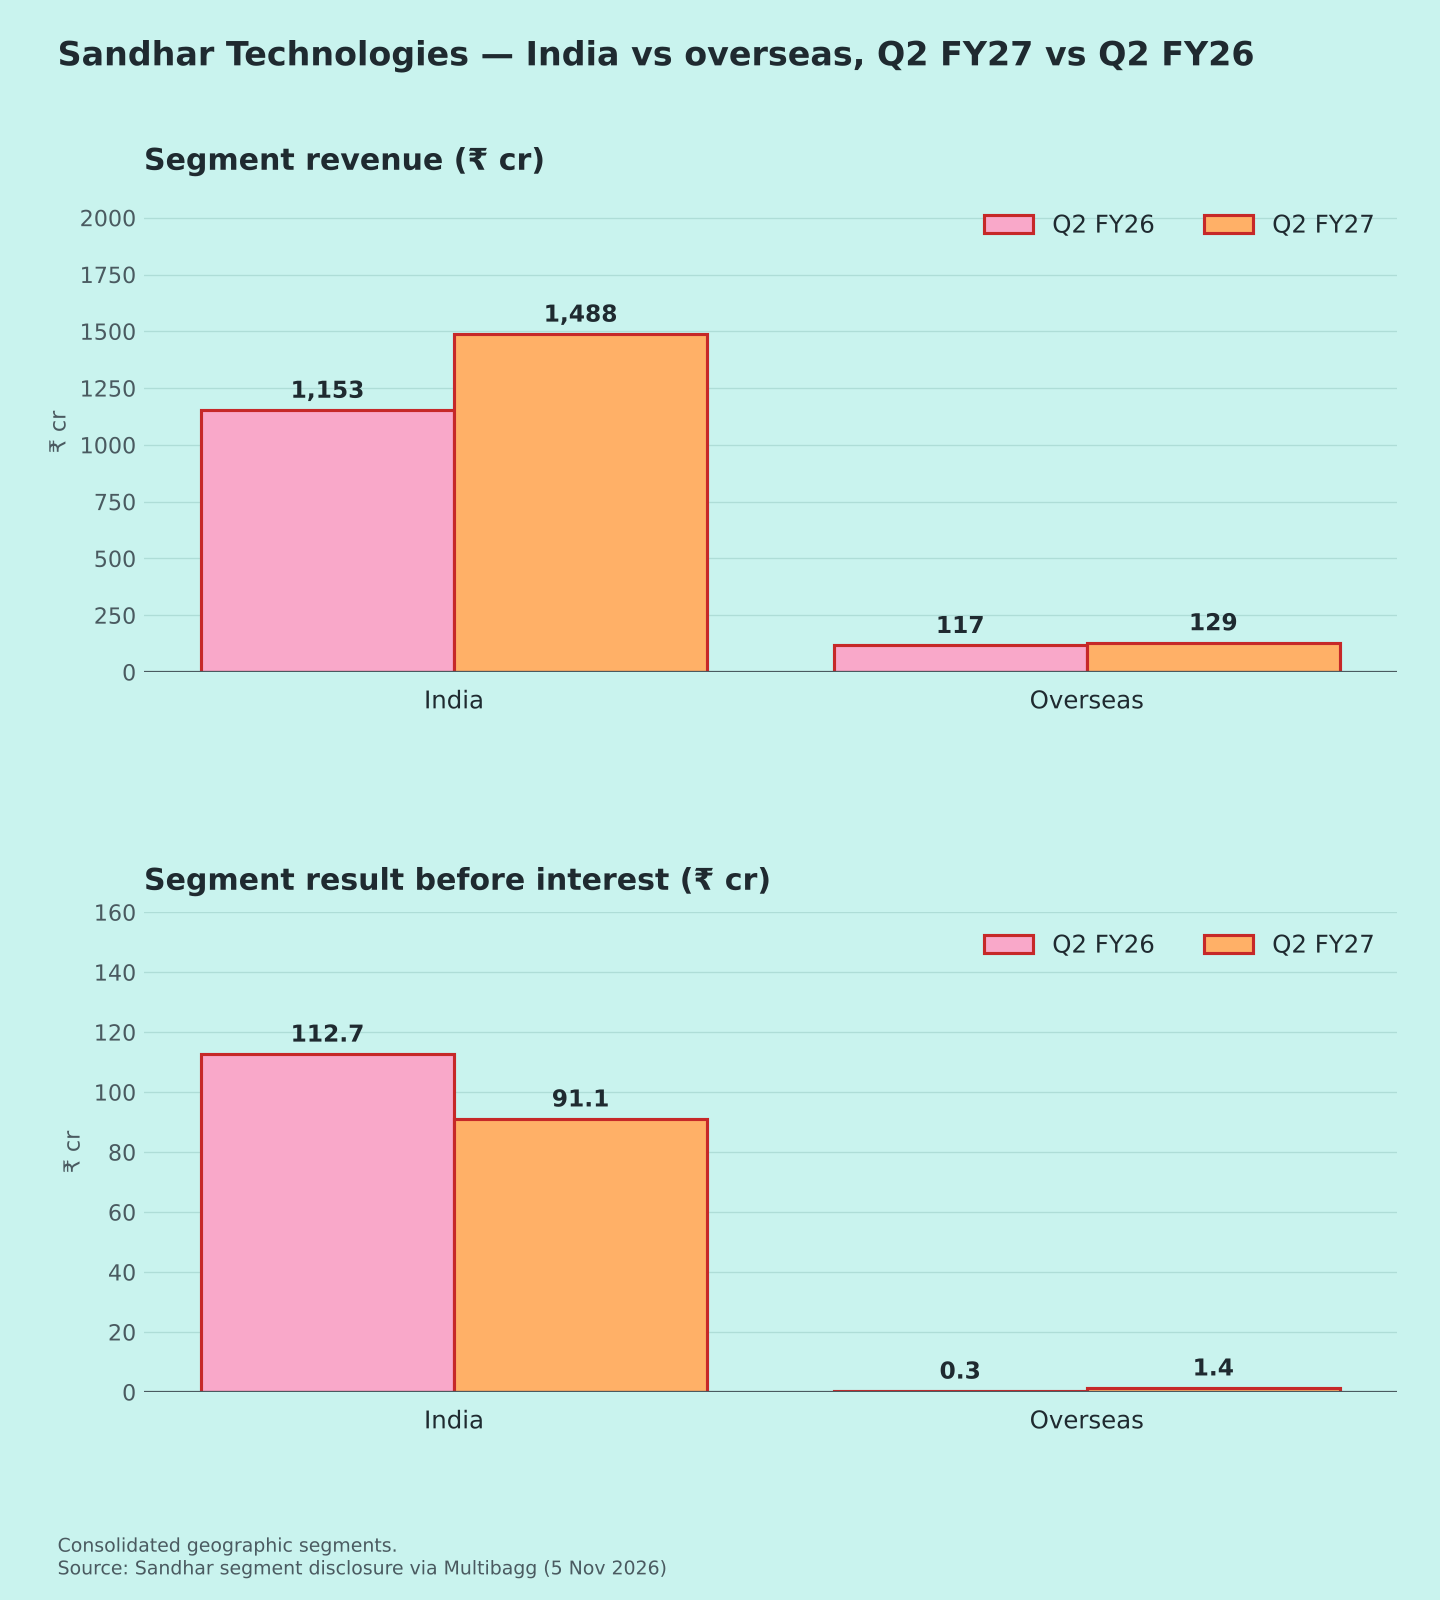
(4) India vs overseas
Consolidated figures, ₹ crore. Sandhar makes auto components (locks, mirrors, die-castings, sheet metal) mainly for two-wheelers. Results announced 5 Nov 2026; earnings call 16 Nov. PAT is total PAT (no attributable figure in coverage). EBITDA excludes other income. EPS as reported.
| Metric | Q2 FY27 | YoY | QoQ |
| Revenue from ops | 1,617.7 | ≈+27.3% | ≈+17.1% |
| EBITDA | 137 | ≈+16% | ≈+30% |
| EBITDA margin | 8.5% | 9.3% | ≈7.6% |
| Other income | 6.5 | 37.3 | 12.1 |
| PBT | 74.3 | ≈−22% | ≈+45% |
| PAT | 56.0 | ≈−23.6% | ≈+50.3% |
| PAT excl. one-offs (≈) | ≈58 | ≈+21% | — |
| EPS (₹) | 9.31 | 12.19 | 6.19 |
| Other income / PBT (≈) | ≈9% | ≈39% | ≈24% |
Margin, other income and EPS rows show year-ago and last-quarter values. ≈ = my calculation; one-offs adjusted at an assumed 25% tax rate.
Quality of earnings
- The fall in profit is mostly a base effect. Last year's Q2 included a ₹34 cr gain from selling assets at the Peenya plant [2]. Excluding it, last year's PAT was ≈₹48 cr; this year's, excluding a ₹2.8 cr one-time labour-code charge [2], was ≈₹58 cr, up ≈21% (my calculation).
- Revenue growth is strong: +27% vs ~21% for the industry, with two-wheeler business +33% [4]. Part of it is commodity price pass-through [4].
- Acquired vs organic unclear: the die-casting business bought from Sundaram-Clayton is being moved into one new plant [4], but its revenue contribution wasn't disclosed.
- Margins squeezed: aluminium costs rose 3–4% with about a one-quarter lag in passing them on; minimum-wage increases added about ₹13 cr in H1; new plants and overseas units are still loss-making [4]. Depreciation rose to ≈₹52 cr from ≈₹44 cr [5].
Margins (Chart 3)
EBITDA margin: 9.3% → 9.1% → 9.9% → 7.6% → 8.5% [1][5] (my calculation for Q3–Q1).
Segments (Chart 5) [2]
- India: ₹1,488 cr (+29%), segment result ₹91 cr (vs ₹113 cr).
- Overseas: ₹129 cr (+10%), result ₹1.4 cr.
Guidance [4]: full-year operating EBITDA margin about 9.0–9.35%, with improvement in H2 as price recoveries come through. H1 margin was about 8.1% on this table's basis (my calculation), so H2 needs a clear step-up. Earlier guidance wasn't in coverage.
Positives
- Revenue +27%, ahead of industry [4]
- Core profit up ≈21% (my calculation)
Concerns
- Margin below 9% [1]
- Debt rising: short-term borrowings ₹744 cr vs ₹683 cr in March [2]
- Loss-making new projects [4]
Things to track in Q3 FY27
- EBITDA margin vs 9% guidance
- Sundaram-Clayton plant integration
- Aluminium cost pass-through
- Borrowings and capex
Not a buy/sell recommendation. I am not a SEBI-registered analyst. Facts are sourced; opinions are labelled.
Sources [1] Business Upturn – Q2 results · [2] Multibagg – Q2 results · [3] Kalkine – results filing · [4] Investing.com – call transcript · [5] Screener.in – consolidated · [6] Multibagg – results summary
Source note: the call transcript summary mentions an EBITDA margin of 10.2% for Q2 [4]; the reported figures (₹137 cr on ₹1,617.68 cr) give 8.5% [1]. Kalkine's H1 FY26 revenue (₹2,026 cr) also differs from Multibagg's ₹2,360 cr [2][3]. Please verify.