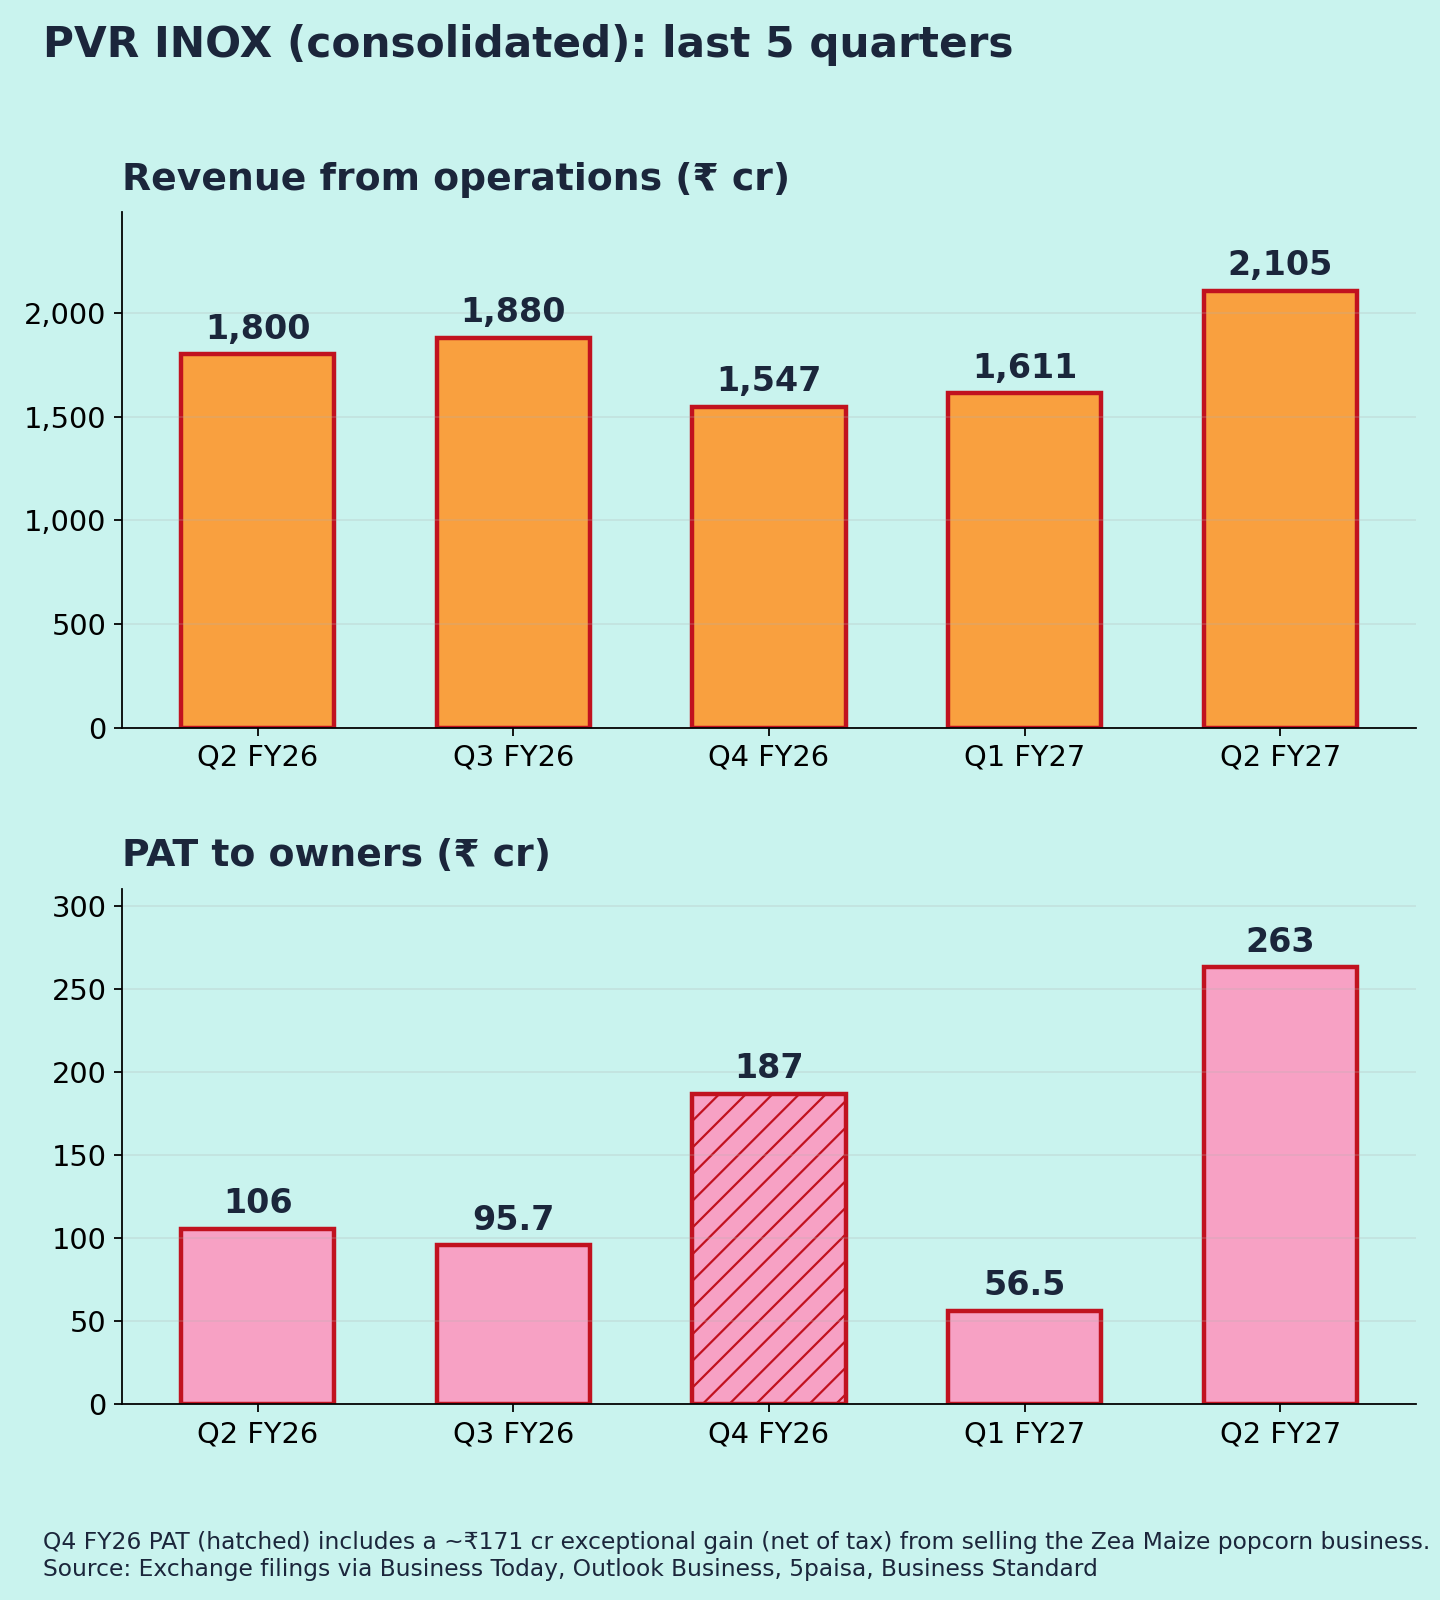
All figures consolidated, ₹ crore unless stated. The board approved results during market hours on 28 Oct 2026. YoY/QoQ % and margins are my calculations from reported numbers.
| Metric | Q2 FY27 | YoY | QoQ |
| Revenue from ops | 2,105.1 | +17.0% | +30.7% |
| EBITDA (reported, with Ind AS 116) | 769 | +25.0% | ~+46% |
| EBITDA margin (reported) | 36.5% | 34.2% | ~32.6% |
| PAT to owners | 263.1 | +149% | 4.7x |
| PAT margin | 12.5% | 5.9% | 3.5% |
| Other income | ~34 | ~flat | – |
For margin rows, the YoY and QoQ columns show the prior-period value. Q1 FY27 EBITDA is derived from a reported margin. Other income = total income minus revenue [2].
Source note: some outlets report ₹273 cr profit and ₹2,133 cr total income [4]. These differ from the consolidated owners' figure of ₹263.1 cr in the filing coverage [1][2]. I use ₹263.1 cr.
Quality of earnings
This was a content-driven quarter:
- Box office: the company called it the "highest-ever quarterly revenue" [2].
- Spending per visit: ticket sales grew 18.0% and food & beverage 18.3% [4].
- Cash: H1 free cash flow was ₹604 cr [4]. A ₹303 cr share buyback was completed [6].
Other income is small, so the profit growth is operational.
Two cautions:
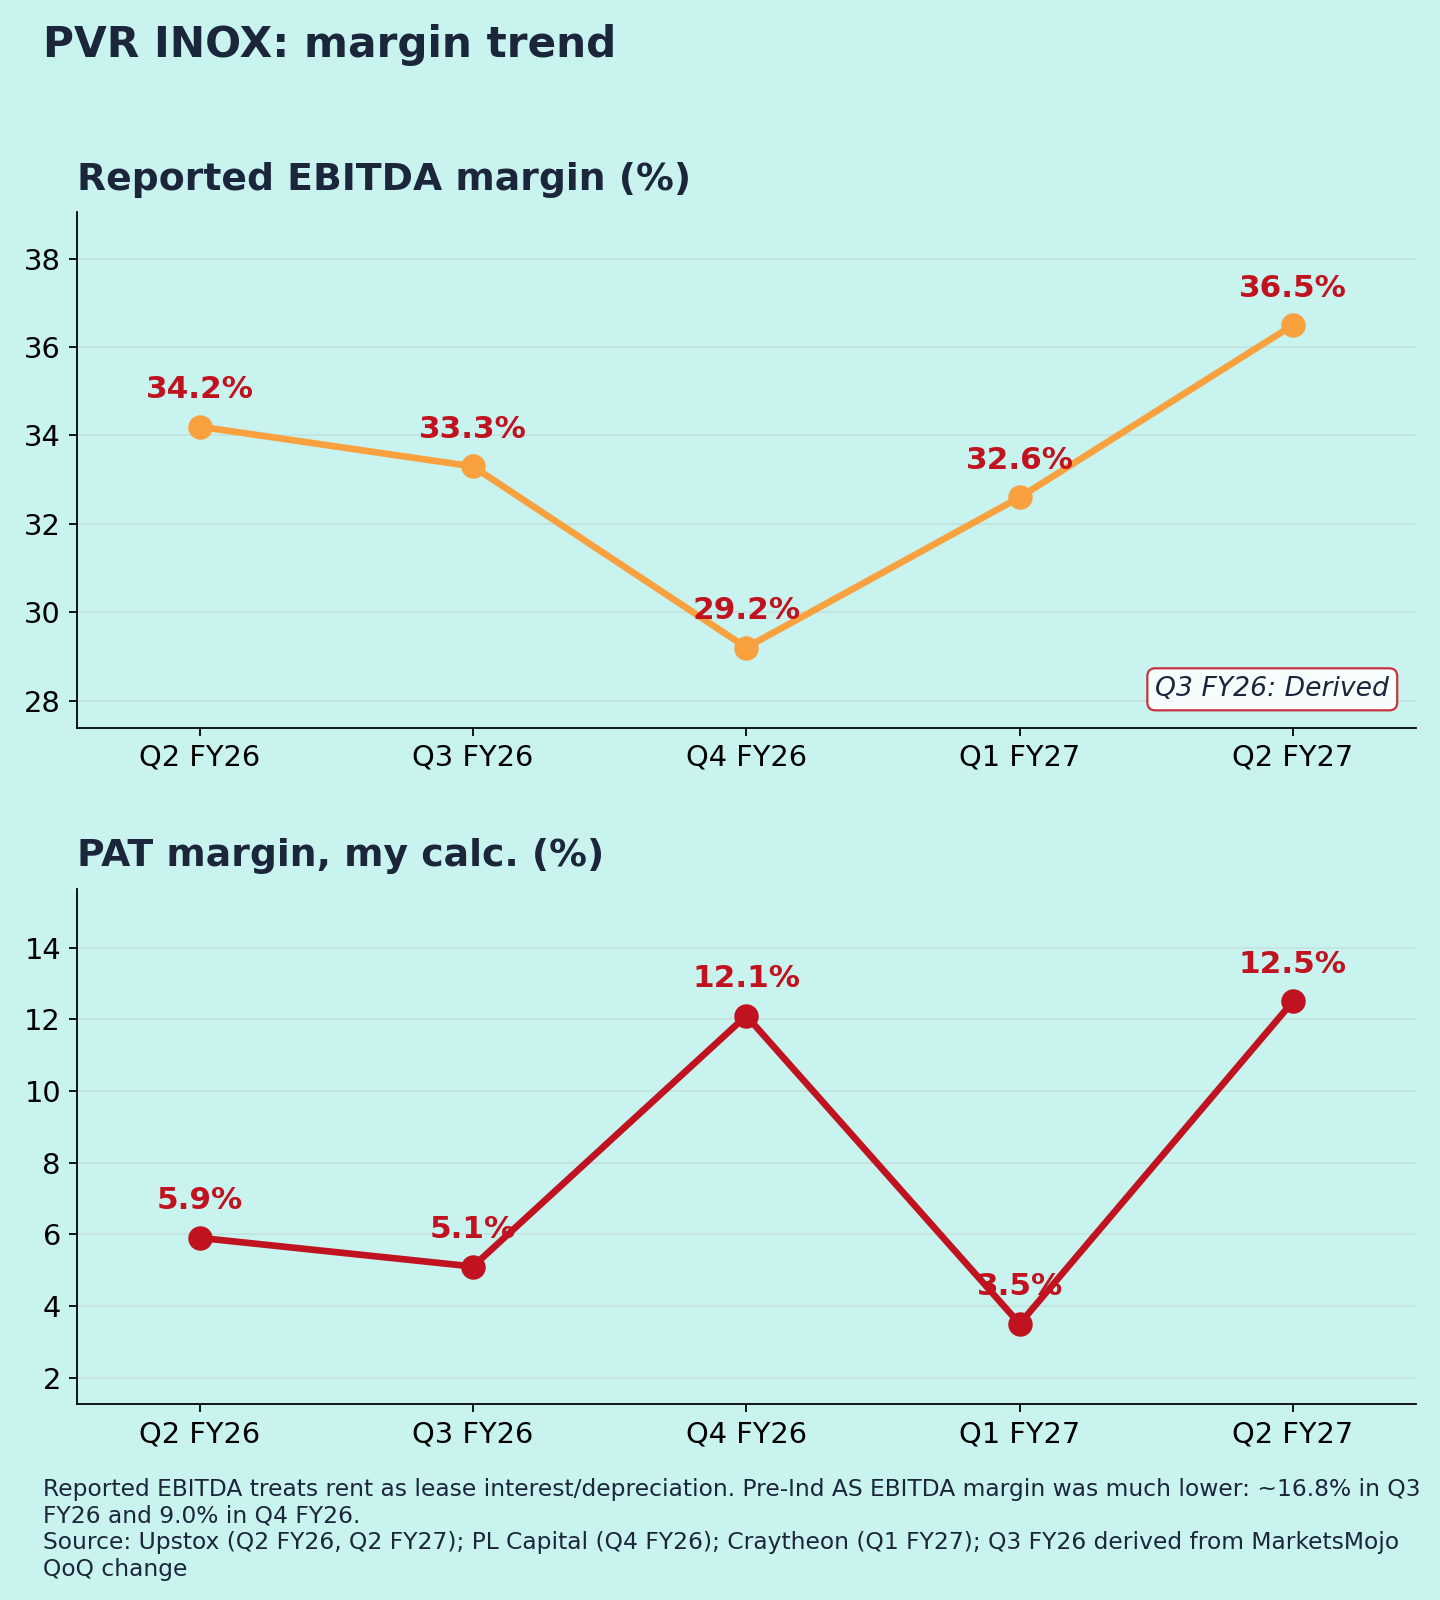
- Reported EBITDA flatters margins. Under Ind AS 116, rent is shown as lease interest and depreciation, not as an expense. On a pre-Ind AS basis (rent included), the margin was only ~16.8% in Q3 FY26 and 9.0% in Q4 FY26 [7][8]. The Q2 pre-Ind AS figure wasn't in the coverage I found.
- Base effect: Q1 FY27 was a weak content quarter (PAT ₹56.5 cr) [3], so 4.7x QoQ is flattered. Q4 FY26 PAT also included a ~₹171 cr one-off gain from selling the popcorn business (Zea Maize) [8].
Margins (Chart 3)
Reported EBITDA margin over five quarters: 34.2% → ~33.3% → 29.2% → ~32.6% → 36.5%. Cinema margins follow the film slate. Fixed costs (rent, staff) don't fall in weak quarters, so profit swings much more than revenue (interpretation).
Guidance and what changed
- Screens: about 100 new screens planned for FY27 [10], mostly capital-light (FOCO and asset-light models) [8]. There were 1,797 screens at end-September [1].
- Balance sheet: net debt was down to about ₹162 cr by March 2026, from ₹952 cr a year earlier [8].
- Content pipeline: Ramayana: Part One (5 Nov) and Avengers: Doomsday (17 Dec) [4].
- No new numeric margin guidance in the coverage I found.
Market reaction (interpretation)
The stock rebounded about 8% from its day's low on 28 Oct, touching ₹1,516.65 (+3.8%). The market seems to have rewarded the record quarter and the strong film pipeline.
Positives
- Record revenue; profit up 2.5x
- Near-zero net debt; buyback done
- Shift to a capital-light model for new screens
Concerns
- Earnings depend on hit films; Q1 showed how weak a lean slate can be [3]
- Pre-Ind AS margins are much thinner than reported EBITDA [7][8]
- Footfall growth has lagged ticket price growth (Q4 FY26: footfalls +2%, ATP +22%)
Things to track in Q3 FY27
- Box office of the Nov–Dec releases
- Pre-Ind AS EBITDA margin
- Footfalls vs price increases
- Screen openings under the capital-light model
Not a buy/sell recommendation. Facts are sourced; opinions are labelled.
Sources [1] Upstox, 28 Oct 2026 · [2] Business Standard/PTI · [3] Business Today, 28 Oct · [4] Indian Television · [5] Kalkine – board meeting filing · [6] Whalesbook – buyback · [7] Trendlyne – broker notes (Q3 FY26 pre-Ind AS EBITDA) · [8] PL Capital – Q4 FY26 · [9] Craytheon – Q1 FY27 · [10] Outlook Business – Q4 FY26 · [11] AskFuzz – Q4 FY26 · [12] Free Press Journal – FY26 · [13] Goodreturns – FY24 · [14] Outlook Business – Q3 FY26 · [15] MarketsMojo – quarterly
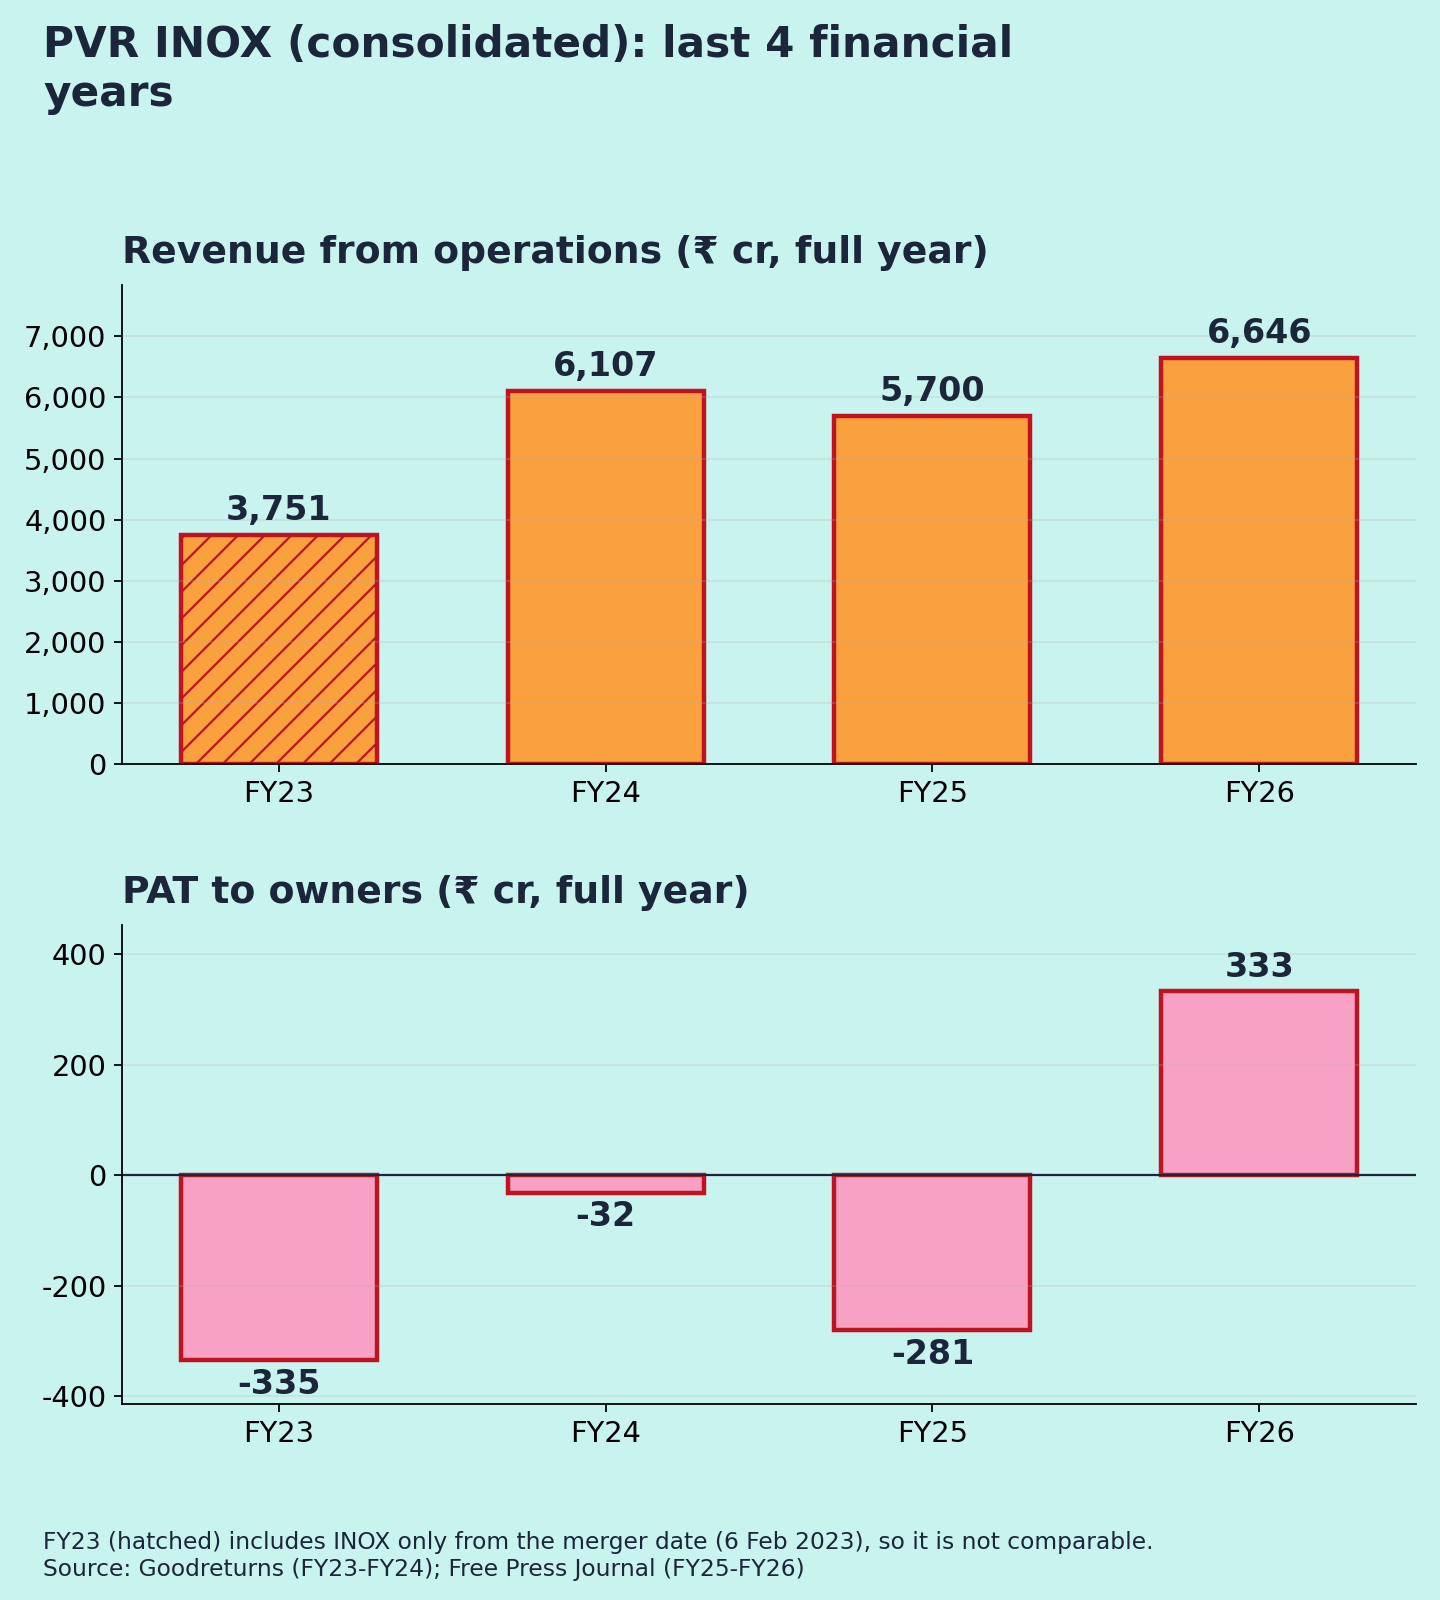
Charts: (1) last 5 quarters revenue & PAT [2][3][10][14]; (2) FY23–FY26 revenue & PAT [12][13] (FY23 is part-merged); (3) reported EBITDA margin [1][8][9][15] (Q3 FY26 derived) and PAT margin (own calc.).