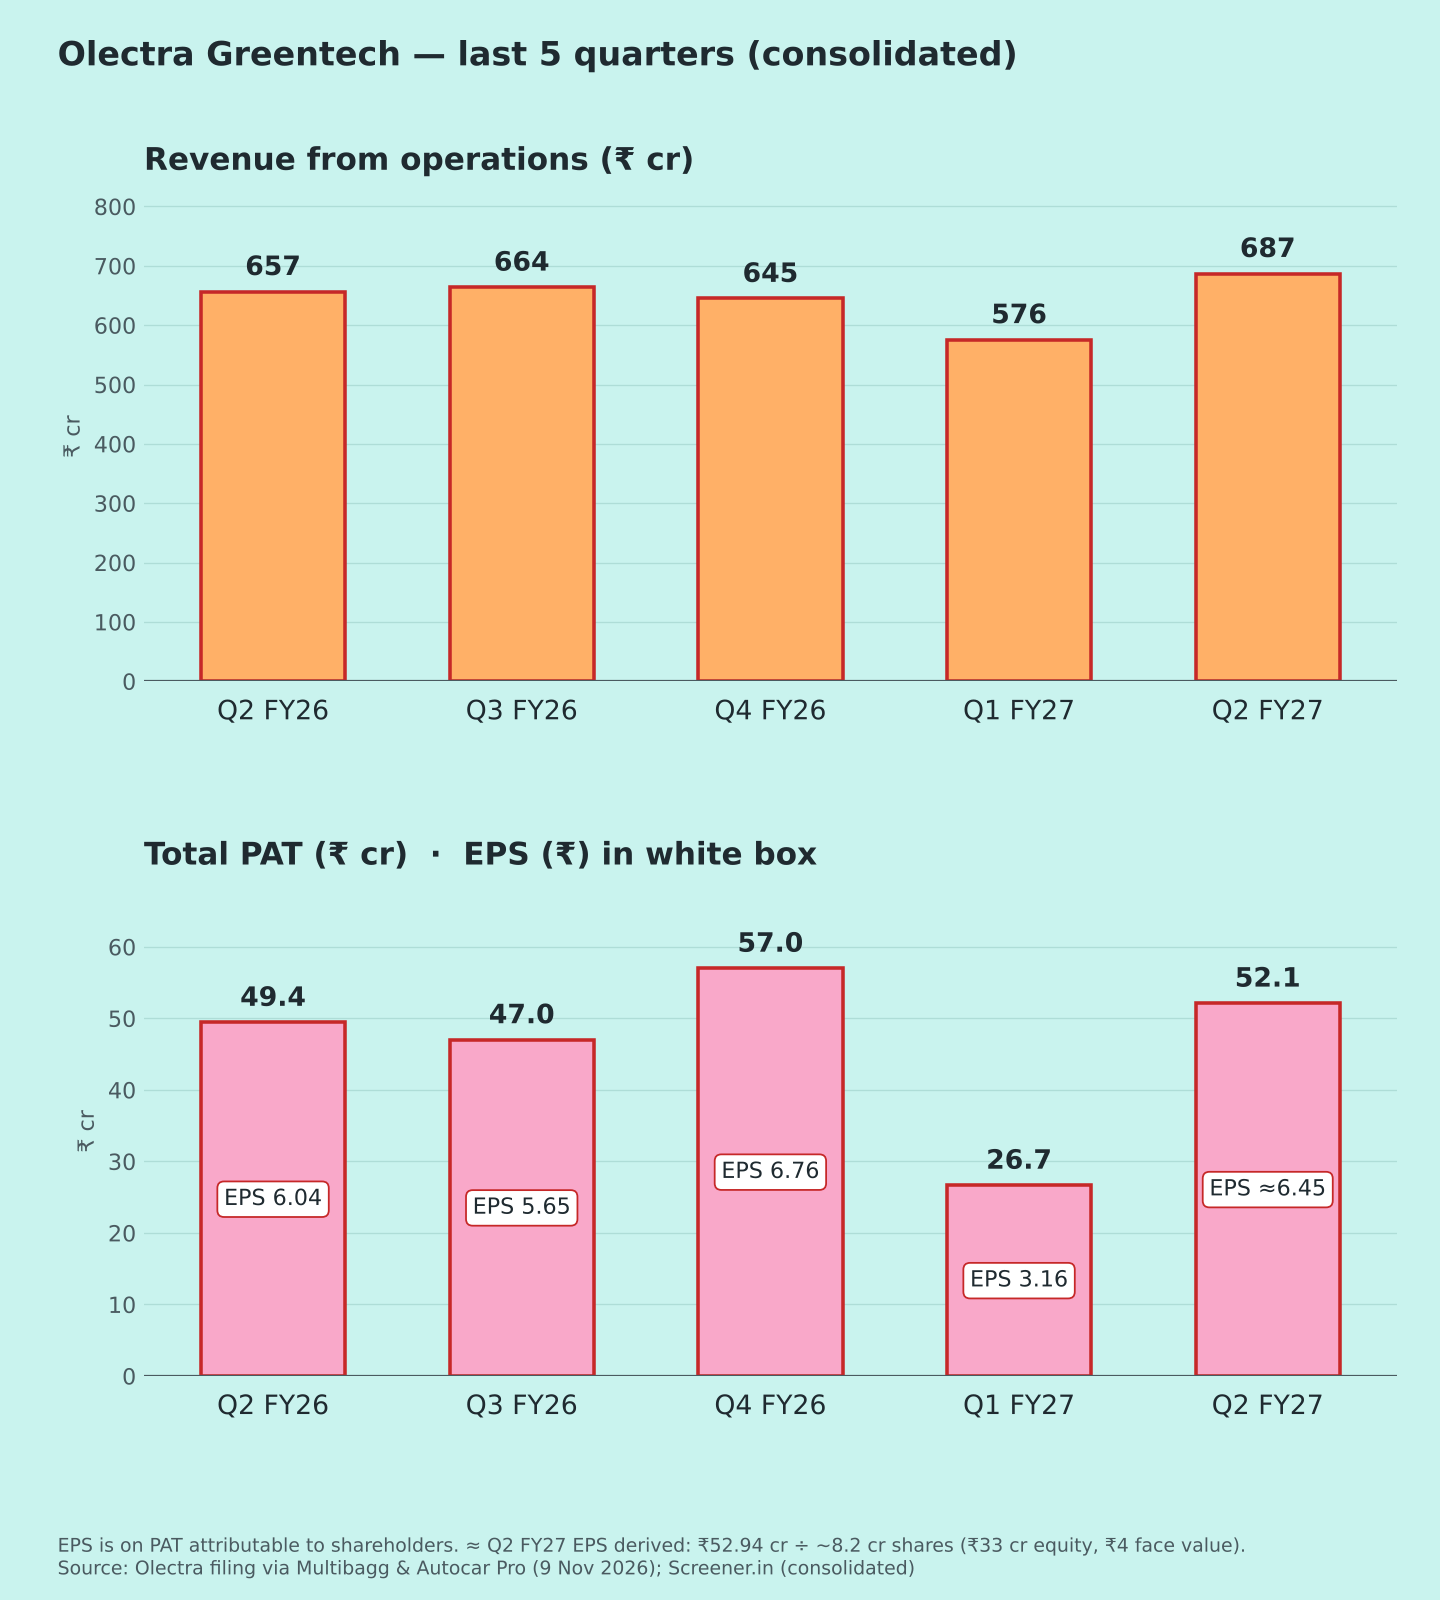
Consolidated figures, ₹ crore. Results announced 9 Nov 2026. "Total PAT" includes minority interest; EPS is on PAT attributable to shareholders. The company's EBITDA (₹109.88 cr) includes other income; I also show it excluding other income. Reported EPS wasn't in coverage, so it is derived.
| Metric | Q2 FY27 | YoY | QoQ |
| Revenue from ops | 687.0 | +4.6% | +19.4% |
| EBITDA excl. other income (≈) | ≈94.9 | ≈+7% | ≈+40% |
| EBITDA margin excl. other income (≈) | ≈13.8% | 13.6% | 11.8% |
| Other income | 15.0 | vs 4.3 | vs 2.1 |
| PBT | 72.7 | +6.3% | +110% |
| Total PAT | 52.1 | +5.4% | +95.5% |
| PAT to shareholders | 52.9 | +6.8% | +104% |
| EPS (₹, ≈ derived) | ≈6.45 | 6.04 → ≈6.45 | 3.16 → ≈6.45 |
| Other income / PBT | 20.6% | 6.3% | 6.2% |
Margin and ratio rows show year-ago and last-quarter values. ≈ derived: EBITDA excl. other income = ₹109.88 cr − ₹15.02 cr; EPS = ₹52.94 cr ÷ ~8.2 cr shares. Earlier quarters use Screener operating profit [6]. % changes are my calculations. Sources: [1][2][6]
Source notes: Headlines differ: "+7%" [2] uses PAT to shareholders, "+5%" [1] uses total PAT. InvestyWise's "117% growth" [4] compares against the wrong base (Q1, not last year). Please ignore it.
Quality of earnings
- Other income drove the profit growth. Other income jumped to ₹15.0 cr from ₹4.3 cr [1]. Excluding it, PBT fell about 10% (₹57.7 cr vs ₹64.1 cr, my calculation).
- Interest costs rose sharply: finance cost was ₹22.1 cr vs ₹13.8 cr [1].
- Volumes: revenue grew only 4.6%, with bus deliveries at 401 vs 375 (+7%) [3]. So profit grew without much revenue growth.
- QoQ looks strong because Q1 was weak (358 deliveries, PAT ₹26.7 cr) [1][3].
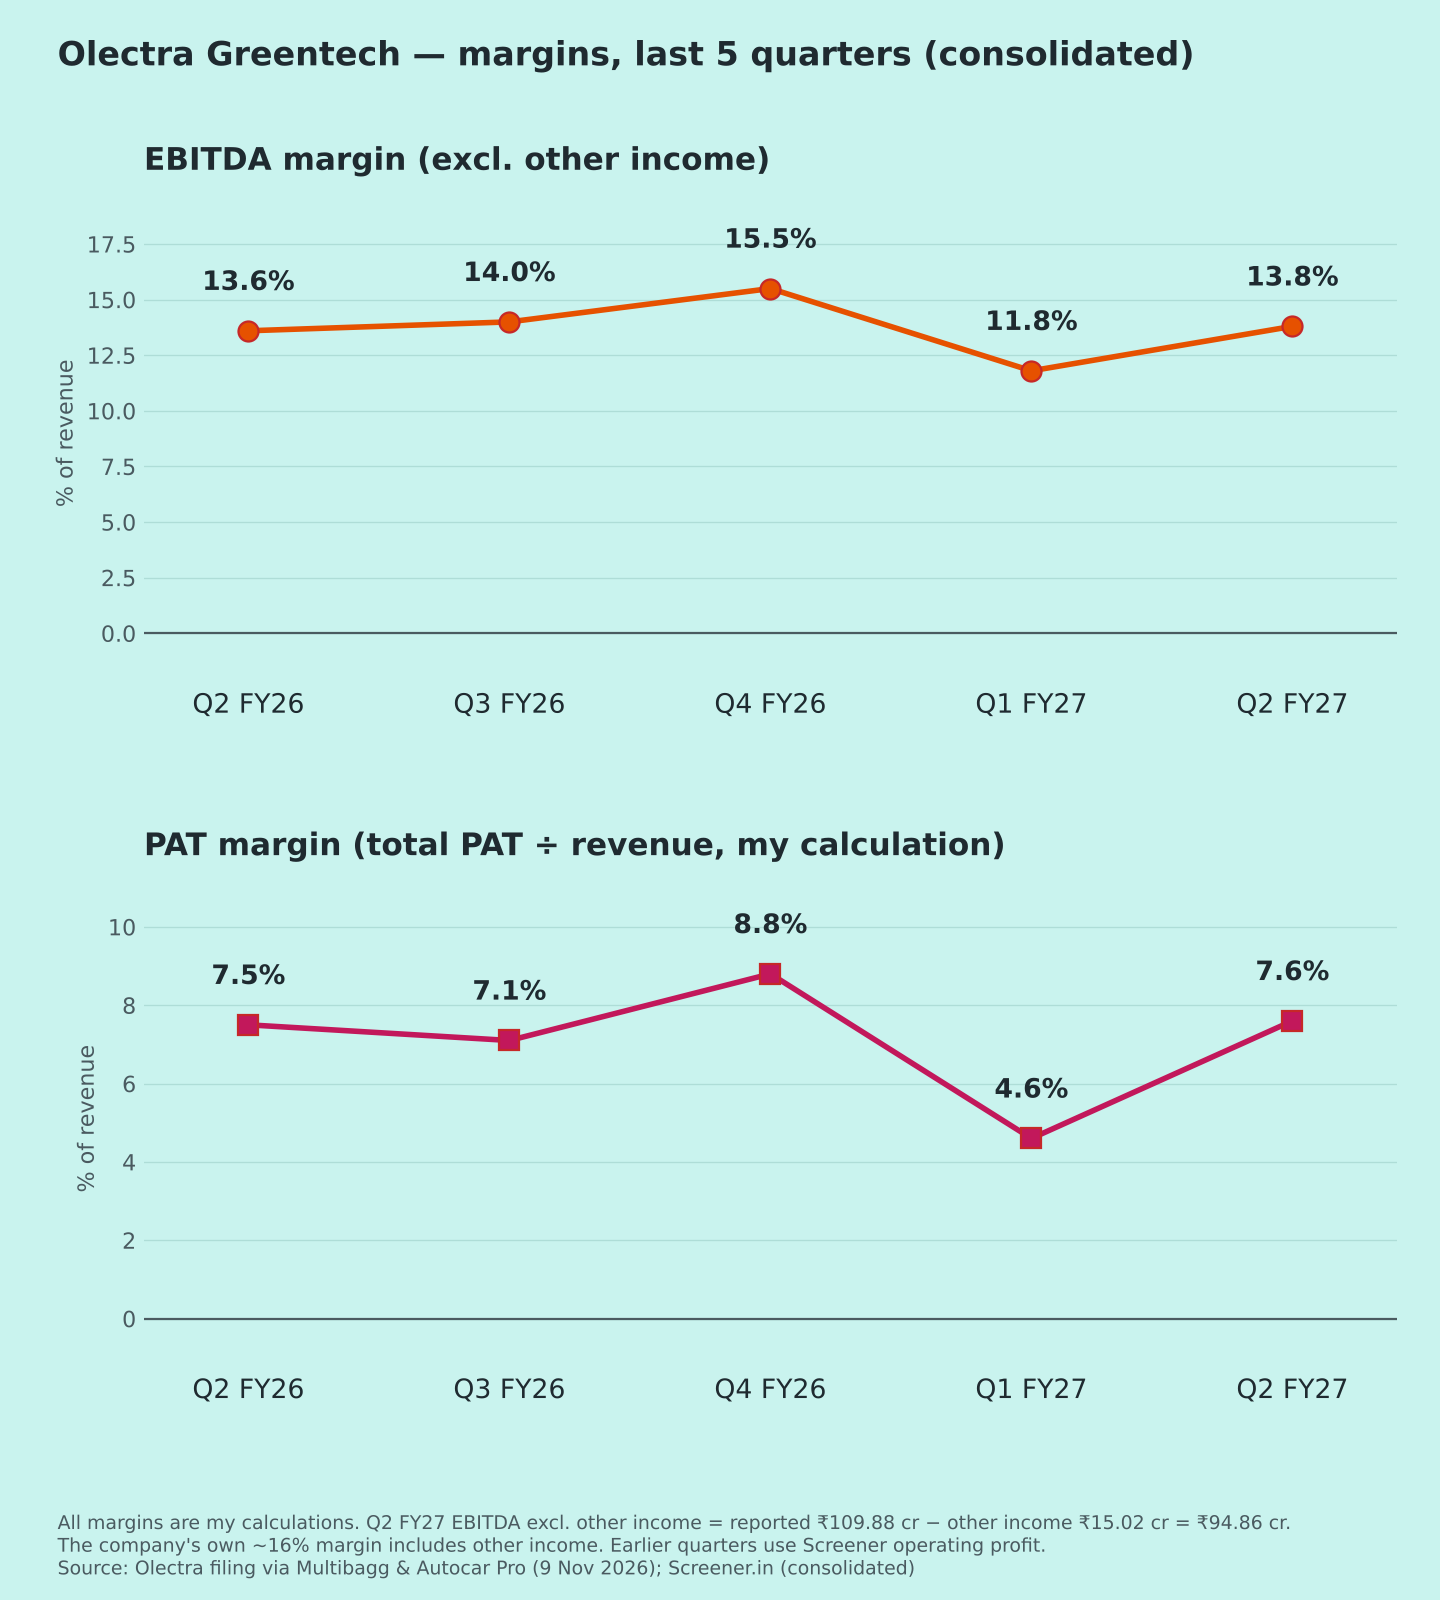
Margins (Chart 3)
EBITDA margin excluding other income: 13.6% → 14.0% → 15.5% → 11.8% → 13.8% (my calculation). The company's own ~16% figure includes other income [3].
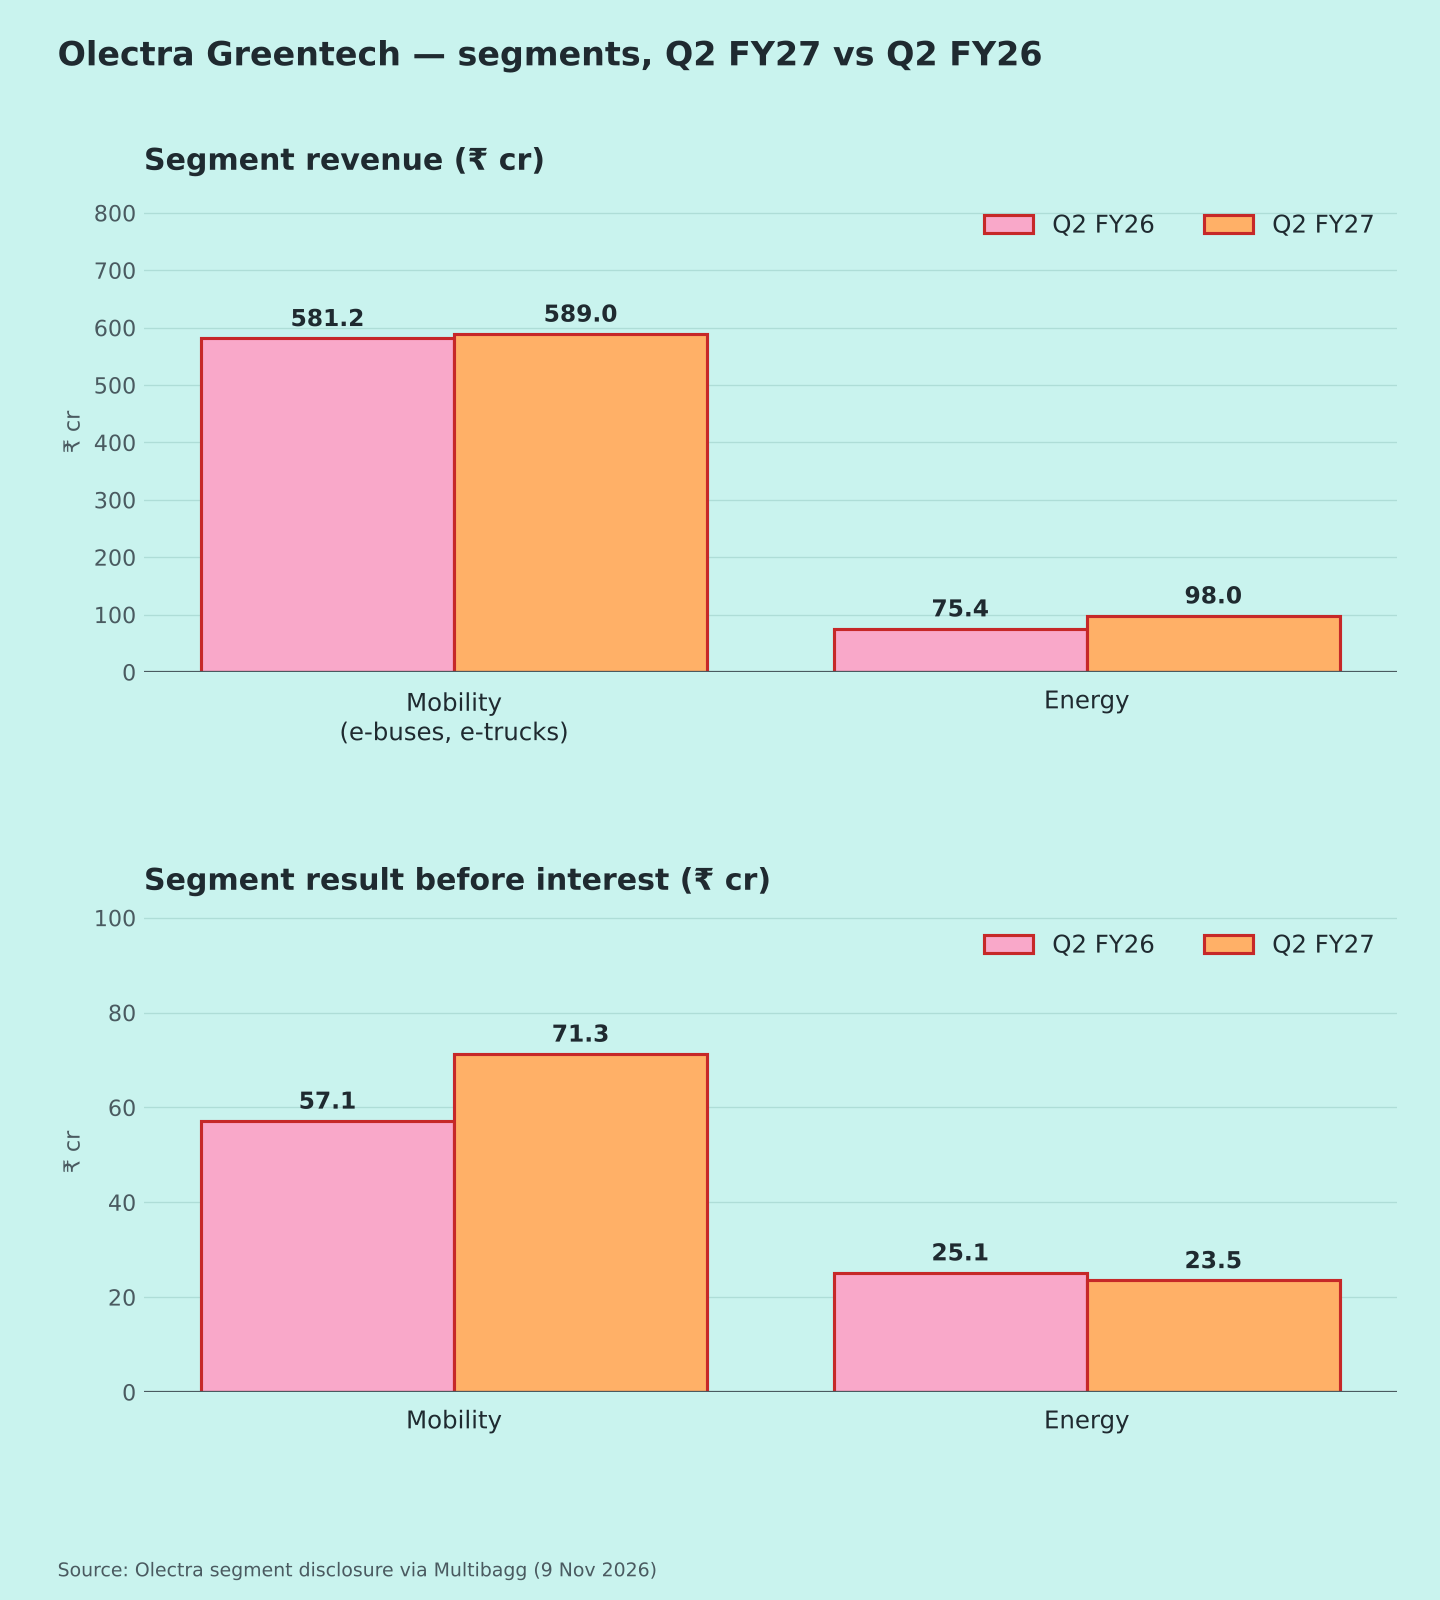
Segments (Chart 5) [1]
- Mobility (e-buses, e-trucks): revenue ₹589 cr (+1.3%); result ₹71.3 cr vs ₹57.1 cr.
- Energy: revenue ₹98 cr (+30%); result ₹23.5 cr vs ₹25.1 cr.
Orders and guidance
- Order book: more than 8,000 buses; cumulative deliveries are over 4,750 [3].
- FY27 deliveries: a 3 Sep 2026 report cited a target of 2,000–2,500 buses [5]. H1 delivered 759, so H2 needs 1,241–1,741, i.e. 1.6–2.3x H1 (my calculation). Q2 coverage didn't restate the target.
- New-generation buses: due in Q4 FY27 (Jan–Mar 2027) [3].
- Associate sale: the board approved selling its 34% stake in associate Evey Trans (UJJ) [4].
Positives
- Deliveries up 7% with a large order book [3]
- Mobility segment profit up 25% [1]
Concerns
- Profit growth relied on other income (my calculation)
- Rising finance costs [1]
- H2 delivery ramp-up needed (my view)
Things to track in Q3 FY27
- Quarterly deliveries vs the 2,000–2,500 target
- Finance cost trend
- New-generation bus launch
- Other income normalising
Not a buy/sell recommendation. I am not a SEBI-registered analyst. Facts are sourced; opinions are labelled.
Sources [1] Multibagg – Q2 results & segments · [2] Autocar Pro – Q2 net profit · [3] Autocar Pro – deliveries & new buses · [4] InvestyWise – board outcome · [5] Sahi – delivery plan, Sep 2026 · [6] Screener.in – consolidated
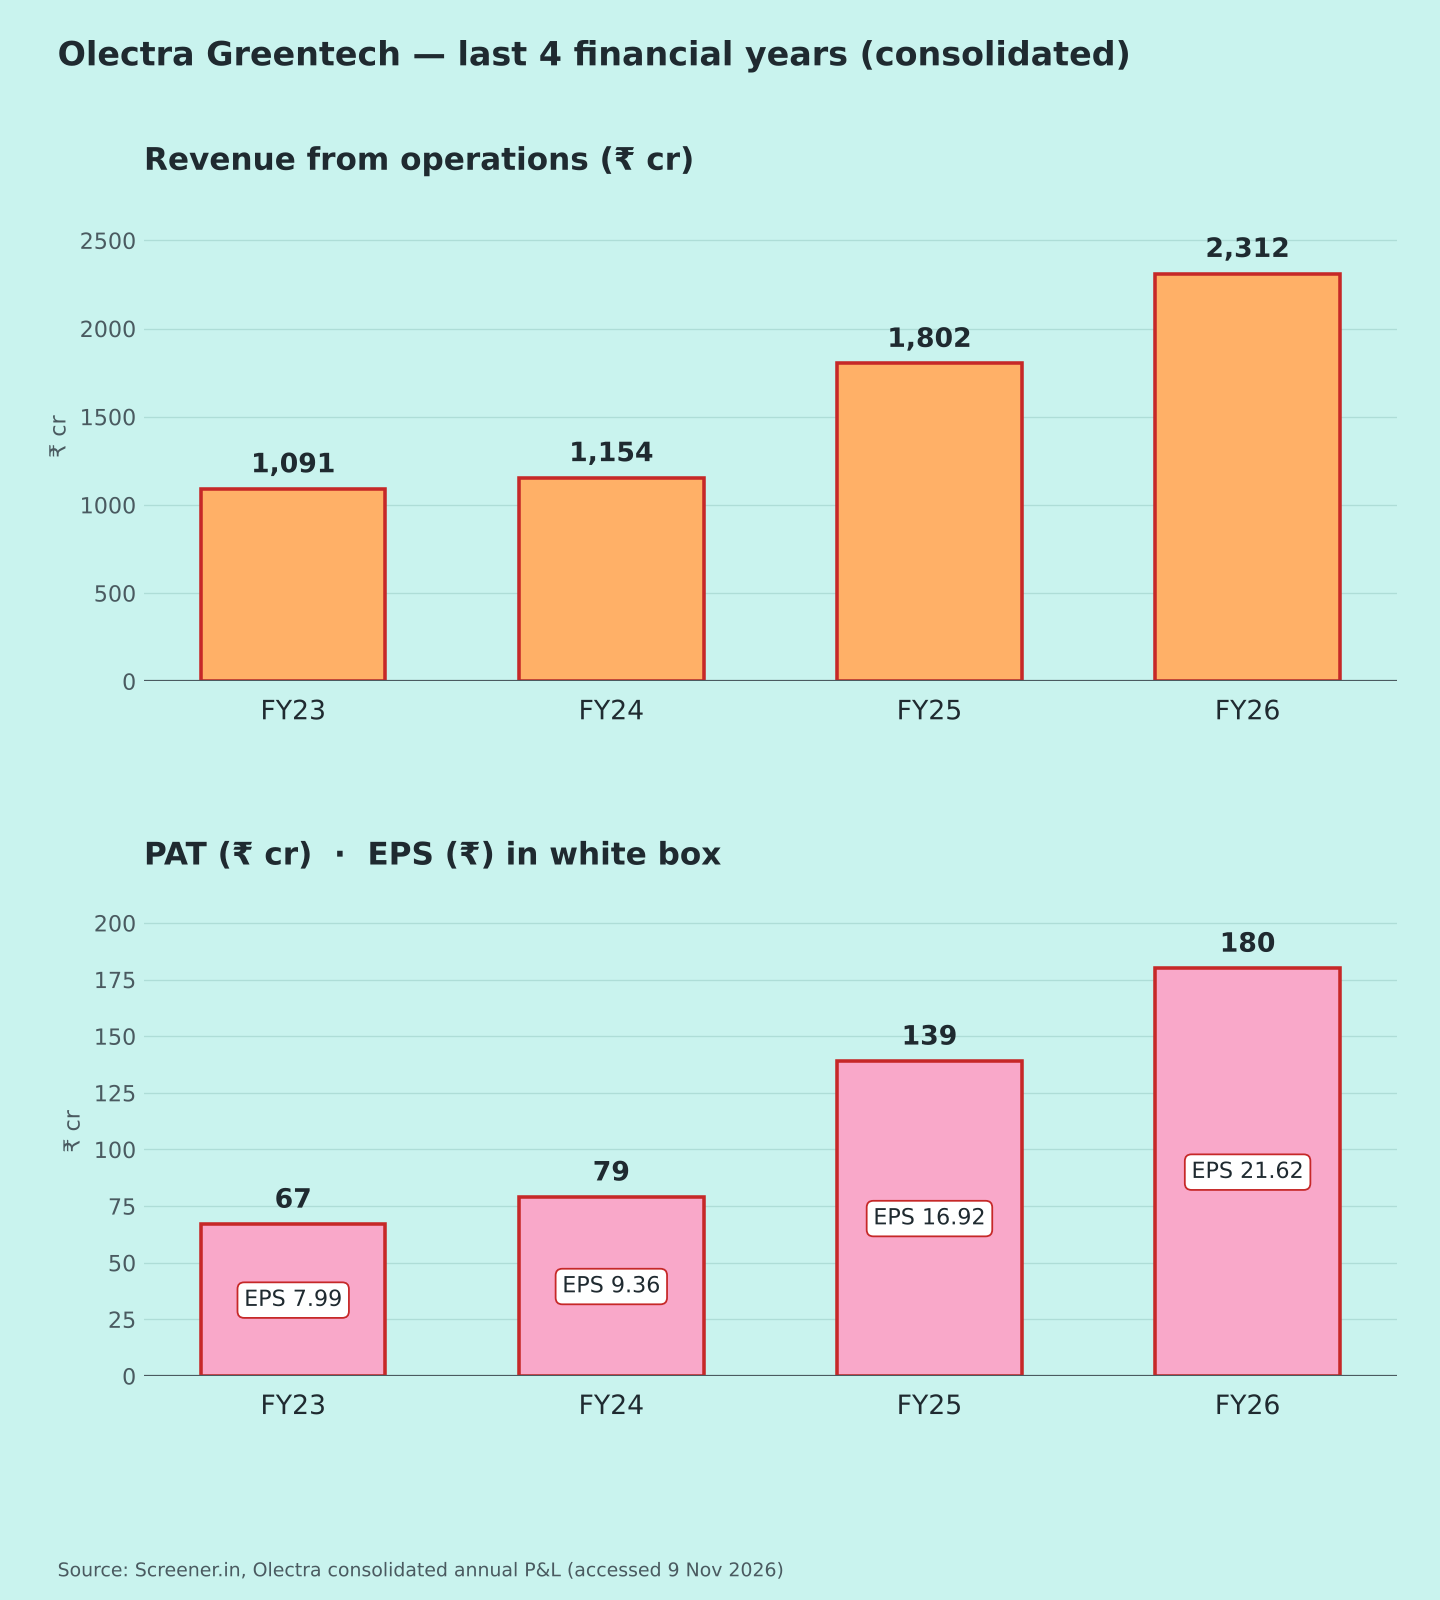
Charts: (1) 5 quarters revenue & PAT with EPS [1][6]; (2) FY23–FY26 [6]; (3) margins [1][6];(5) segments [1].