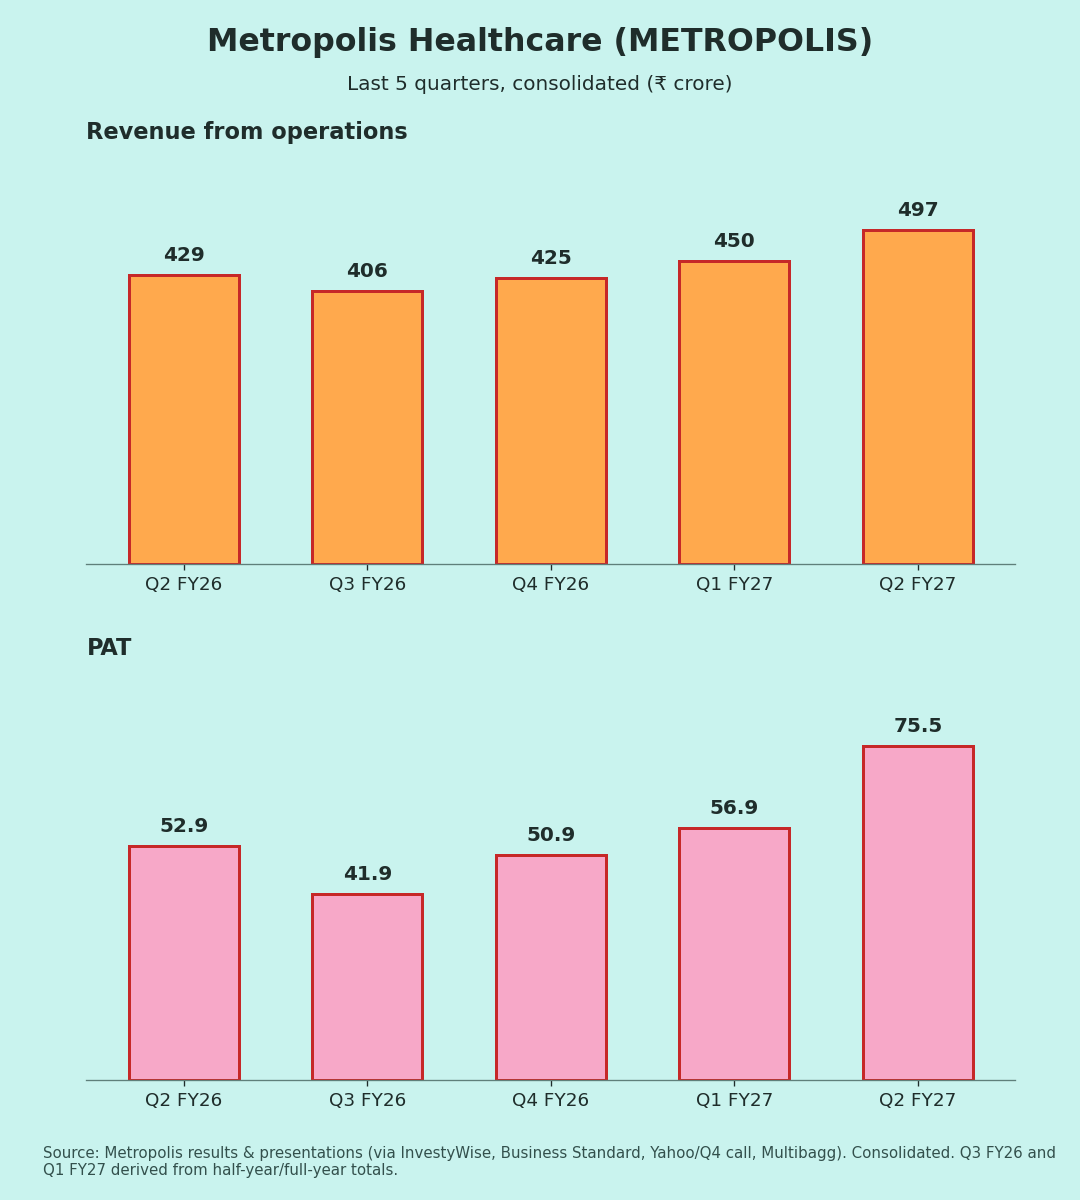
Consolidated figures, ₹ crore. Results were filed on 3 Nov 2026.
EBITDA is as reported by the company. YoY/QoQ % and margins are my calculations.
| Metric | Q2 FY27 | YoY | QoQ |
| Revenue from ops | 496.8 | +15.8% | +10.4% |
| EBITDA | 134.9 | +23.9% | +19.1% |
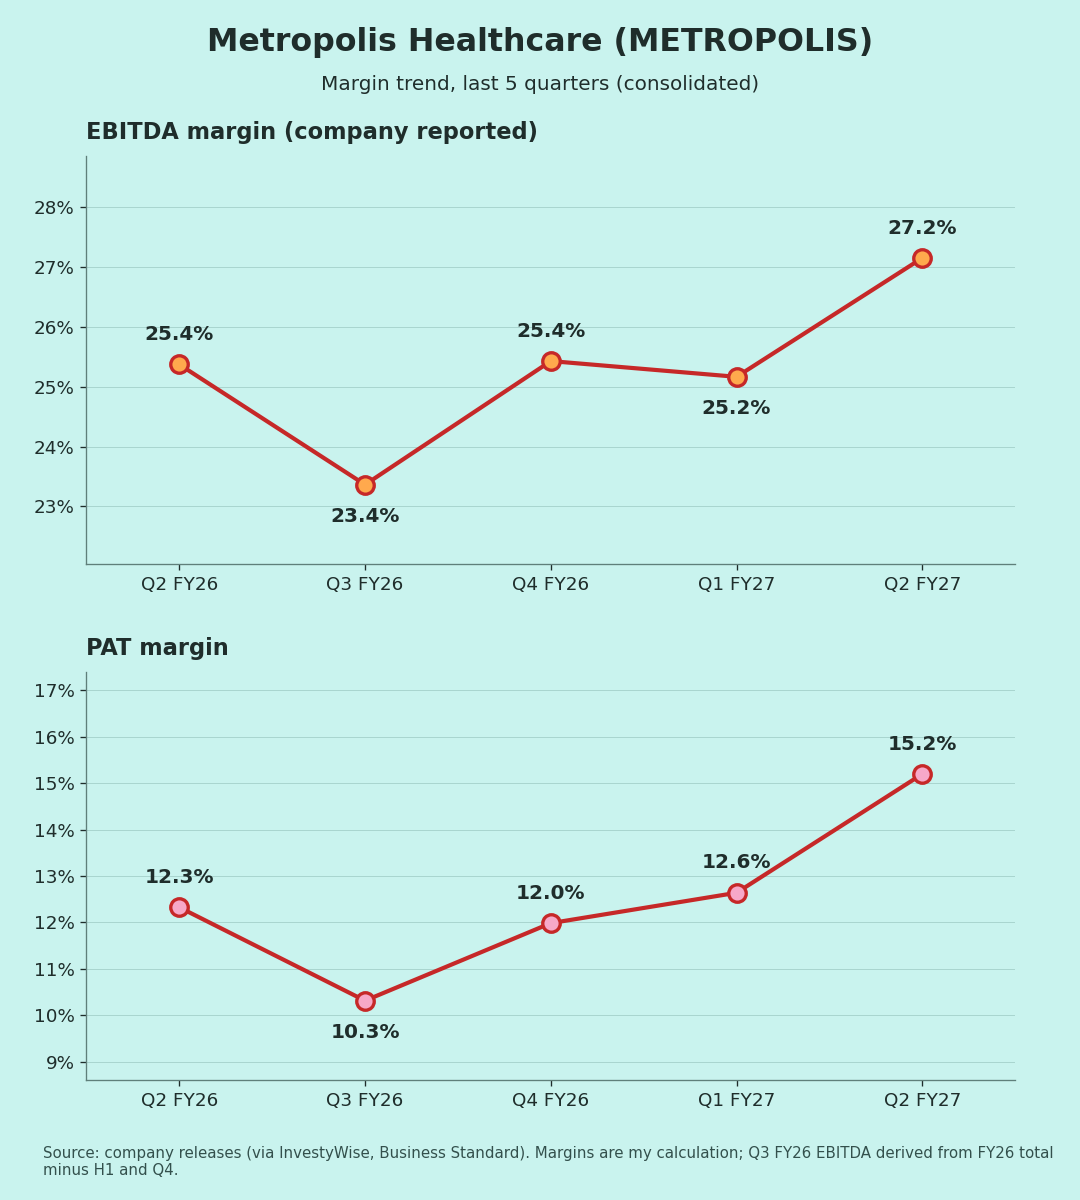
| EBITDA margin | 27.2% | 25.4% | 25.2% |
| PAT | 75.5 | +42.7% | +32.7% |
| PAT margin | 15.2% | 12.3% | 12.6% |
Margin rows show the year-ago and last-quarter values.
Quality of earnings
Growth was volume-led. Management says revenue grew in the mid-teens with no price hikes, helped by more labs and collection centres, and a better mix [1].
Profit grew much faster than revenue, for two reasons:
- EBITDA margin up ~180 bps, from operating leverage and automation [1].
- Costs below EBITDA barely grew. Depreciation, interest and tax together were about ₹59 cr, against ₹56 cr a year ago (my calculation). So most of the extra EBITDA reached PAT.
One structural change: the EQAS (quality testing) division moved into a subsidiary on 27 Aug 2026. It shows as discontinued operations in the standalone accounts [3]. Since it stays within the group, the consolidated impact should be small (interpretation).
Margins (Chart 3)
EBITDA margin over five quarters: 25.4% → 23.4% → 25.4% → 25.2% → 27.2%. Q2 FY27 is the highest of the five. Q3 FY26 is derived from full-year totals.
Guidance: what changed
- FY27 guidance (May): revenue growth of 14–15% and EBITDA margin up 100–150 bps from FY26's 24.4%, assuming no price increase [7].
- H1 actual: revenue up 16.2% and EBITDA margin at 26.2% (+190 bps) [1]. Both are ahead of guidance.
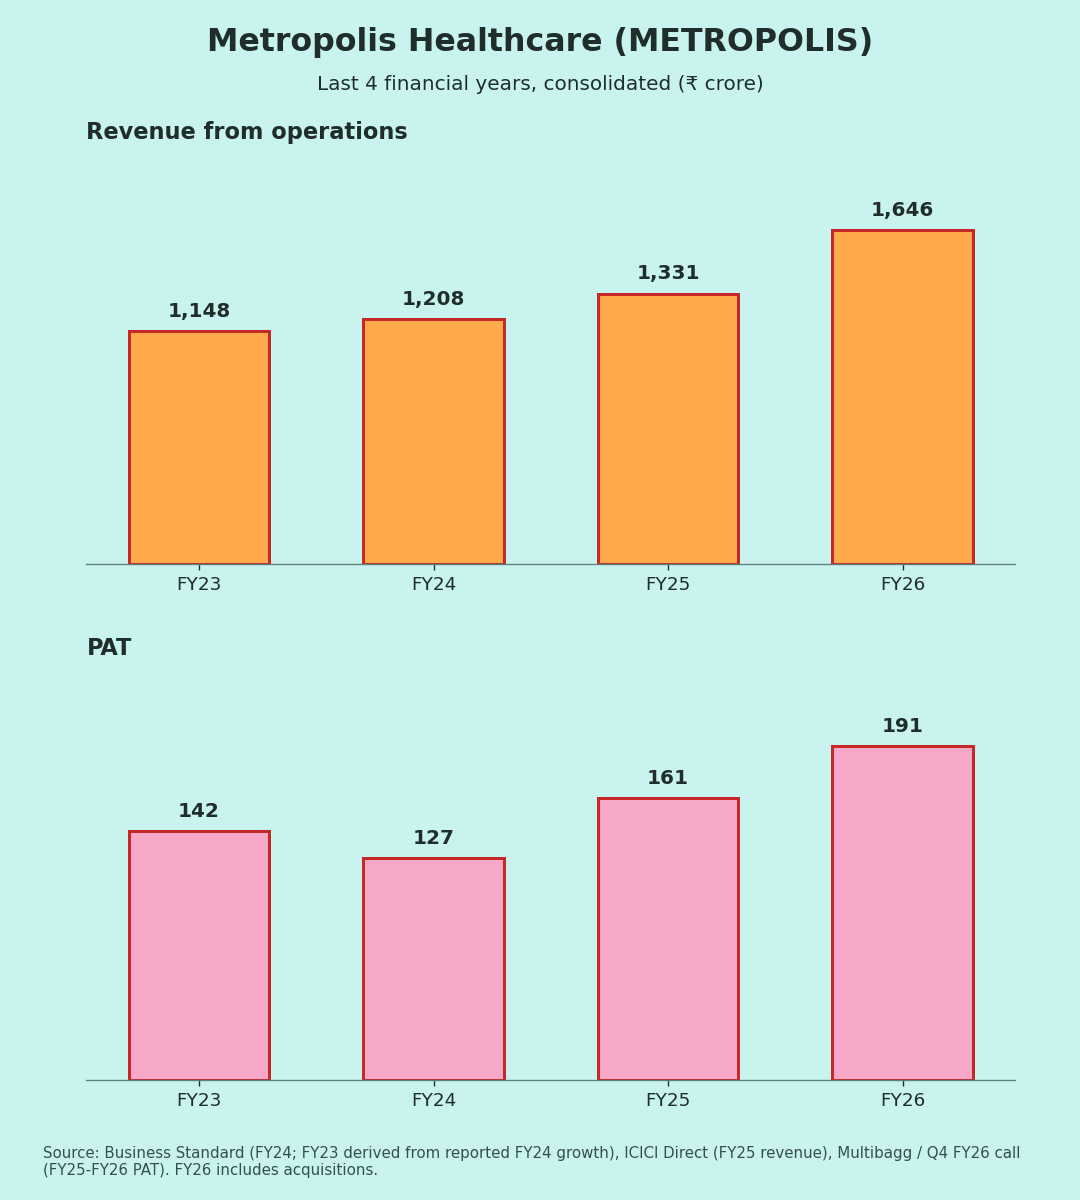
- Longer term: revenue above ₹2,500 cr in about three years, from ₹1,646 cr in FY26 [4].
- Network: 213 labs and 5,119 service points across about 750 towns [1].
- Dividend: an interim dividend of ₹1 per share; the record date is 9 Nov [3].
Positives
- Revenue growth without price hikes [1]
- Margin at a five-quarter high [1]
- H1 running ahead of both guided numbers [1][7]
Concerns
- No segment split (B2C/B2B) in coverage yet, so the mix can't be checked (my view)
- Network expansion adds fixed costs if volumes slow (interpretation)
- Q3 is seasonally softer (Q3 FY26 margin was 23.4%) [5]
Things to track in Q3 FY27
- Whether the EBITDA margin holds above 26%
- Patient and test volume growth without price increases
- B2C vs B2B growth once the call or presentation is covered
- Progress toward the ₹2,500 cr revenue target
Not a buy/sell recommendation. Facts are sourced; opinions are labelled.
Sources [1] InvestyWise – Q2 FY27 presentation · [2] InvestyWise – Q2 FY27 results · [3] Whalesbook – filing, EQAS, dividend · [4] Sahi – Q2 revenue & 3-year target · [5] Business Standard – Q4 FY26 · [6] Yahoo Finance – Q4 FY26 call · [7] Multibagg – FY27 guidance · [8] ICICI Direct – FY25/FY26 revenue · [9] Business Standard – FY24
Charts:
(1) last 5 quarters revenue & PAT, Q3 FY26 derived;
(2) FY23–FY26 revenue & PAT, FY23 derived from the reported FY24 growth;
(3) EBITDA and PAT margin (own calc.).