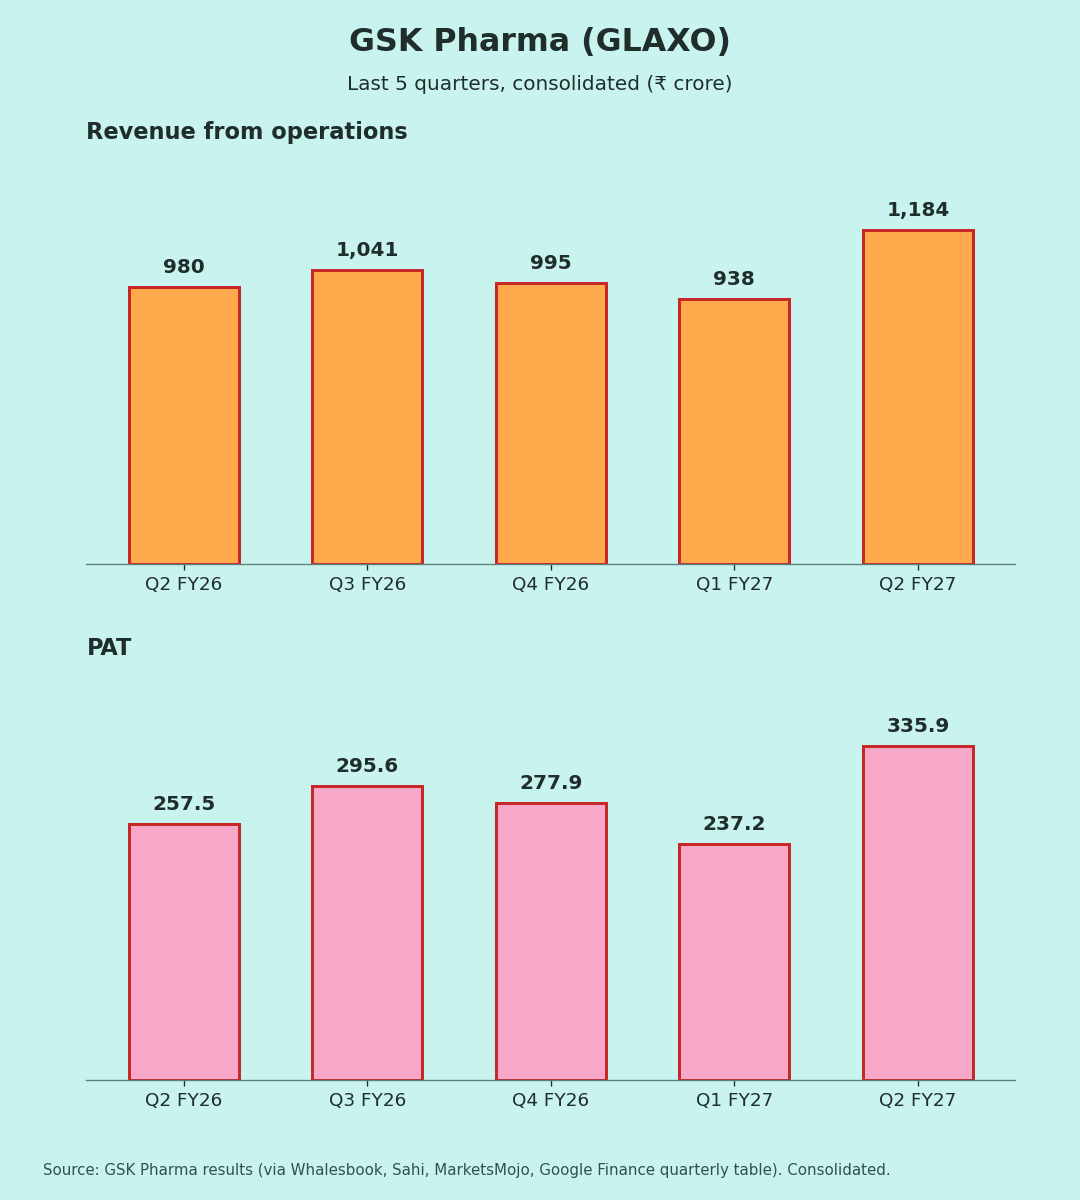
Consolidated figures, ₹ crore. Results were filed on 3 Nov 2026.
YoY/QoQ %, margins and ratios are my calculations. Q2 FY27 EBITDA (~₹402 cr) is derived from the reported +20% YoY [3].
| Metric | Q2 FY27 | YoY | QoQ |
| Revenue from ops | 1,183.6 | +20.8% | +26.1% |
| EBITDA (approx.) | ~402 | +20% | ~+39% |
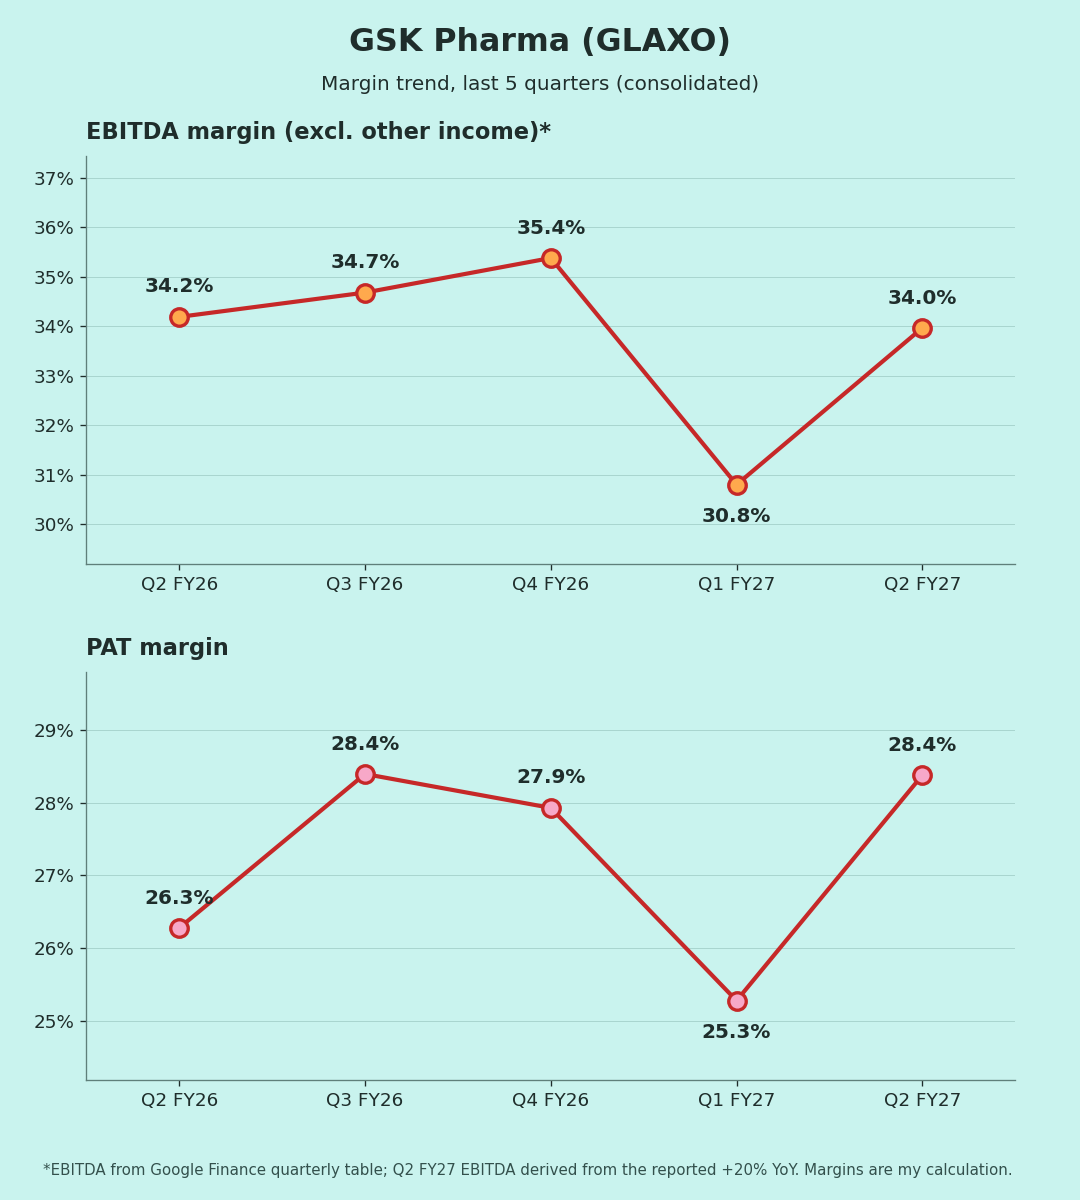
| EBITDA margin | ~34.0% | 34.2% | 30.8% |
| PBT | 460 | +29.9% | +42.9% |
| PAT | 335.9 | +30.4% | +41.6% |
| PAT margin | 28.4% | 26.3% | 25.3% |
| Other income / PBT | ~15.8% | – | – |
Margin rows show the year-ago and last-quarter values.
Quality of earnings
The core business grew well. Revenue rose 21%, and management credits all three portfolios [3]:
- General Medicines: established brands gained market share.
- Vaccines: helped by its position in private paediatric vaccines and growth in the adult shingles vaccine.
- Oncology: gaining momentum.
But profit grew faster than operations:
- EBITDA vs PAT: EBITDA rose about 20% while PAT rose 30%.
- Other income: the gap is mainly other income. Total income was ₹1,256.4 cr against revenue of ₹1,183.6 cr [2], so other income was about ₹73 cr, roughly 16% of PBT (my calculation).
- Breakdown not disclosed: treasury income on GSK's cash is the usual source, but the sources don't say whether any of this quarter's figure is one-off (interpretation).
- Tax: the rate was a normal ~27%. No exceptional items are mentioned.
Base effect: Q2 FY26 was a normal quarter [1]. The weak quarter was Q1 FY27 (30.8% margin), which makes QoQ growth look broader.
Margins (Chart 3)
EBITDA margin over five quarters: 34.2% → 34.7% → 35.4% → 30.8% → ~34.0% [4][3]. Q2 recovered from the Q1 dip. PAT margin reached 28.4%, matching the series high from Q3 FY26, helped by other income.
Guidance: what changed
- Focus areas: management named launches in oncology and adult vaccination [3]. That includes entering haemato-oncology with BLENREP [3].
- Risks flagged: inflation and supply-chain risks from geopolitics. Sourcing is being diversified in response [3].
- Auditors: Walker Chandiok & Co was appointed statutory auditor for five years [2].
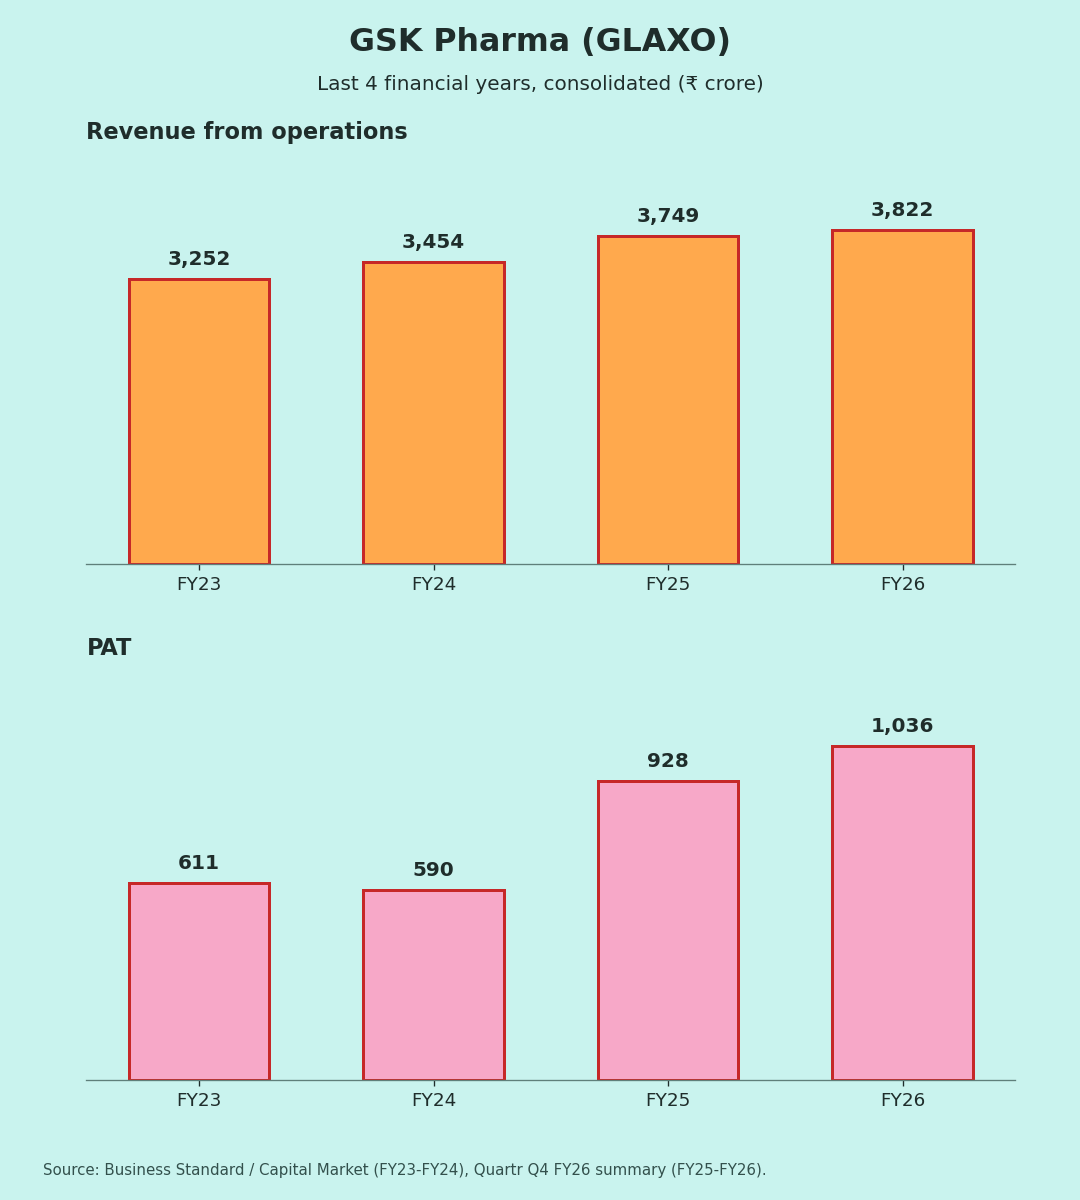
- Context: in FY26, PAT before exceptionals crossed ₹1,000 cr for the first time [6].
Positives
- Revenue +21%, the fastest in the five quarters shown [1][4]
- All three portfolios (General Medicines, Vaccines, Oncology) growing [3]
- EBITDA margin back near 34% [3][4]
Concerns
- Part of the profit jump comes from other income (my calculation)
- No numeric segment split in the release (my view)
- Inflation and supply-chain risks flagged by the MD [3]
Things to track in Q3 FY27
- Other income vs core EBITDA growth
- EBITDA margin holding near 34–35%
- Oncology and shingles vaccine traction
- Whether 20%+ revenue growth repeats
Not a buy/sell recommendation. I am not a SEBI-registered analyst. Facts are sourced; opinions are labelled.
Sources [1] Whalesbook – Q2 FY27 filing, 3 Nov 2026 · [2] InvestyWise – board outcome, total income · [3] Kotak Neo – PBT, EBITDA growth, commentary · [4] Google Finance – quarterly revenue & EBITDA · [5] Sahi – Q1 FY27 · [6] Quartr – Q4 FY26 summary · [7] MarketsMojo – Q3/Q4 FY26 PAT · [8] Business Standard – FY23–FY24
Charts: (1) last 5 quarters revenue & PAT [1][4][5][7]; (2) FY23–FY26 revenue & PAT [6][8]; (3) EBITDA and PAT margin (own calc. from [3][4]).