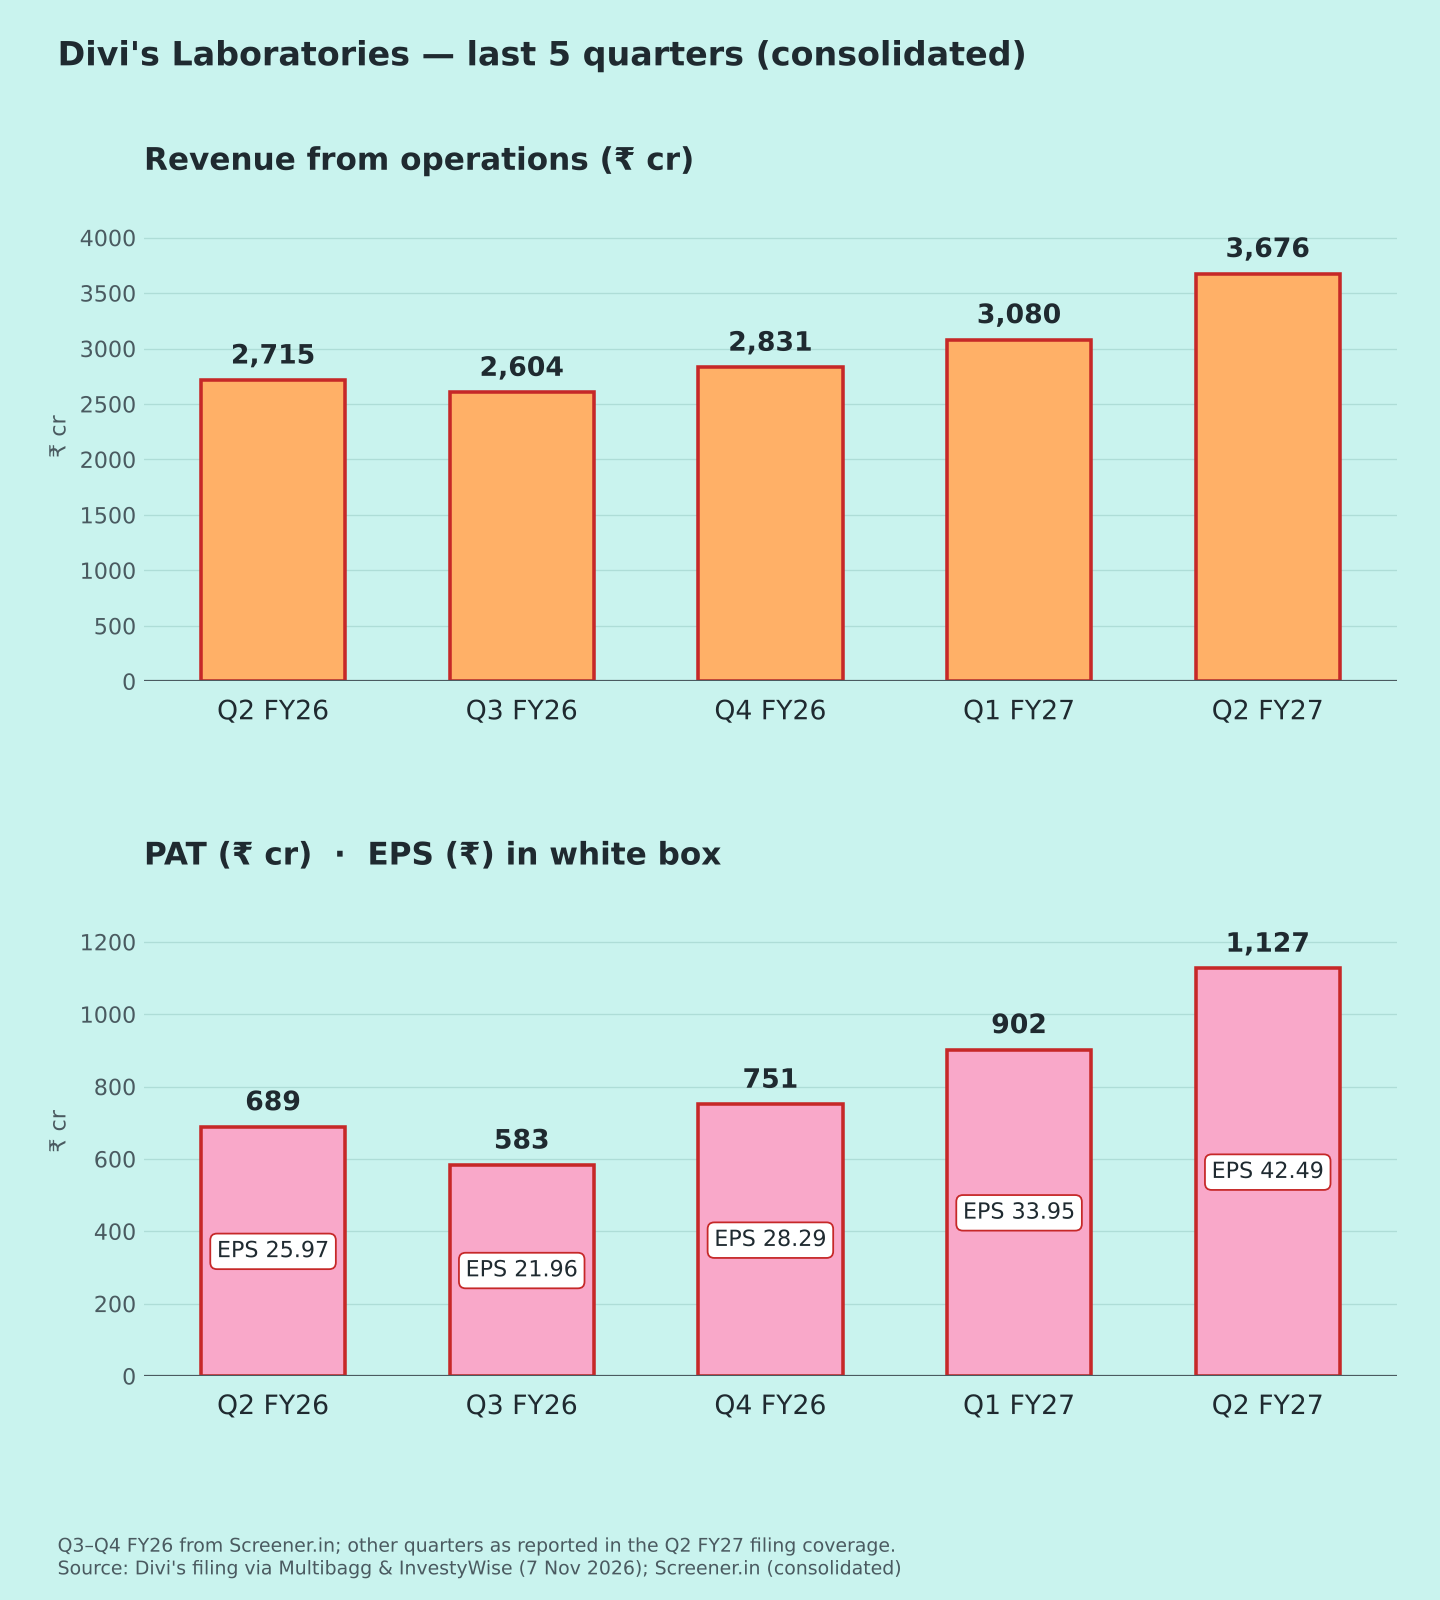
Consolidated figures, ₹ crore. Results announced 7 Nov 2026 [1][2]. PAT = consolidated PAT. EBITDA is my calculation and excludes other income; the company's own EBITDA wasn't in coverage. YoY/QoQ % and margins are my calculations unless stated.
| Metric | Q2 FY27 | YoY | QoQ |
| Revenue from ops | 3,676 | +35.4% | +19.4% |
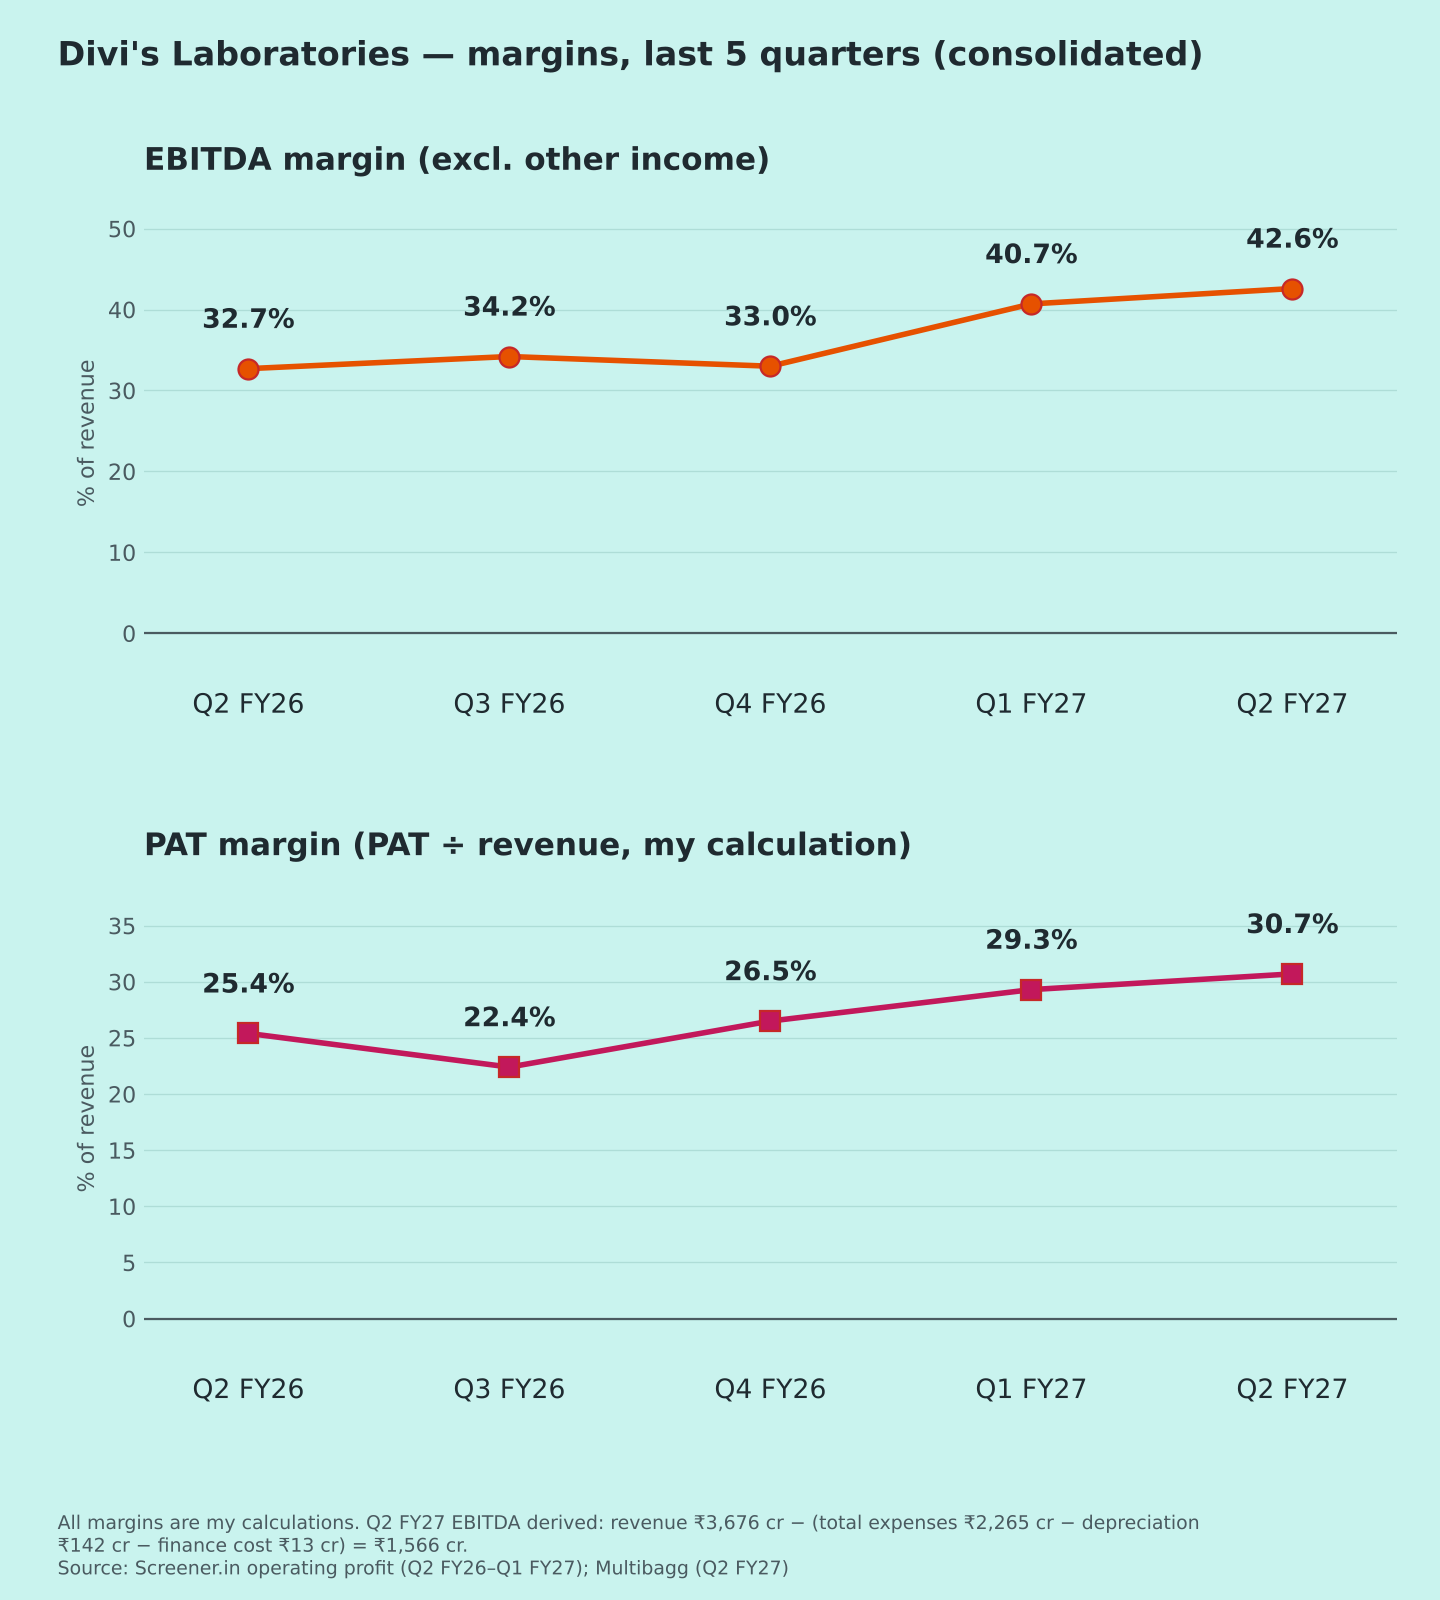
| EBITDA (≈ derived) | ≈1,566 | ≈+76% | ≈+25% |
| EBITDA margin (≈) | ≈42.6% | 32.7% | 40.7% |
| Other income | 94 | −35% | +47% |
| PBT | 1,505 | +65.0% | +27.5% |
| PAT | 1,127 | +63.6% | +24.9% |
| PAT margin | 30.7% | 25.4% | 29.3% |
| EPS (₹) | 42.49 | +63.6% | +25.2% |
| Other income / PBT | 6.2% | 15.9% | 5.4% |
Margin and ratio rows show year-ago and last-quarter values. ≈ EBITDA = revenue − (total expenses ₹2,265 cr − depreciation ₹142 cr − finance cost ₹13 cr). Earlier quarters use Screener's operating profit [5]. Sources: [1][2][5]
Source notes: InvestyWise headlines "₹1,140 cr profit" [3]. That is standalone PAT; consolidated PAT is ₹1,127 cr [1]. ₹3,770 cr is consolidated total income, which includes other income [2]. One headline's "revenue ₹3,080 cr" is the Q1 figure.
Quality of earnings
- Growth is operational, not from other income. Other income fell to ₹94 cr from ₹145 cr; the forex gain was ₹24 cr vs ₹63 cr [1]. Other income is just 6% of PBT. The tax rate is steady at about 25% (my calculation).
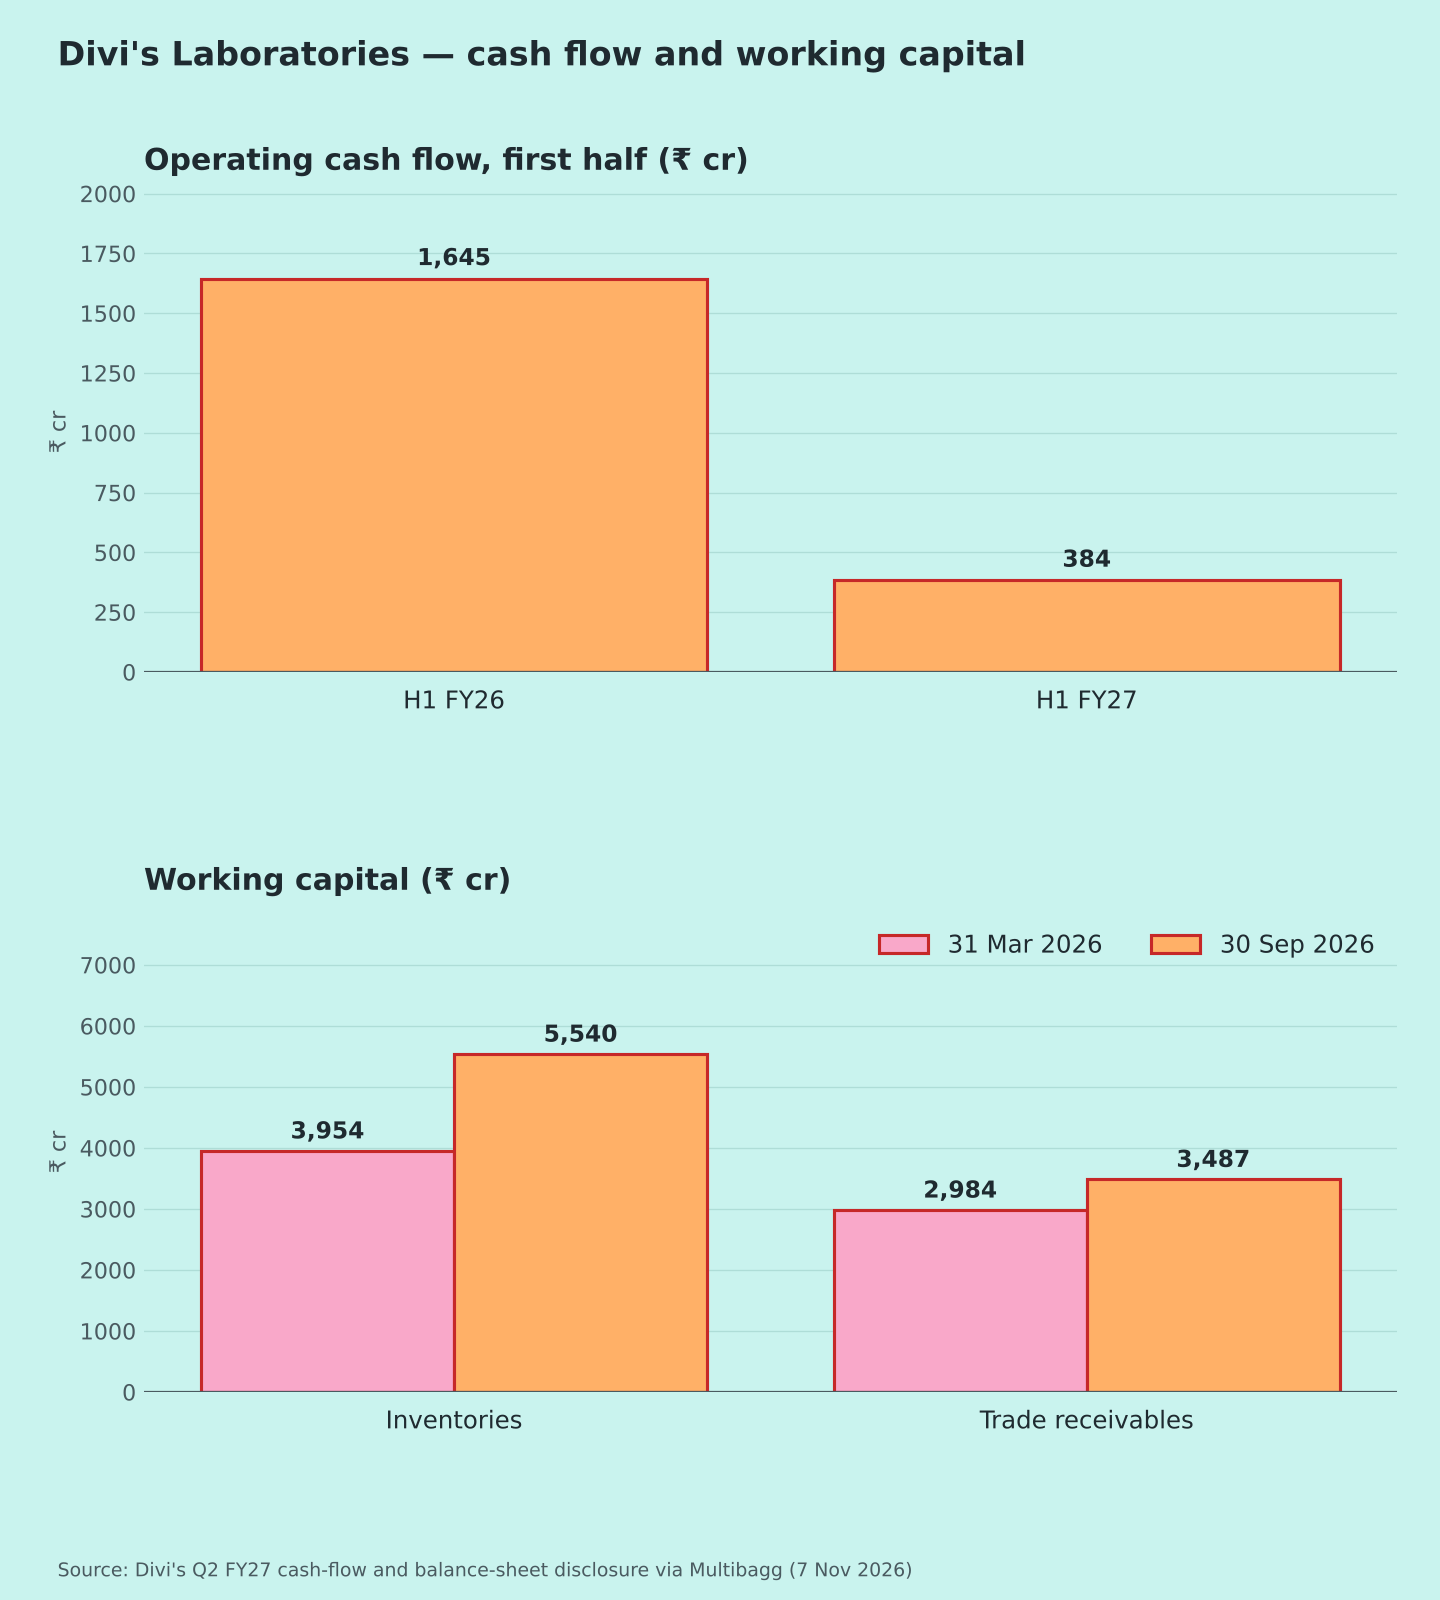
- Profit is up, cash isn't (yet). Inventories rose to ₹5,540 cr from ₹3,954 cr in March, and receivables to ₹3,487 cr from ₹2,984 cr [4]. As a result, H1 operating cash flow was ₹384 cr vs ₹1,645 cr a year ago [4].
- Inventory is being built. Raw-material purchases nearly doubled to ₹1,812 cr, partly added to inventory (₹631 cr) [1]. My view: this suggests stock-building for future deliveries.
- Capex: ₹872 cr was spent in H1 [4].
Margins (Chart 3)
EBITDA margin: 32.7% → 34.2% → 33.0% → 40.7% → 42.6% (my calculation). It is the second straight quarter above 40%, a clear step up from FY26.
Segments
Divi's reports one segment: APIs, intermediates and nutraceutical ingredients [1]. Chart 5 shows cash flow and working capital instead.
Commentary
No guidance was found in coverage. The earnings call was at 2 pm on 7 Nov. I can add management's commentary once it is covered.
Positives
- Revenue +35%, PAT +64% [1]
- Margins at a five-quarter high (my calculation)
Concerns
- Weak cash conversion in H1 [4]
- Inventory build-up [4]
Things to track in Q3 FY27
- Whether inventory turns into sales
- Operating cash flow
- Margin sustainability above 40%
- Commentary from the call
Not a buy/sell recommendation. I am not a SEBI-registered analyst. Facts are sourced; opinions are labelled.
Sources [1] Multibagg – Q2 profit +64% · [2] InvestyWise – consolidated results · [3] InvestyWise – standalone results · [4] Multibagg – cash flow & balance sheet · [5] Screener.in – consolidated
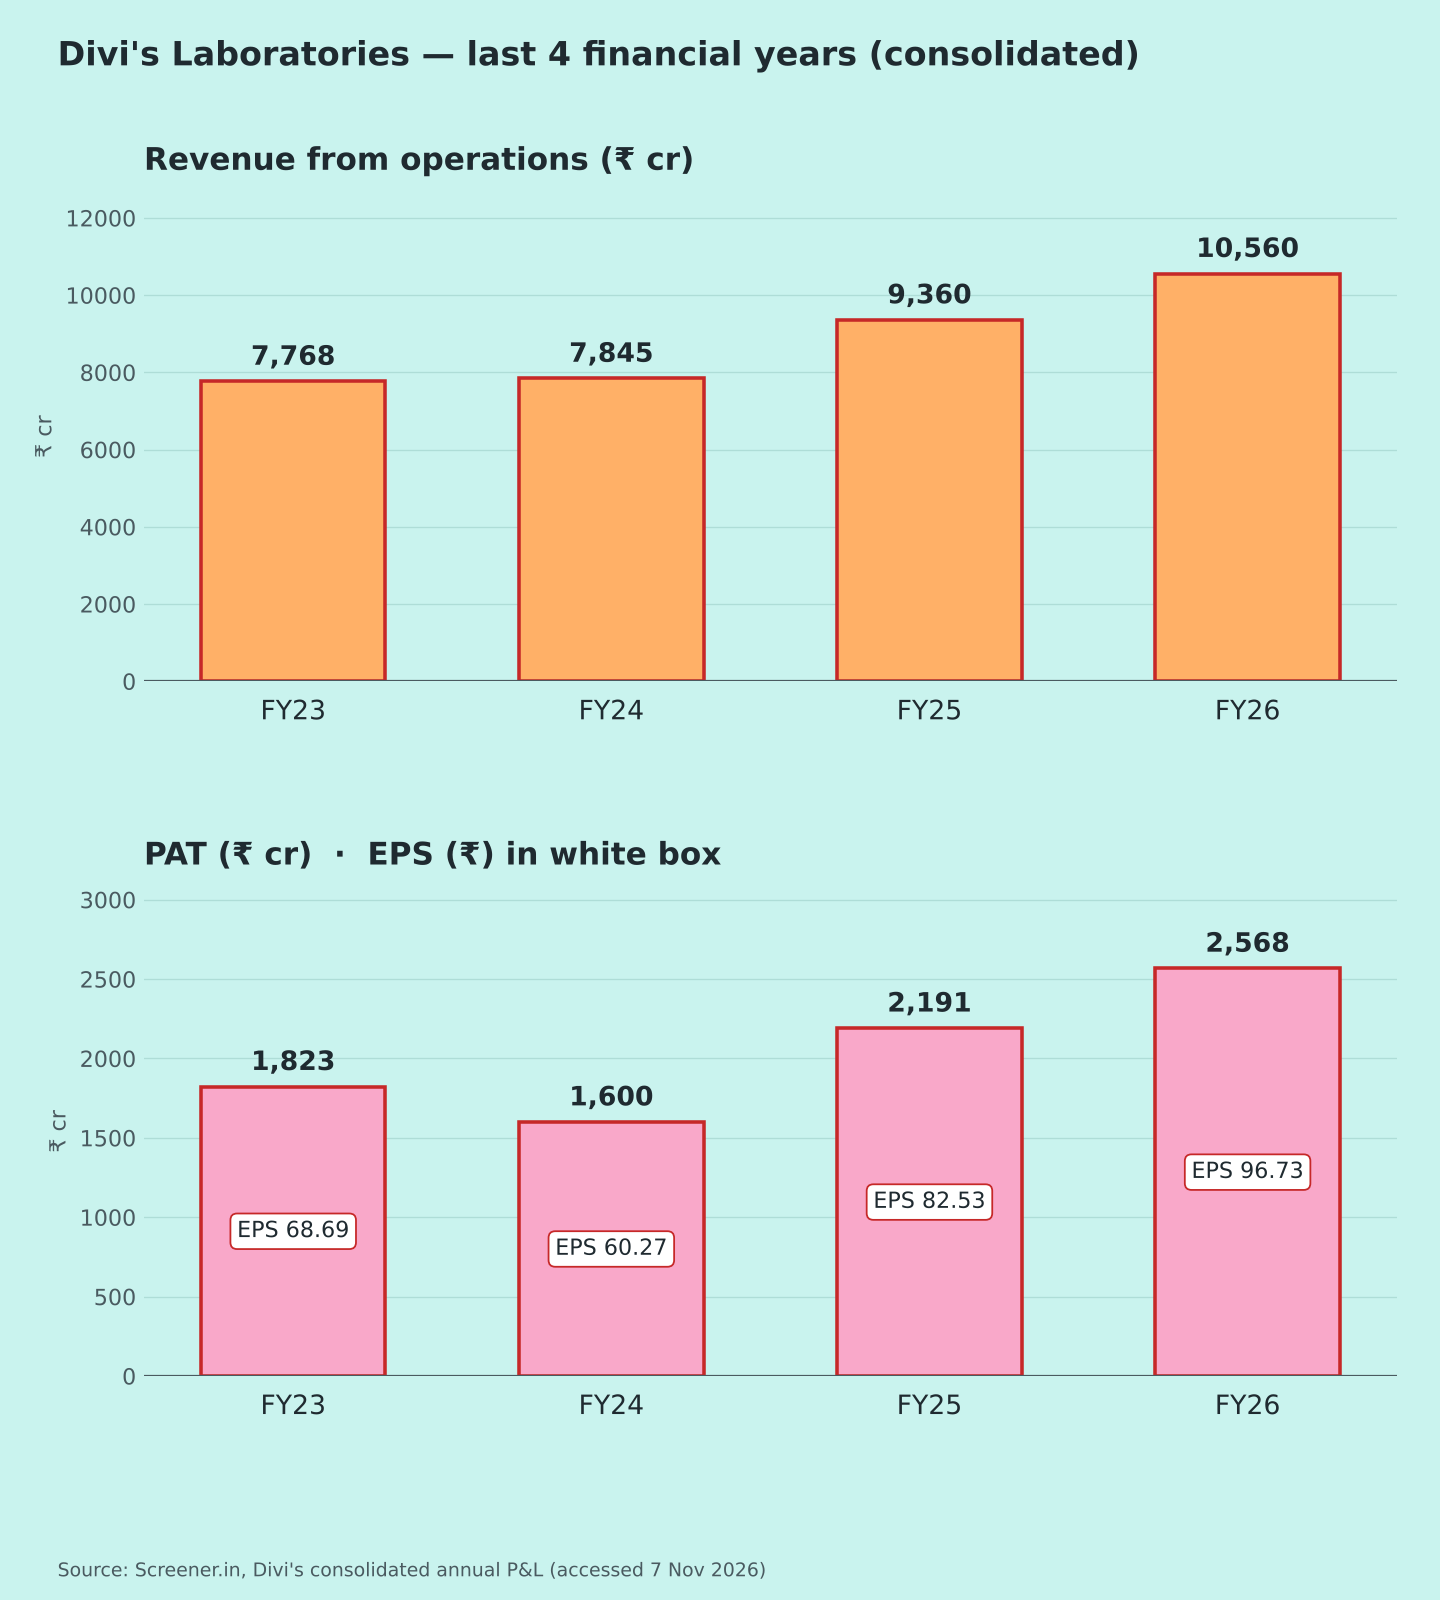
Charts: (1) 5 quarters revenue & PAT with EPS [1][5]; (2) FY23–FY26 [5]; (3) margins [1][5]; (4) cash flow & working capital.