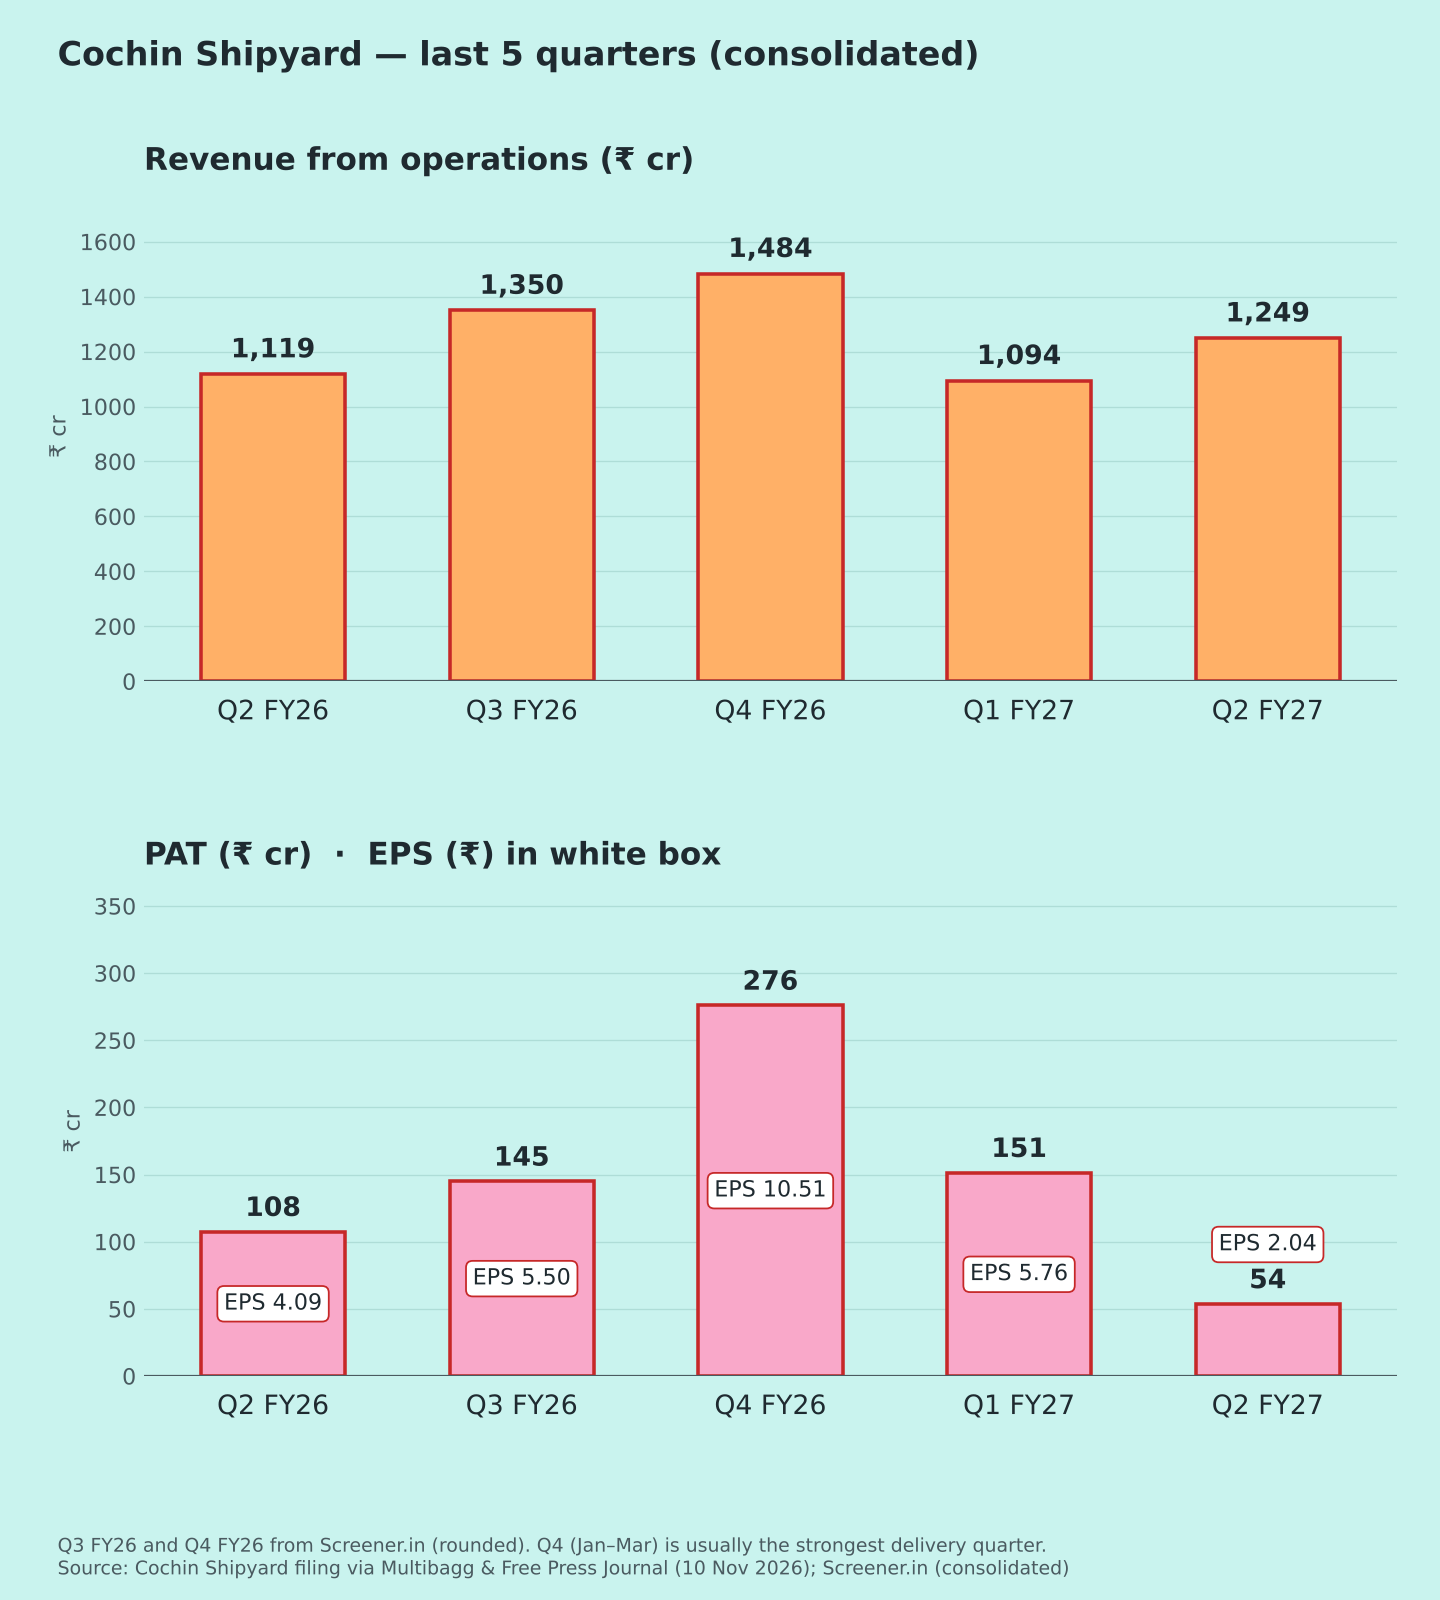
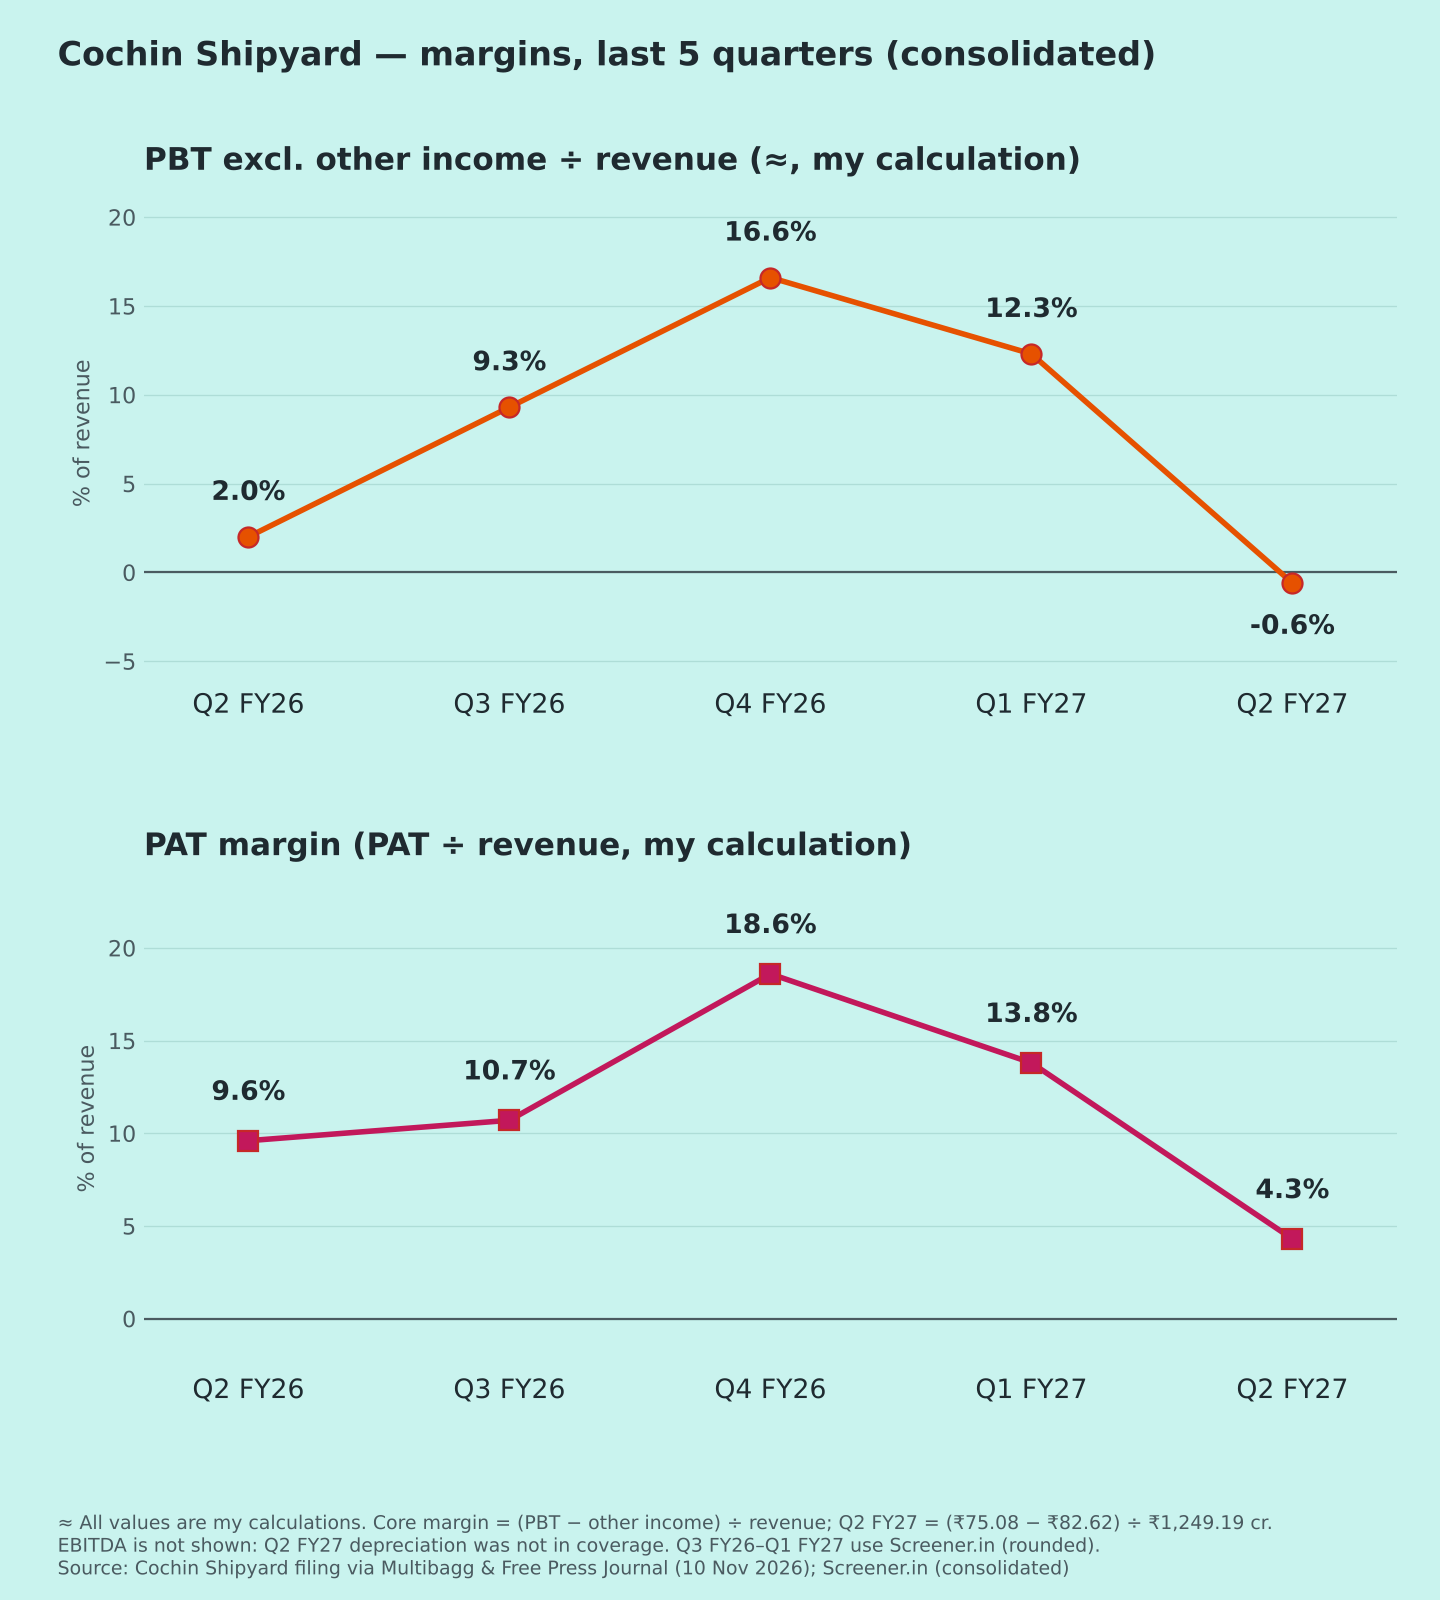
Consolidated figures, ₹ crore. Results announced 10 Nov 2026. PAT = consolidated PAT. EPS as reported. EBITDA is left out because depreciation wasn't in coverage; I show profit before tax excluding other income instead ("core PBT", my calculation). Q1 FY27 PBT and other income are from Screener (rounded) [3].
| Metric | Q2 FY27 | YoY | QoQ |
| Revenue from ops | 1,249.2 | +11.7% | +14.2% |
| Other income | 82.6 | −35% | ≈+23% |
| PBT | 75.1 | −49.9% | ≈−63% |
| Core PBT (≈) | ≈−7.5 | ≈22.6 | ≈135 |
| Core PBT margin (≈) | ≈−0.6% | ≈2.0% | ≈12.3% |
| PAT | 53.8 | −50.0% | −64.5% |
| PAT margin | 4.3% | 9.6% | 13.8% |
| EPS (₹) | 2.04 | 4.09 | 5.76 |
| Other income / PBT | 110% | 85% | ≈33% |
Margin, ratio, core PBT and EPS rows show year-ago and last-quarter values. ≈ derived: core PBT = PBT − other income. All % changes are my calculations. Sources: [1][2][3]
Quality of earnings
- The core business made a small loss. Other income (₹82.6 cr) was larger than PBT (₹75.1 cr). Without it, pre-tax profit was about −₹7.5 cr (my calculation).
- Costs rose faster than revenue. Materials ₹682.8 cr vs ₹554.8 cr (+23%, my calculation); subcontract costs ₹275.8 cr vs ₹242.0 cr [2]. Finance cost ₹26.5 cr vs ₹20.2 cr [1].
- Base effect: the year-ago quarter also leaned on other income (₹127 cr). QoQ is the fairer comparison for the business trend, and it shows a sharp drop from Q1 (my view).
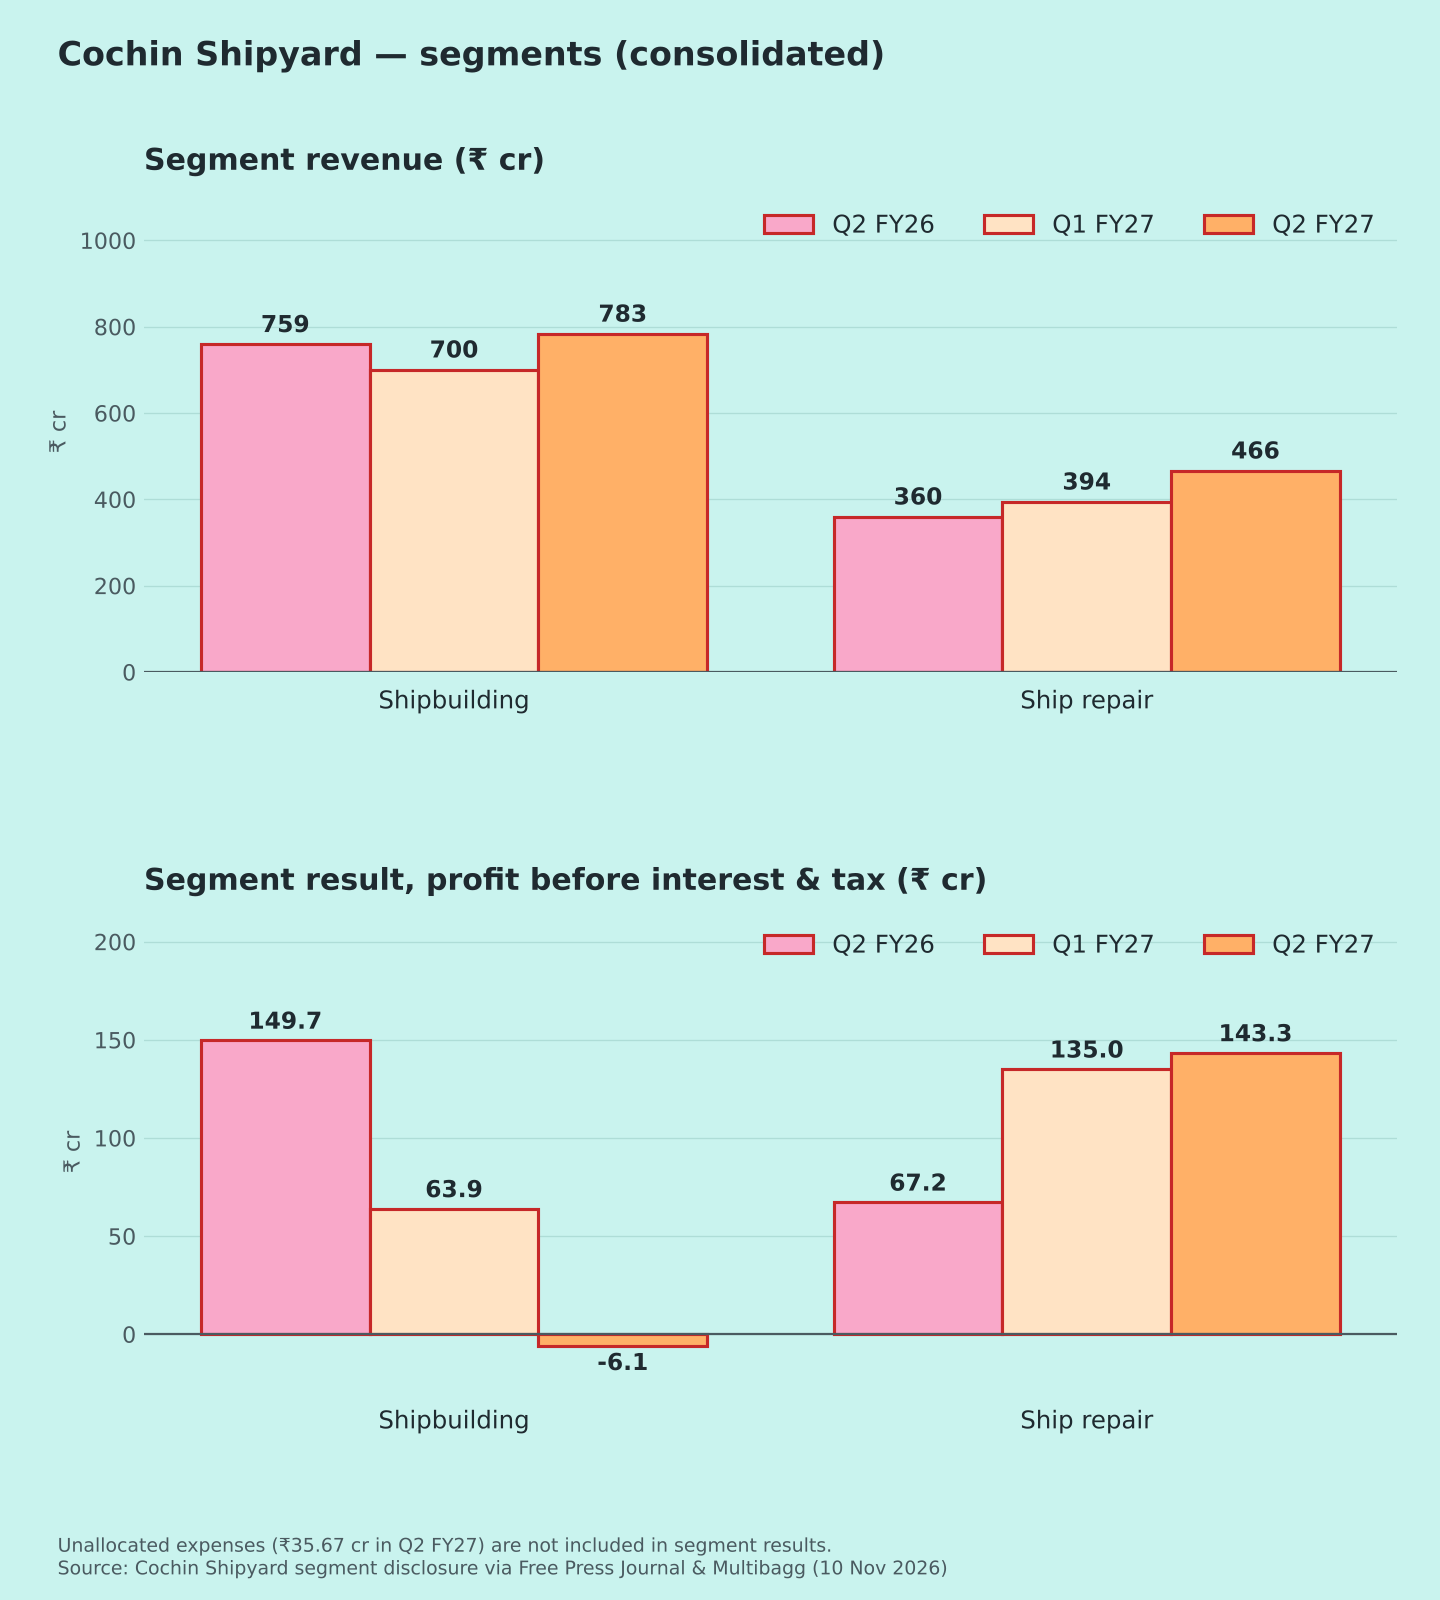
Segments (Chart 5) [2] (% changes are my calculations)
- Shipbuilding: revenue ₹783 cr (+3%), but result swung to a loss of ₹6.1 cr from a profit of ₹149.7 cr a year ago and ₹63.9 cr in Q1.
- Ship repair: revenue ₹466 cr (+30%); result ₹143.3 cr vs ₹67.2 cr. Repair now carries the company's profit.
- Andaman vessels: two 1,200-passenger ships are about 55% complete, years past their contract dates. Liquidated damages of ≈₹215.7 cr in total (my sum of ₹118.1 cr + ₹97.6 cr) have been recognised so far; delivery is paused at the buyer's request while the ships are considered for reallocation. The auditor highlighted this uncertainty; its review conclusion was unmodified [2]. Coverage doesn't link it directly to the Q2 loss.
Margins (Chart 3)
Core PBT margin: 2.0% → 9.3% → 16.6% → 12.3% → −0.6% (my calculation).
Guidance check
- Earlier guidance: FY27 revenue growth of 12–15% and EBITDA margin of about 14%; shipbuilding margin 10–12%, ship repair 22–24% [4].
- H1 revenue grew 7.1% [2]. Meeting 12–15% needs H2 growth of about 16–21% (my calculation).
- H1 segment result margin: shipbuilding ≈3.9%, ship repair ≈32.4% (my calculation; segment result isn't the same measure as EBITDA).
- Order book about ₹21,900 cr (Sep 2026) [4].
Other: interim dividend ₹3 per share, record date 16 Nov 2026 [2]. Debt-to-equity rose to 0.29 from 0.10 [2].
Positives
- Ship repair revenue +30%, profit about doubled [2]
- Large order book [4]
Concerns
- Shipbuilding loss; profit leans on other income (my calculation)
- Andaman vessel uncertainty [2]
Things to track in Q3 FY27
- Shipbuilding segment margin vs the 10–12% guidance
- Decision on the Andaman vessels and any provisions
- H2 revenue growth vs the guidance
- Borrowings and finance cost
Not a buy/sell recommendation. I am not a SEBI-registered analyst. Facts are sourced; opinions are labelled.
Sources [1] Multibagg – profit halves, loss in shipbuilding · [2] Free Press Journal – Q2 results · [3] Screener.in – consolidated · [4] Sahi – order book & FY27 guidance
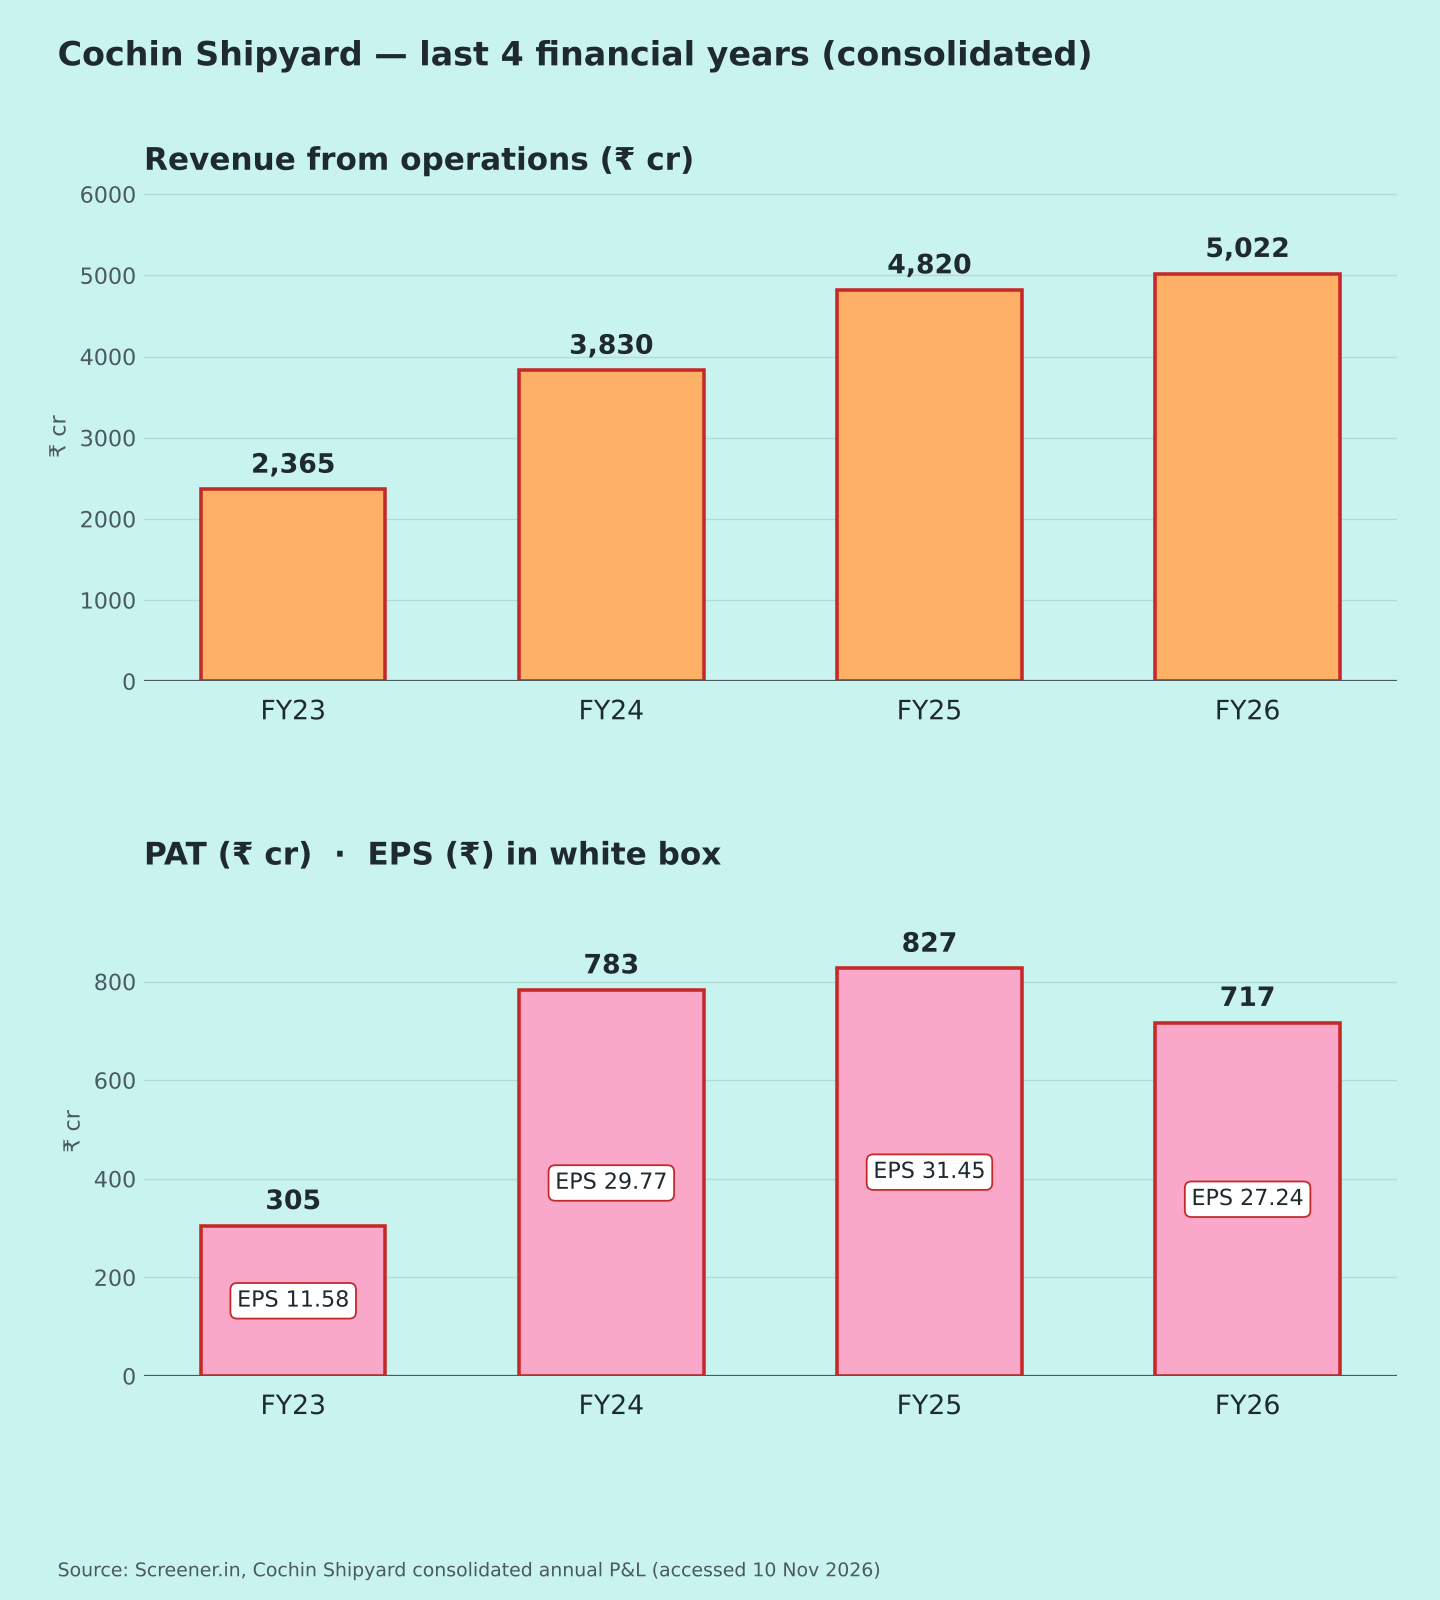
Charts: (1) 5 quarters revenue & PAT with EPS [2][3]; (2) FY23–FY26 [3]; (3) margins [2][3]; (4) segments [2].