Consolidated figures, ₹ crore. Results were filed on 4 Nov 2026.
EBITDA is the company's figure before forex and other income. YoY/QoQ % and margins are my calculations.
| Metric | Q2 FY27 | YoY | QoQ |
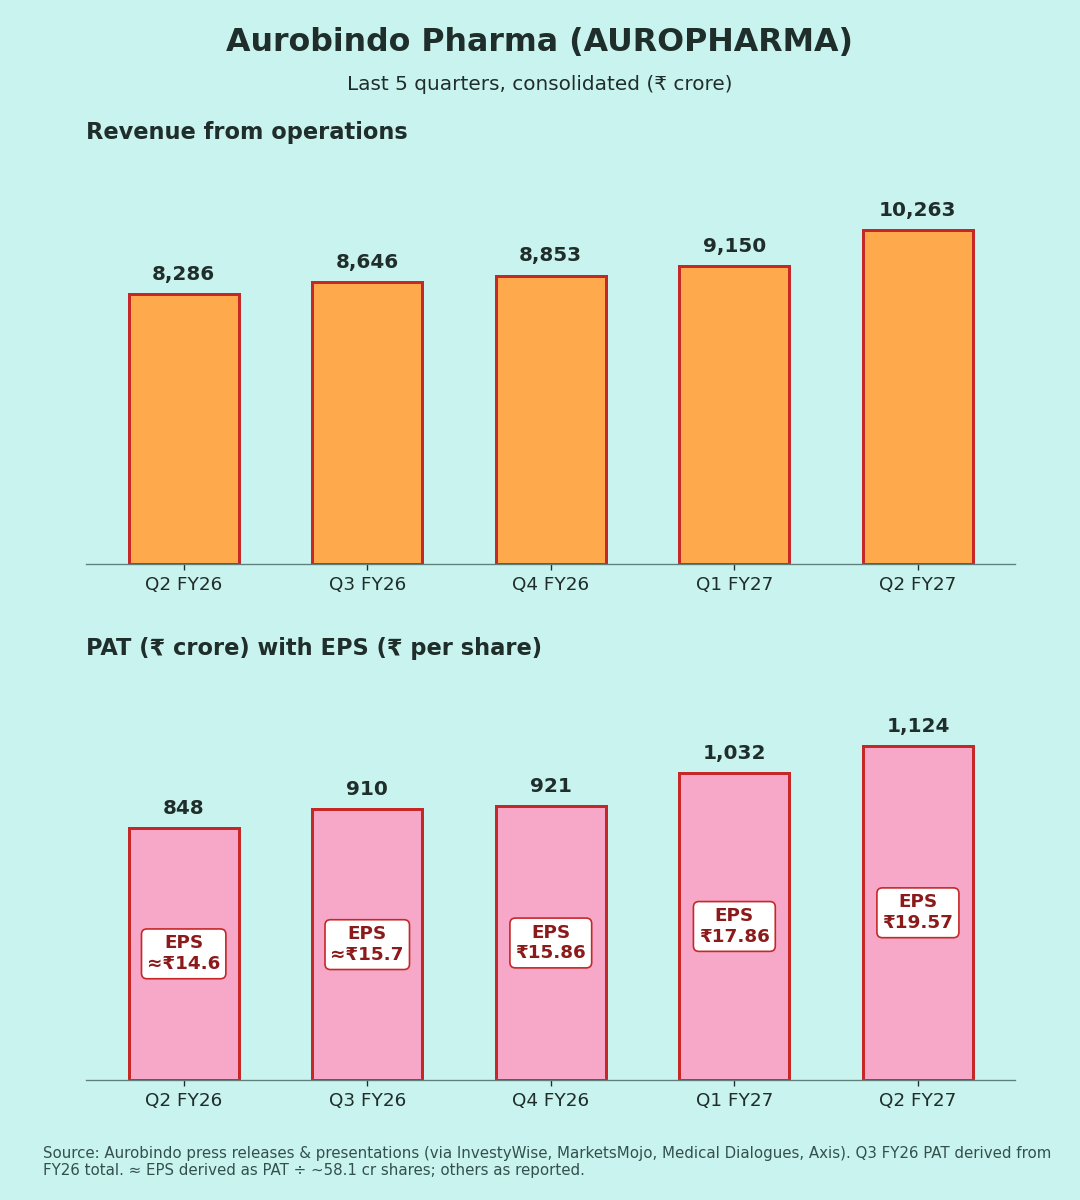
| Revenue from ops | 10,263 | +23.9% | +12.2% |
| EBITDA | 2,156 | +28.5% | +12.2% |
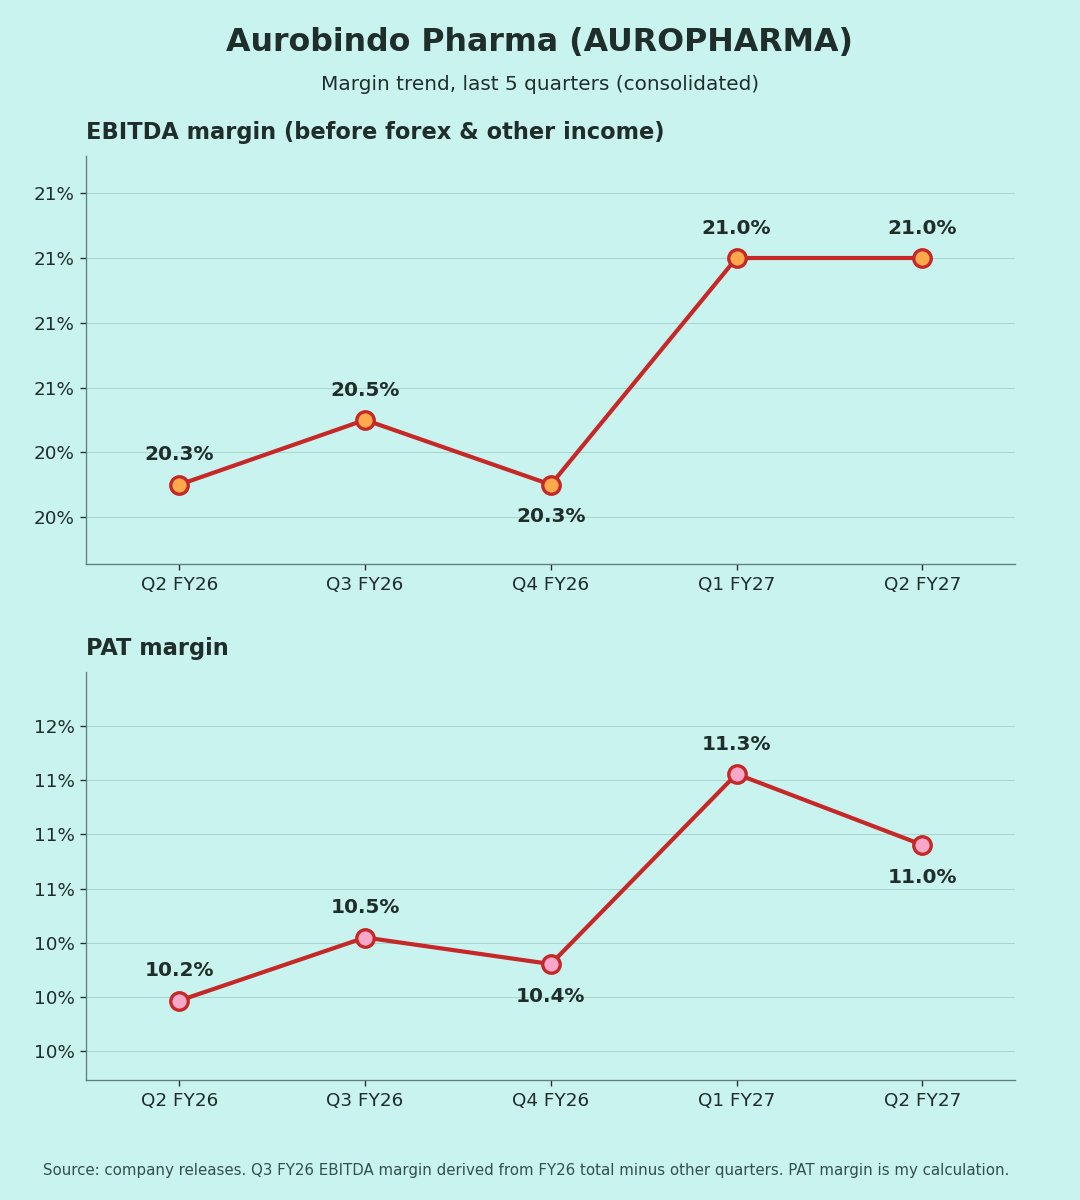
| EBITDA margin | 21.0% | 20.3% | 21.0% |
| PBT | 1,691 | +32.7% | – |
| PAT | 1,124 | +32.5% | +8.9% |
| PAT margin | 11.0% | 10.2% | 11.3% |
| EPS (₹) | 19.57 | ~+34% | +9.6% |
Margin rows show the year-ago and last-quarter values.
Quality of earnings
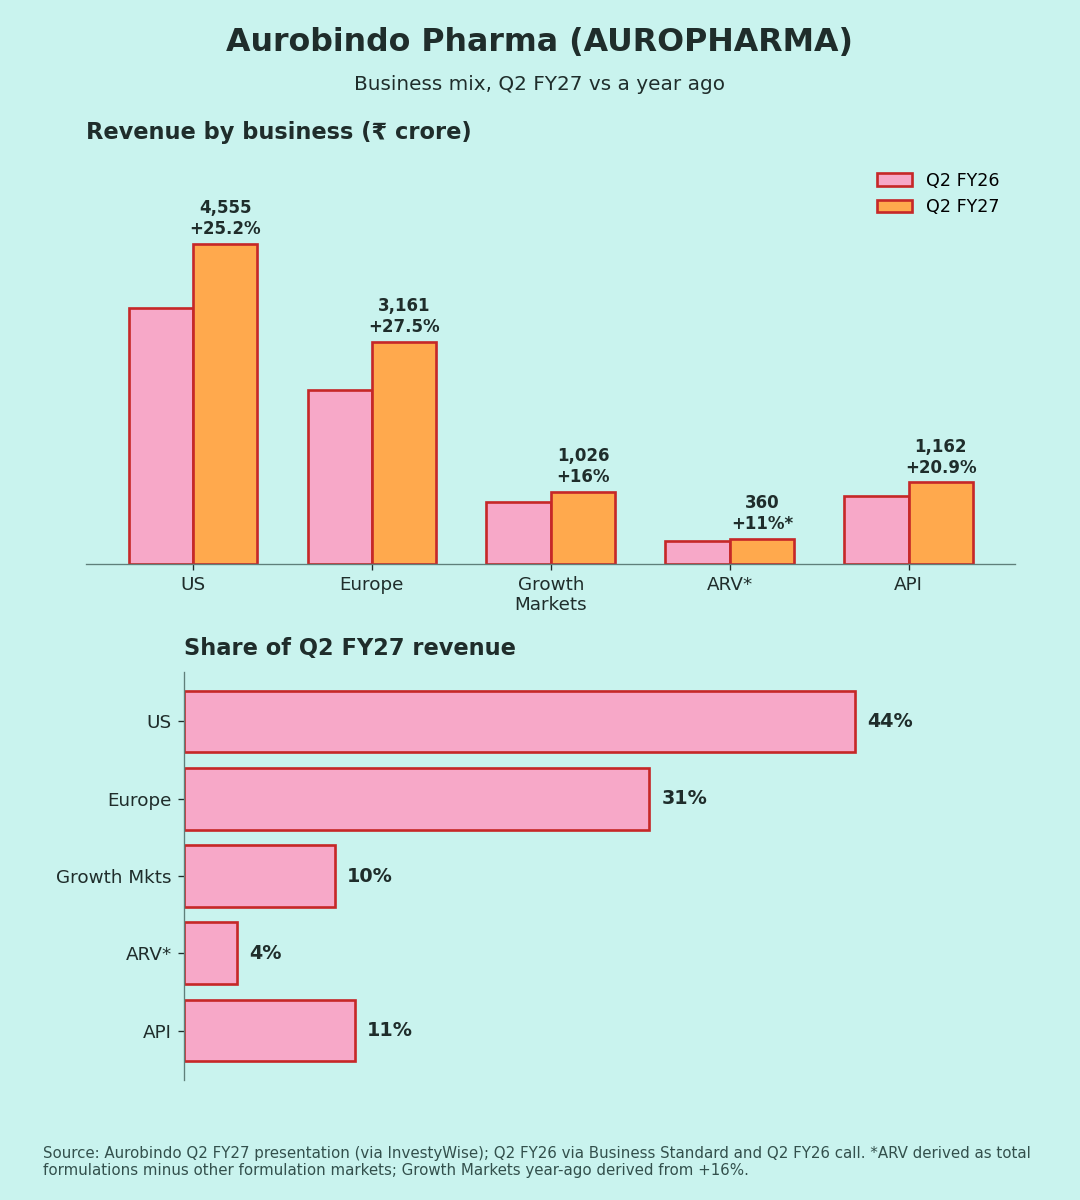
This was the company's highest-ever quarterly revenue and EBITDA [1]. Revenue grew in every business:
- US: +25.2% to ₹4,555 cr
- Europe: +27.5% to ₹3,161 cr
- Growth Markets: +16% to ₹1,026 cr
- ARV: grew YoY; no figure given in my sources (₹360 cr by my calculation from the formulations total)
- API: +20.9% to ₹1,162 cr
Part of the US growth is acquired. Aurobindo completed the Lannett acquisition during the quarter [1]. Management says US revenue excluding gRevlimid grew 20% QoQ, helped by Lannett, volume gains and injectables [1]. The split between organic and acquired growth isn't given.
Profit grew a bit faster than EBITDA. PBT rose 32.7% [1]. The tax rate was ~33.5%, about the same as a year ago (my calculation). I don't have other income or forex lines, and no exceptional item is mentioned.
EPS: ₹19.57 [2]. It rose slightly faster than PAT. The implied share count (~57.5 cr) is a little lower than before (~58.1 cr), and I couldn't confirm why (my calculation).
Base effect: Q2 FY26 was a modest quarter, with US revenue up only 3% YoY [5]. That flatters the YoY growth somewhat. QoQ growth (+12% revenue, +9% PAT) is the cleaner read.
Margins (Chart 3)
EBITDA margin over five quarters: 20.3% → 20.5% → 20.3% → 21.0% → 21.0% [1][4][6]. The margin held steady even as revenue rose 12% QoQ.
Guidance: what changed
- FY27 (reaffirmed after Q1 in August): double-digit revenue growth, EBITDA margin above 21%, and EBITDA above ₹8,000 cr [7].
- H1 progress: revenue ₹19,413 cr (+20%) and EBITDA ₹4,078 cr (21.0%). So H2 needs only ~₹3,920 cr of EBITDA to cross ₹8,000 cr (my calculation).
- Margin: at exactly 21.0%, not yet above it.
- New products: 10 US launches, including gAdvair and ADQUEY, the company's first new chemical entity [1].
- Cash: net cash fell to ~US$189 mn from US$317 mn in March, after the Lannett deal and capex [1][6].
- Q2 call: no coverage found at writing.
Positives
- Every business grew YoY [1][2]
- EBITDA margin steady at 21% [2]
- On track for the ₹8,000 cr+ EBITDA target (my calculation)
Concerns
- Organic vs acquired US growth not split [1]
- Net cash down after the acquisition [1][6]
- Tax rate around 33% (my calculation)
Things to track in Q3 FY27
- US growth excluding Lannett
- Margin moving above 21%, per guidance
- Net cash trend after acquisitions and capex
Not a buy/sell recommendation. I am not a SEBI-registered analyst. Facts are sourced; opinions are labelled.
Sources [1] InvestyWise – Q2 FY27 earnings presentation · [2] InvestyWise – Q2 FY27 results release · [3] Aurobindo – Q1 FY27 press release · [4] Medical Dialogues – Q4 FY26 & FY26 · [5] Business Standard – Q2 FY26 · [6] Quartr – Q4 FY26 summary · [7] Axis Securities – Q1 FY27 note · [8] MarketsMojo – Q3 FY26 revenue · [9] LatestLY/PTI – FY23–FY24 · [10] Business Standard – FY25 · [11] Upstox – FY23 EPS · [12] Aurobindo – May 2025 presentation (FY24–FY25 EPS) · [13] Alpha Spread – Q2 FY26 call
Charts:
(1) last 5 quarters revenue, PAT and EPS; Q3 FY26 PAT derived from the FY26 total;
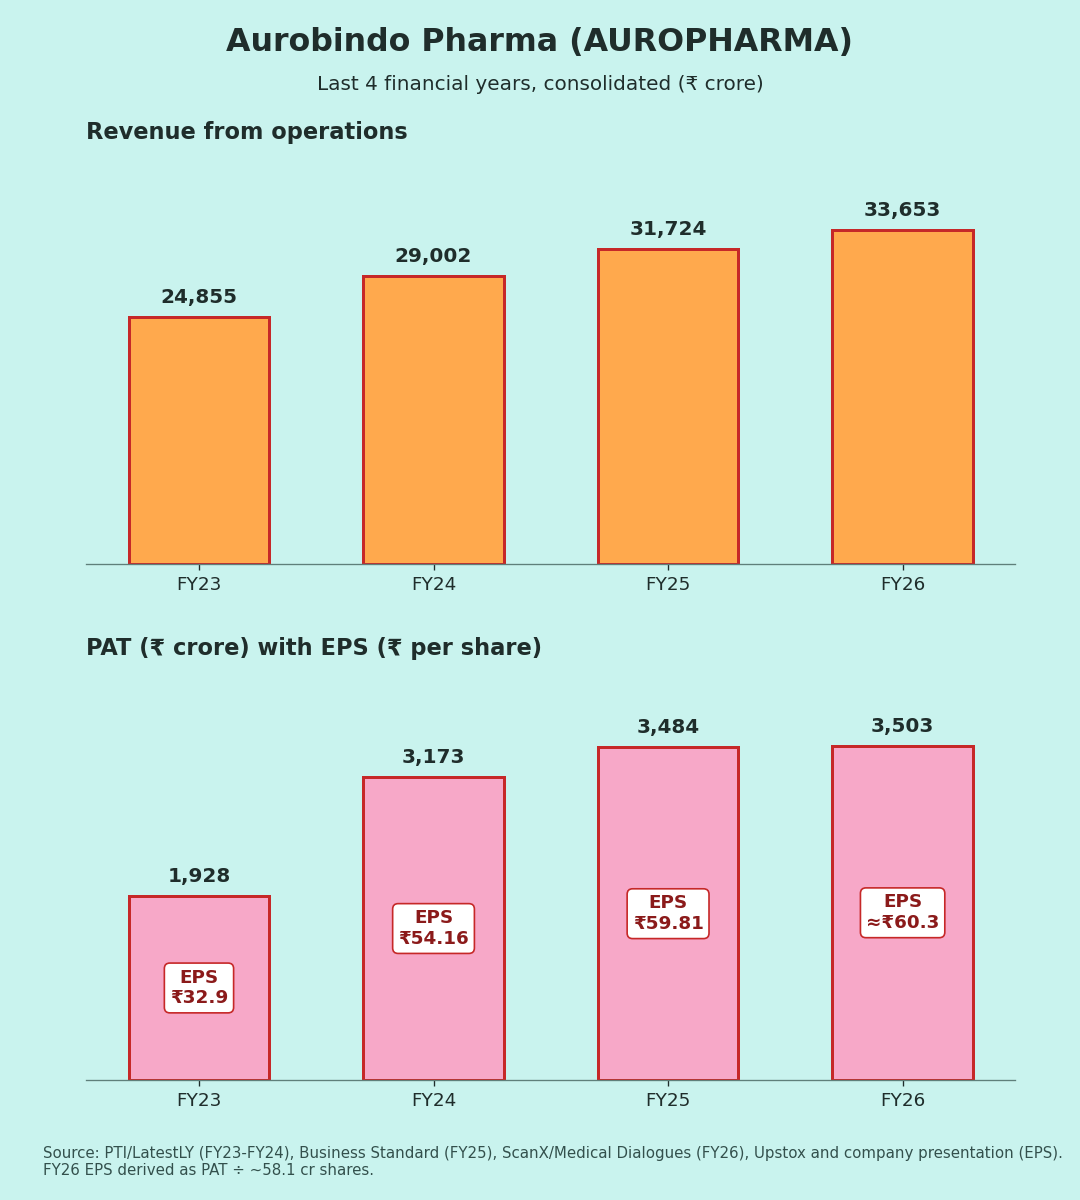
(2) FY23–FY26 revenue, PAT and EPS ; FY26 EPS derived;
(3) EBITDA and PAT margin (Q3 FY26 derived);
(4) business mix, with ARV and year-ago Growth Markets derived.