Consolidated figures, ₹ crore. This is the first full quarter after Aster DM Healthcare merged with Quality Care India (QCIL), effective 1 Jul 2026 [1]. The company compares against pro forma Q2 FY26 figures (Aster + QCIL combined) [2]. I use those throughout. "Normalised PAT" is after minority interest and excludes merger costs and associates' losses [1]. EBITDA excludes other income [2]. EPS wasn't in coverage.
| Metric | Q2 FY27 | YoY (vs pro forma) | QoQ |
| Revenue from ops | 2,829 | +19% | +8.8% |
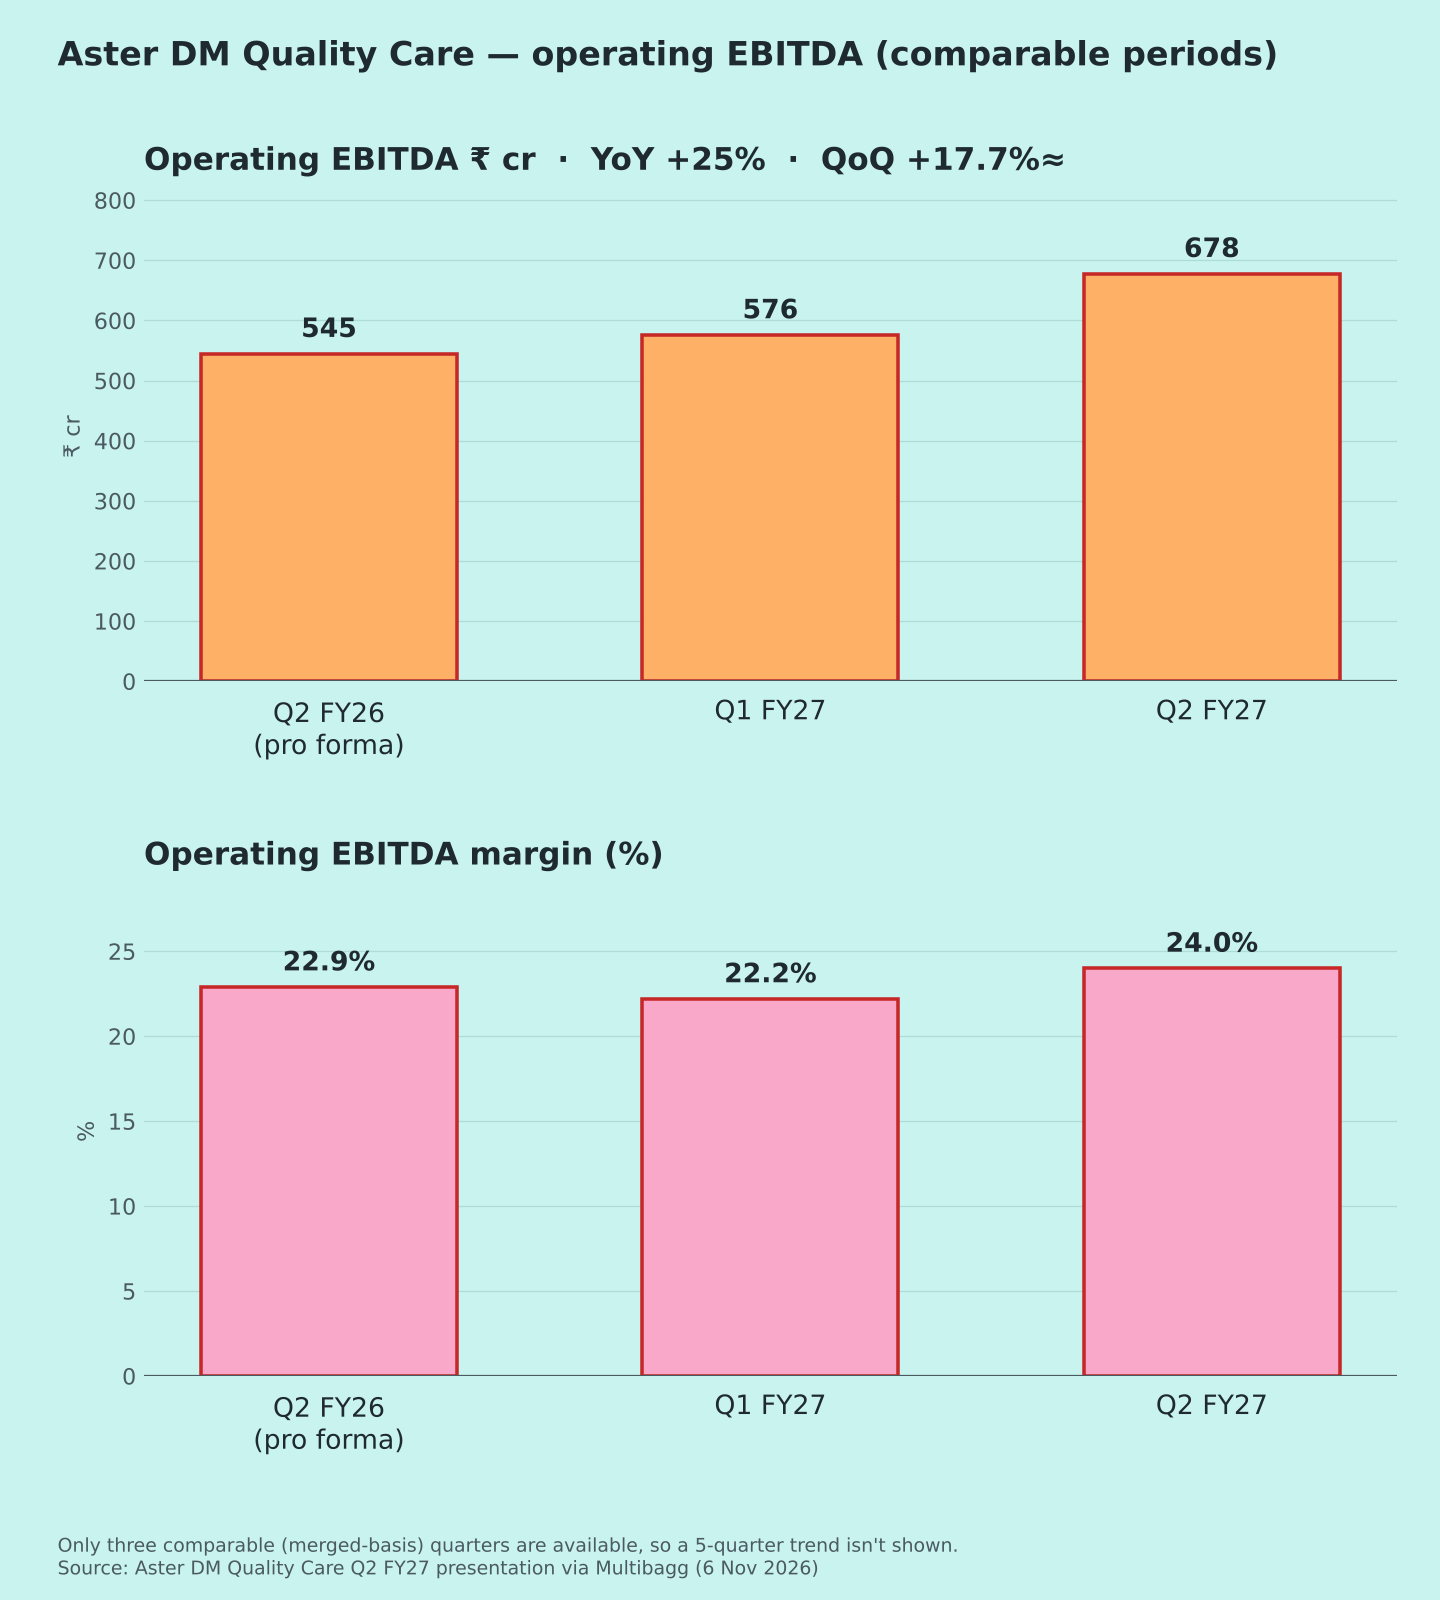
| Operating EBITDA | 678 | +25% | +17.7% |
| EBITDA margin | 24.0% | 22.9% | 22.2% |
| Normalised PAT | 281 | +34% | ≈+60% |
| Normalised PAT margin | 9.9% | 8.8% | ≈6.8% |
| Reported consolidated PAT | 262 | — | — |
| Bed occupancy | 68% | 65% | — |
Margin and ratio rows show year-ago and last-quarter values; "—" = no comparable figure in coverage. ≈ Q1 normalised PAT = H1 ₹457 cr − Q2 ₹281 cr (my calculation). QoQ % are my calculations.
Source notes: Business Standard says profit "more than doubles to ₹262 crore" and revenue "grew twofold" [5]. Those compare with Aster's pre-merger numbers alone. Against the combined pro forma base, revenue grew 19% and normalised PAT 34% [1]. The ₹19 cr gap between reported (₹262 cr) and normalised (₹281 cr) PAT is merger costs and associates' losses; coverage doesn't split it [1].
Quality of earnings
- Merged growth isn't acquired growth. The YoY comparison uses the combined base, so growth is like-for-like [2].
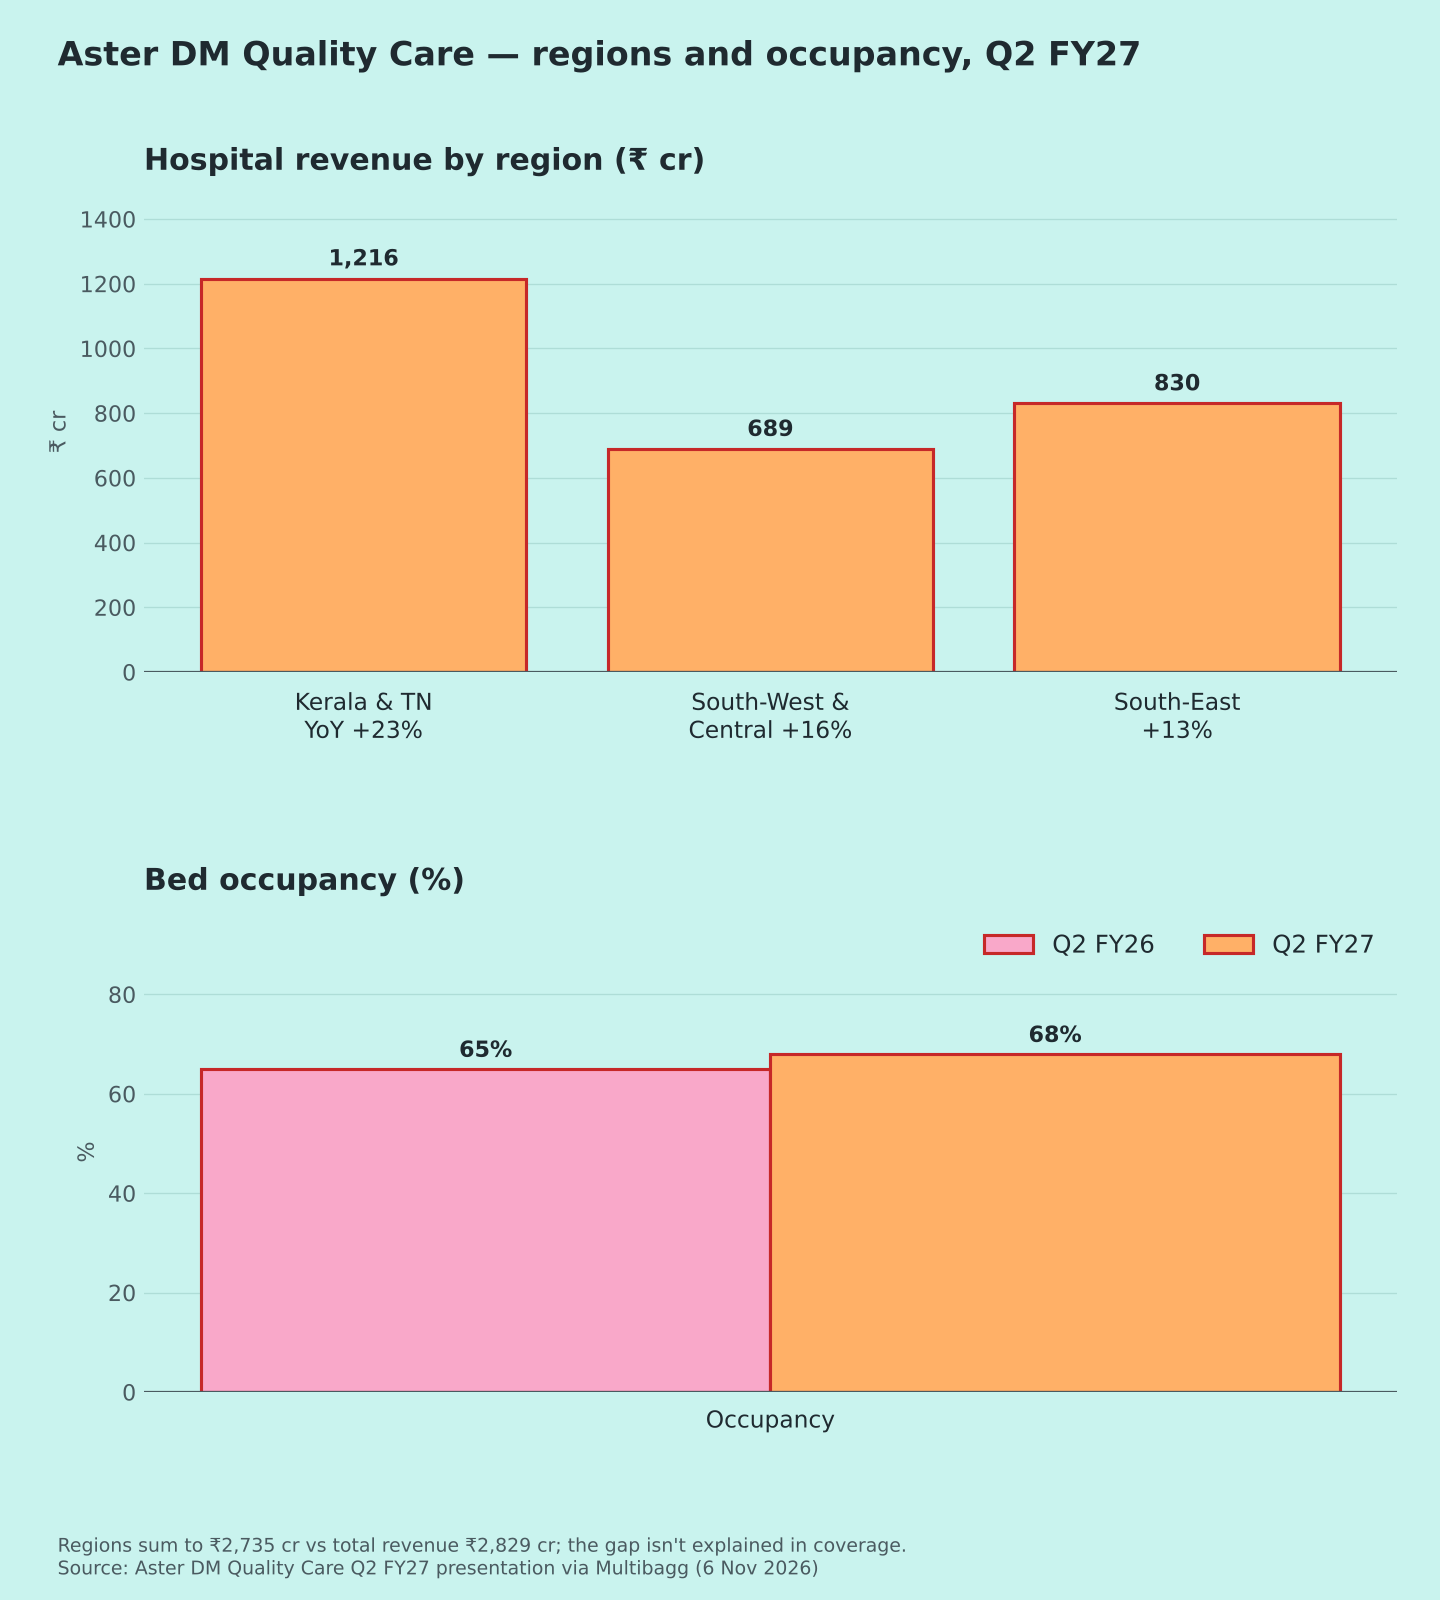
- Volume-led: patients +12%, occupancy up 3.4 points to 68%, operational beds +4% [2][3].
- Margins improved to 24.0%. ₹16.6 cr of merger synergies were realised in Q2, with ₹200 cr targeted in full (no date given) [4].
Margins
Operating EBITDA margin: 22.9% (pro forma) → 22.2% → 24.0% [2]. Only three comparable quarters exist.
Regions and operations (Chart 2)
- Kerala & Tamil Nadu: ₹1,216 cr (+23%), occupancy 71%.
- South-West & Central: ₹689 cr (+16%). South-East: ₹830 cr (+13%).
- Medical tourism: revenue +36%. Cancer, cardiac, neuro, gastro and ortho specialties are 53% of revenue (+16%).
Plans and balance sheet [2][3]
- Beds: to rise from 10,840 to 15,070. The plan adds 454 beds in FY27 and 1,330 in FY28.
- Leverage: net debt plus lease liabilities is 1.72x EBITDA (after lease accounting).
- No numeric FY27 margin guidance was given.
Positives
- Occupancy and margins up [2]
- Synergies starting to show [4]
Concerns
- Merger integration and costs [1]
- Heavy bed-expansion plan (my view)
Things to track in Q3 FY27
- Synergy run-rate vs ₹200 cr
- Occupancy as new beds open
- Reported vs normalised PAT gap
- Bed additions vs the FY27 plan
Not a buy/sell recommendation. I am not a SEBI-registered analyst. Facts are sourced; opinions are labelled.
Sources [1] Multibagg – Q2 revenue & normalised PAT · [2] Multibagg – Q2 presentation · [3] Multibagg – Q2 results presentation · [4] Multibagg – synergies · [5] Business Standard – Q2 profit · [6] Whalesbook – Q2 revenue · [7] Screener.in – consolidated
Charts: (1) operating EBITDA, comparable periods [2] (5) regions & occupancy [2][3].