All figures consolidated, ₹ crore unless stated. Results released on 30 Oct 2026. EBITDA is the company's "adjusted" figure, which excludes mark-to-market forex gains and losses. YoY/QoQ % and margins are my calculations;
| Metric | Q2 FY27 | YoY | QoQ |
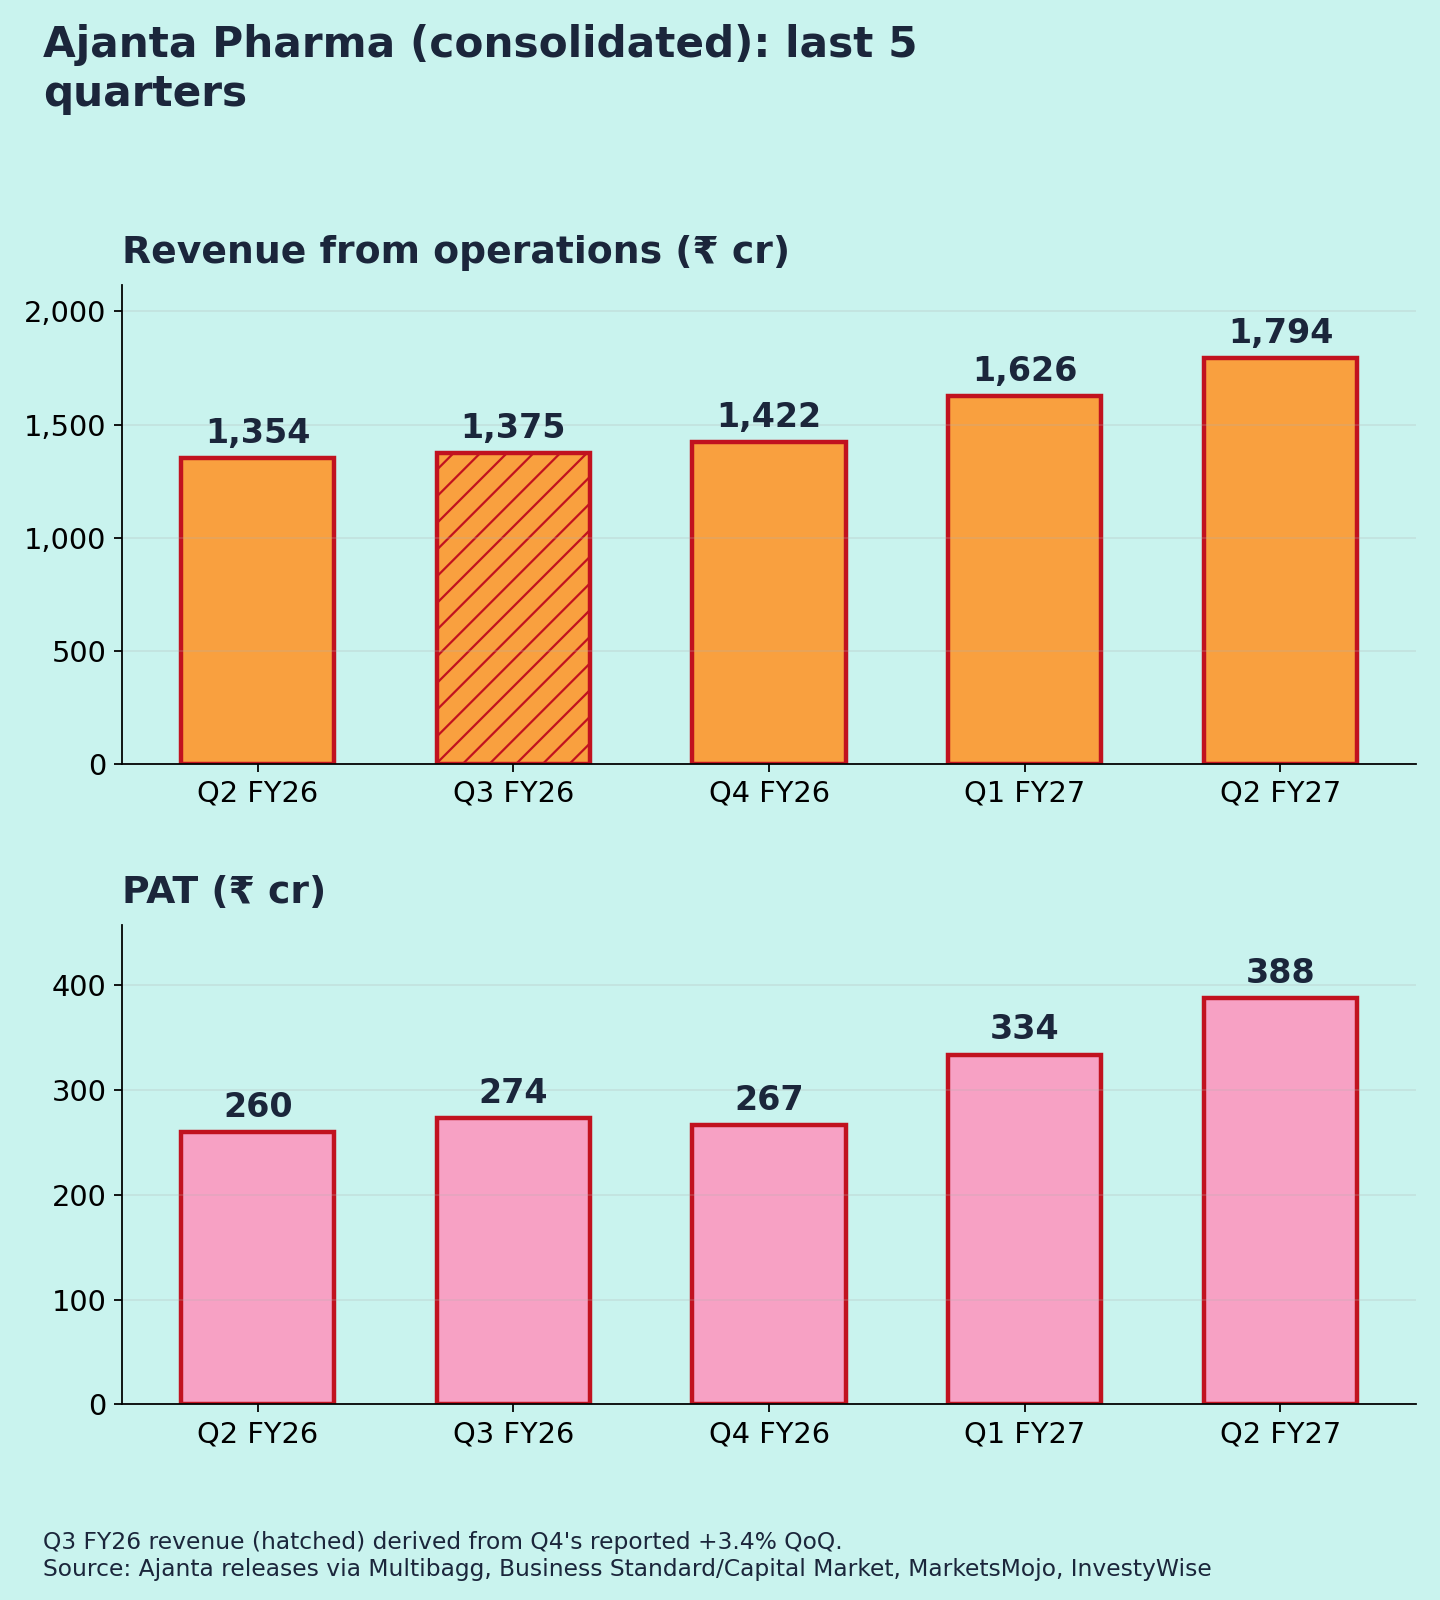
| Revenue from ops | 1,794 | +32.5% | +10.3% |
| EBITDA (adjusted) | 543 | +47% | +19.6% |
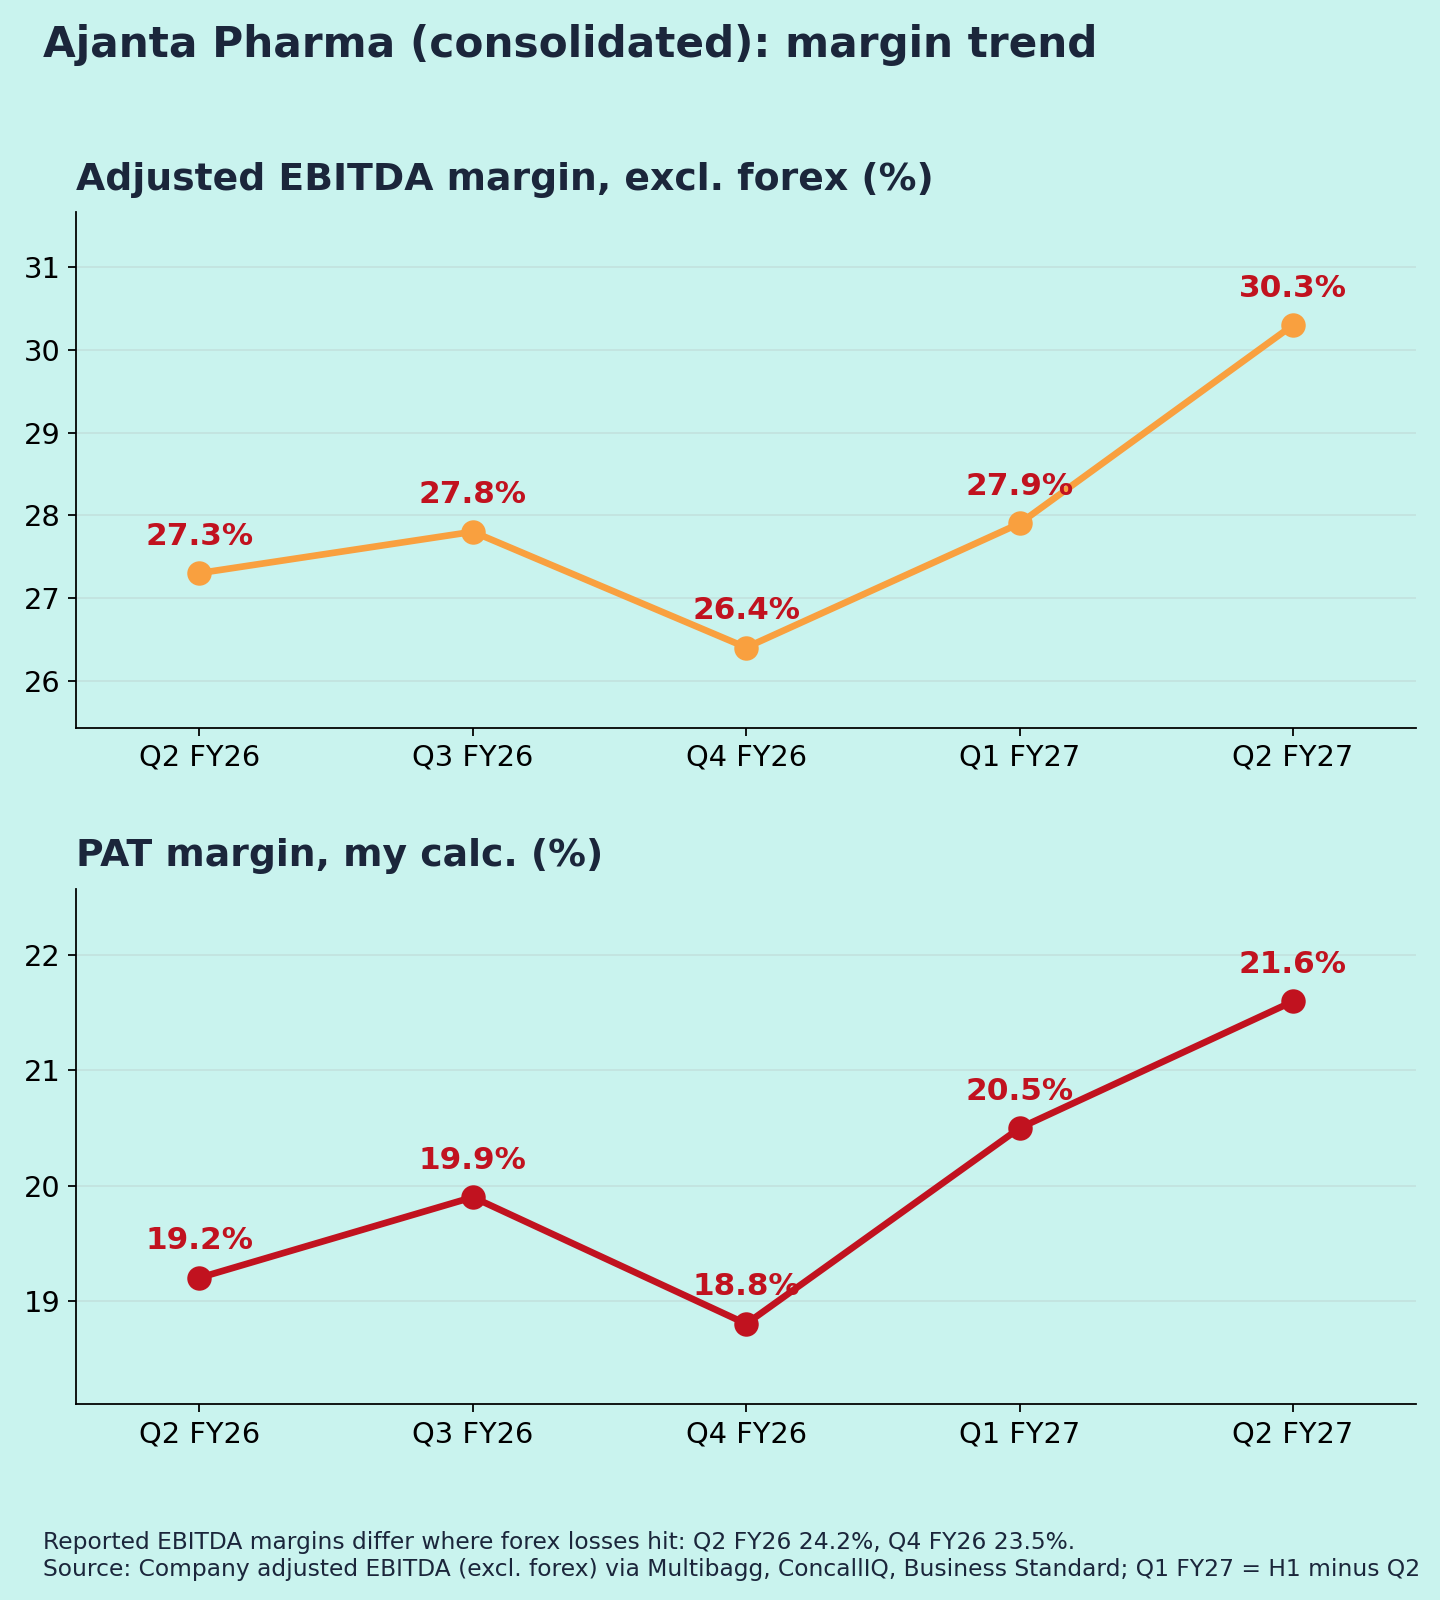
| EBITDA margin (adjusted) | 30.3% | 27.3% | 27.9% |
| EBITDA margin (reported) | 30.5% | 24.2% | – |
| PAT | 388 | +49.1% | +16.2% |
| PAT margin | 21.6% | 19.2% | 20.5% |
| Gross margin | 78.5% | 76.6% | – |
For margin rows, the YoY and QoQ columns show the prior-period value.
Quality of earnings
This is a strong, broad-based quarter:
- Branded generics: ₹1,182 cr, +23%. India grew 16% to ₹504 cr.
- US generics: ₹484 cr, +41%.
- Africa institution business: ₹116 cr, +259%.
One caution: the Africa institution business is tender-based (government and aid-agency orders) and lumpy (my view). A jump like +259% may not repeat every quarter.
Reported profit growth is cleaner than it looks. Q2 FY26 reported EBITDA (₹328 cr) was depressed by a forex loss; on the adjusted basis it was ₹369 cr [2]. So adjusted EBITDA grew 47%, not the 66% the reported numbers imply.
Gross margin improved to 78.5% from 76.6% (my calculation from [2]), which helped margins. PBT was ₹535 cr, implying a normal tax rate of about 27% [2].
Margins (Chart 3)
Adjusted EBITDA margin over five quarters: 27.3% → 27.8% → 26.4% → 27.9% → 30.3%. Q2 FY27 is a clear step up, helped by a better mix (US and Africa) and operating leverage (interpretation).
Guidance: what changed
- FY27 guidance (set in May): revenue growth of 16–18%, EBITDA margin of 27% (±1%), gross margin around 77% [7].
- H1 so far: revenue +29% and adjusted EBITDA margin about 29% [3]. Both are ahead of guidance. No revised guidance was in the coverage I found.
- Pipeline: 17 US drug approvals pending [4]. A semaglutide (diabetes/obesity drug) partnership with Biocon was announced with Q4 FY26 results [8].
- R&D: H1 spend of ₹138 cr, against ₹119 cr last year [9].
Market reaction
The shares rose 2.67% to ₹3,552.10 on 30 Oct.
Positives
- Revenue +33% and PAT +49%, well above guidance [1][7]
- Every business is growing; US generics +41% [3]
- High returns: ROCE 41%, RoNW 31% [4]
Concerns
- Africa institution sales are lumpy
- Results above guidance raise the bar for H2 (my view)
- US pricing and FDA inspection risk is always present for exporters (my view)
Things to track in Q3 FY27
- Any upgrade to FY27 guidance
- US generics run-rate and new approvals
- Africa institution orders
- EBITDA margin vs the 27% guide
Not a buy/sell recommendation. Facts are sourced; opinions are labelled.
Sources [1] NewsBytes, 30 Oct 2026 · [2] Multibagg – Q2 FY27 presentation · [3] InvestyWise – Q2 FY27 · [4] Whalesbook – Q2 FY27 · [5] ConcallIQ – Q3 FY26 · [6] Business Standard/Capital Market – Q4 FY26 · [7] ScanX – FY27 guidance · [8] Whalesbook – Biocon deal · [9] Zee Business (Hindi) – R&D · [10] Business Standard – Q2 FY26 · [11] MarketsMojo – Q3/Q4 FY26 · [12] Business Standard/Capital Market – FY24 · [13] Screener – annual PAT
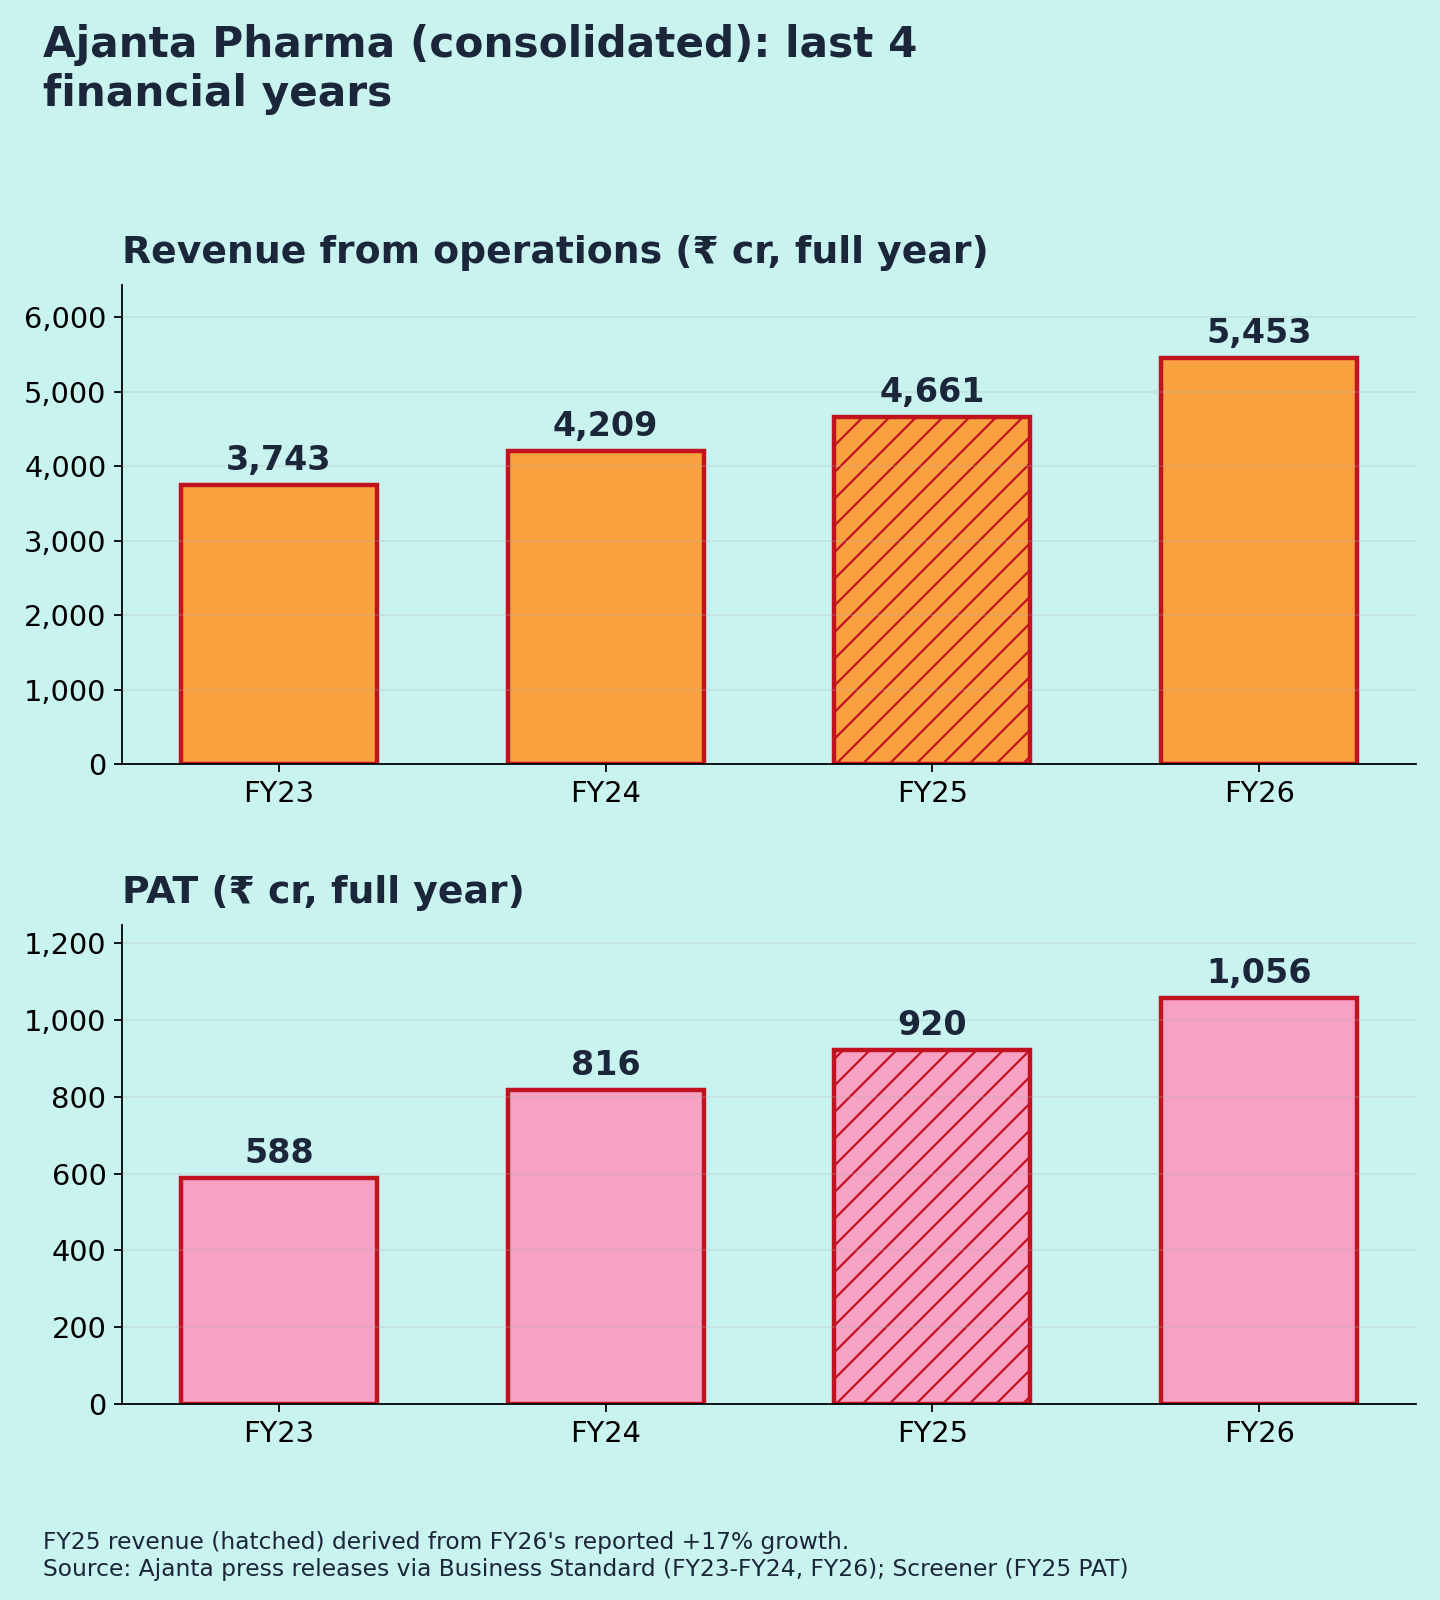
Charts: (1) last 5 quarters revenue & PAT; (2) FY23–FY26 revenue & PAT (FY25 revenue derived); (3) adjusted EBITDA marginand PAT margin (own calc.).