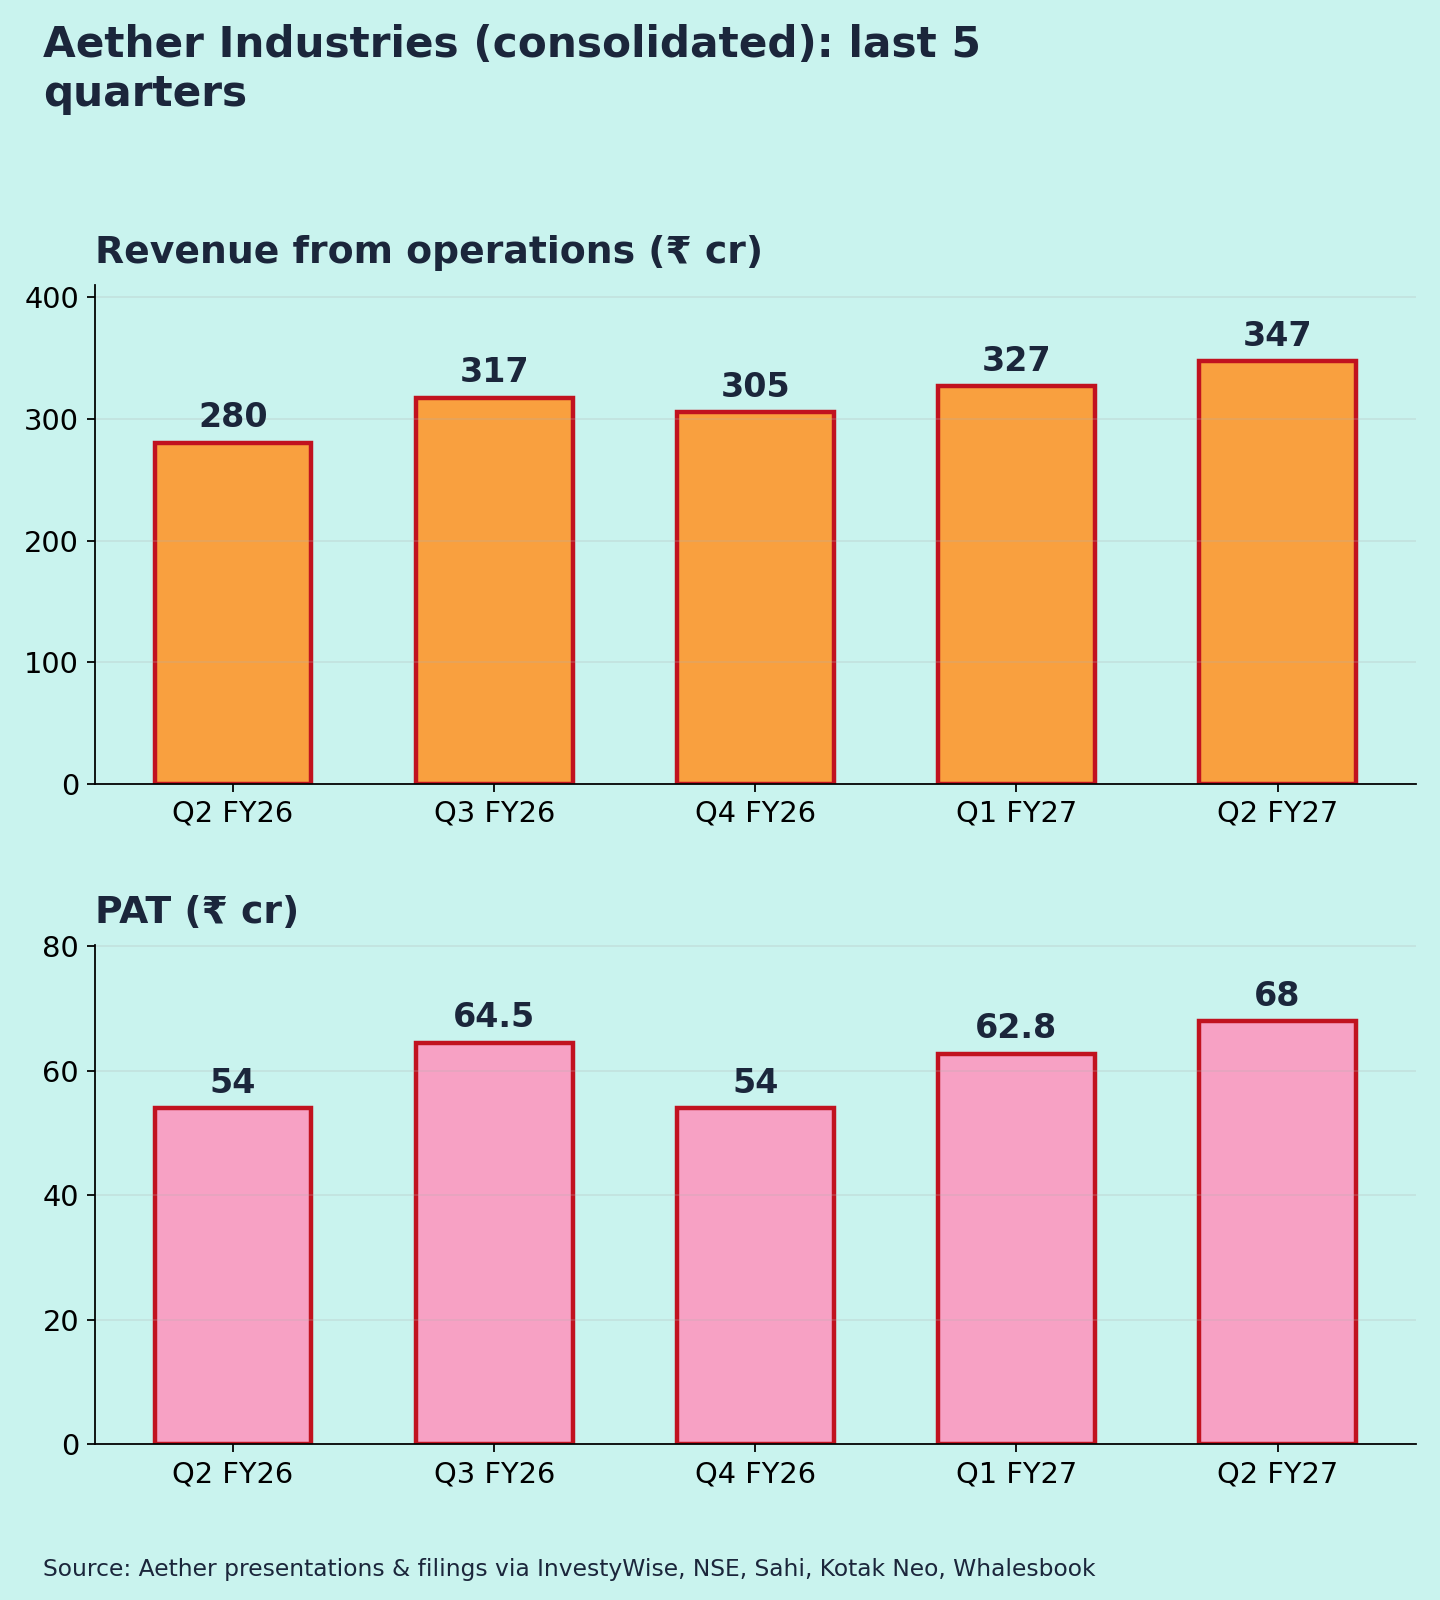
All figures consolidated, ₹ crore unless stated. Results released on 30 Oct 2026. YoY/QoQ % and margins are my calculations from reported numbers.
| Metric | Q2 FY27 | YoY | QoQ |
| Revenue from ops | 347.2 | +24.0% | +6.3% |
| EBITDA | 110.4 | +29.4% | +7.4% |
| EBITDA margin | 31.8% | 30.5% | 31.5% |
| PAT | 68.0 | +26.0% | +8.4% |
| PAT margin | 19.6% | 19.3% | 19.2% |
For margin rows, the YoY and QoQ columns show the prior-period value.
Quality of earnings
A steady, operational quarter: revenue +24%, EBITDA +29% and PAT +26% [2][3]. Coverage credits higher contract-manufacturing volumes.
The big change is the customer-industry mix:
- Oil & gas: 33.4% of revenue, up from 18.8% a year ago. It is now the largest segment.
- Pharma: 26.6%, down from 36.6%.
Management links the higher profitability to this mix shift. A larger share from one end-market adds concentration risk (my view).
Base effect: Q2 FY26 was a normal quarter (30.5% margin), so YoY growth isn't flattered.
Other income wasn't separately disclosed in the coverage I found. In Q1 it was about ₹8 cr, small relative to PAT (my calculation from [5]).
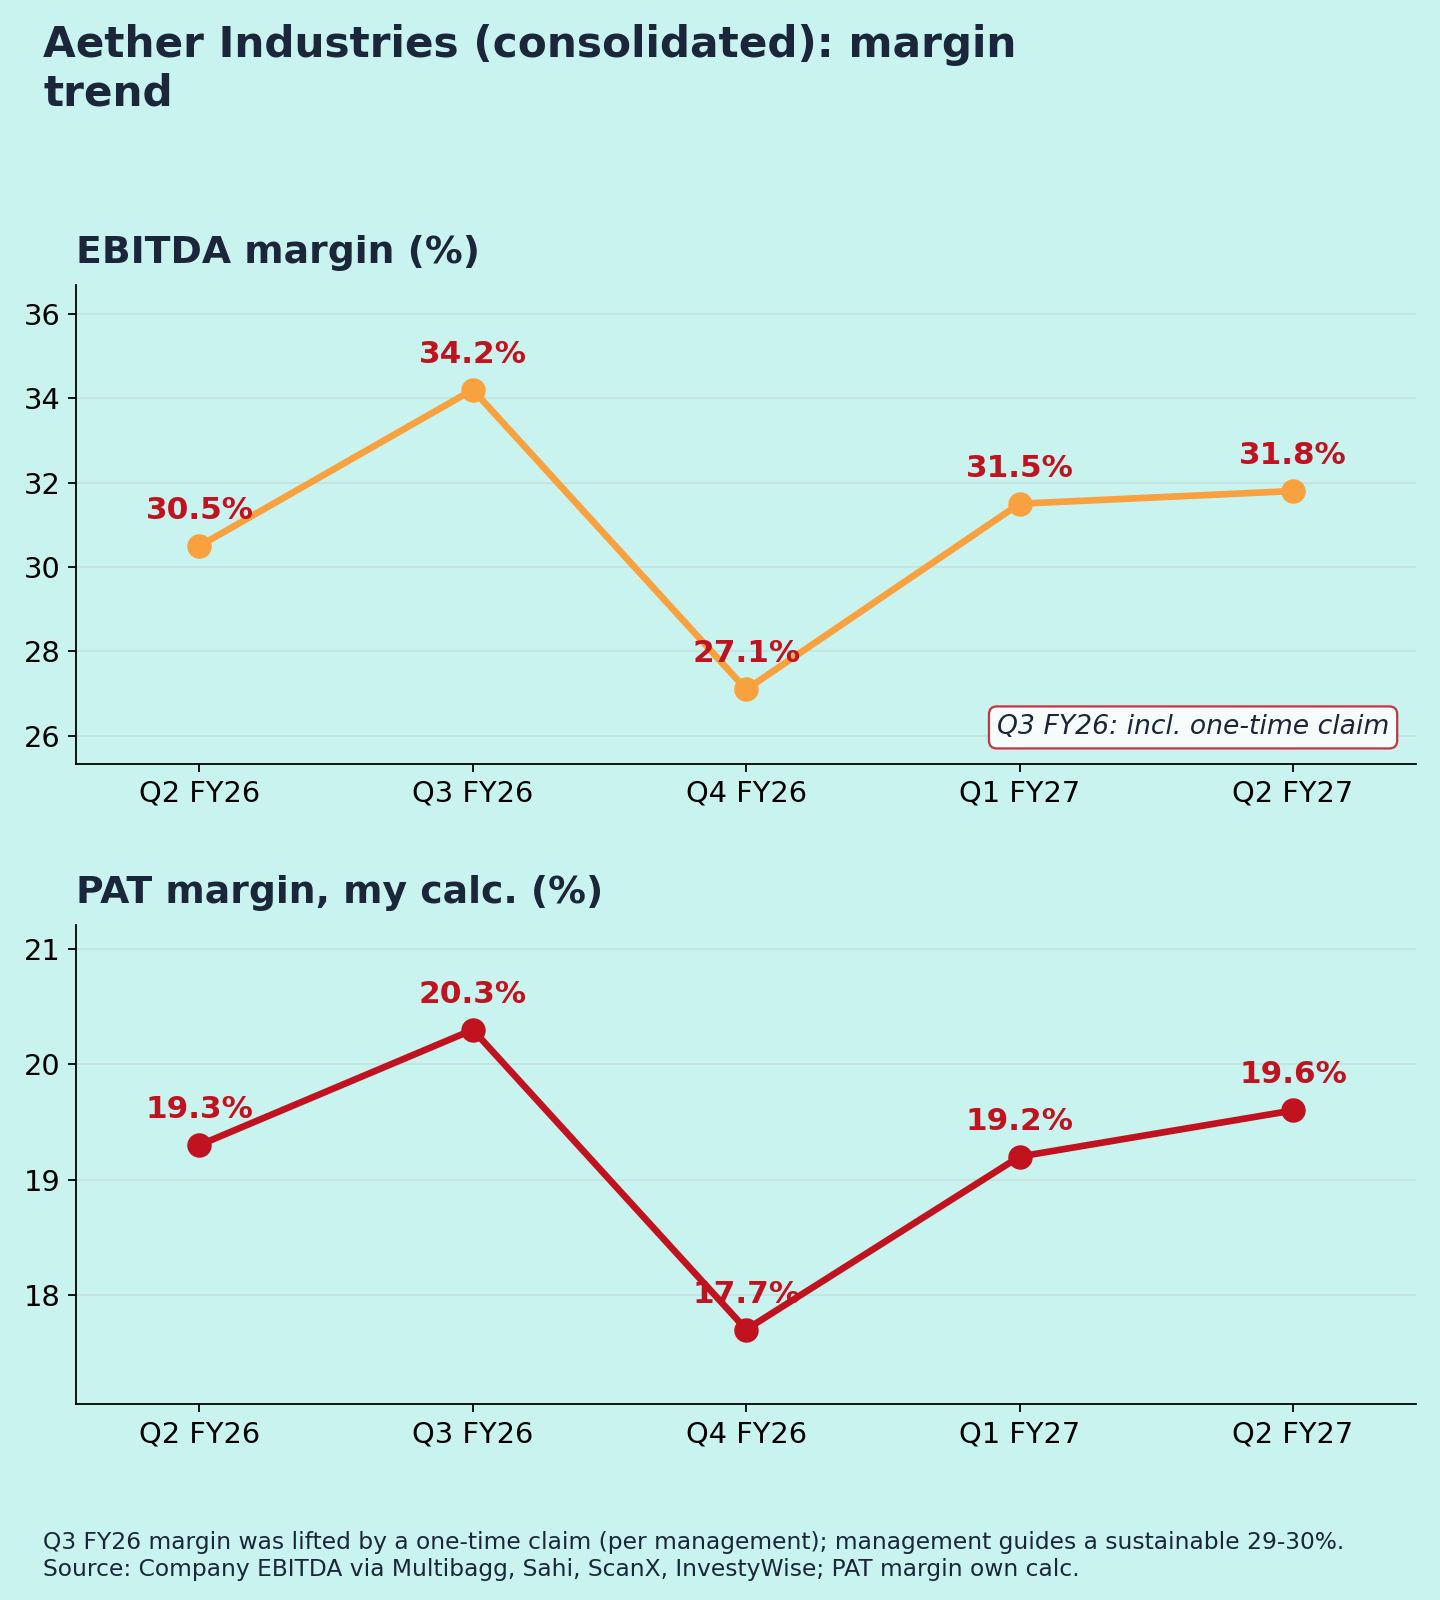
Margins (Chart 3)
EBITDA margin over five quarters: 30.5% → 34.2% → 27.1% → 31.5% → 31.8% [4][5][6][7]. The Q3 FY26 peak was helped by a one-time claim, per management [7]. Q4 FY26 was the low point. The last two quarters sit just above the 29–30% "sustainable" level management has guided [7].
Guidance: what changed
- Margin: management guides a sustainable EBITDA margin of 29–30% [7]. H1 FY27 is at about 31.6% (my calculation), slightly above.
- Revenue growth: about 25% was the stated target [8]. H1 is running at about 24% (my calculation from [2][5][9]), in line.
- Capacity: Site 4 utilisation was targeted to rise toward 75%, and two Site 5 production blocks were due by Q4 FY26 [8][9]. Progress updates weren't in the coverage I found.
- New contracts: new product launches in pharma and agrochemicals, alongside the oil & gas growth [2].
Positives
- Growth in line with the ~25% target; margins above guidance
- Contract-manufacturing volumes rising
- PAT growing in line with EBITDA
Concerns
- Growing dependence on oil & gas customers [4]
- Pharma share shrinking [4]
- The guided 29–30% margin implies limited further expansion (my view) [7]
- History of lumpy quarters (Q3 FY26 claim, Q4 FY26 dip) [6][7]
Things to track in Q3 FY27
- EBITDA margin vs the 29–30% guide
- Oil & gas share, and whether pharma recovers
- Site 4/5 utilisation
- New contract-manufacturing contracts
Not a buy/sell recommendation. I am not a SEBI-registered analyst. Facts are sourced; opinions are labelled.
Sources [1] Sahi, 30 Oct 2026 · [2] InvestyWise – Q2 FY27 presentation · [3] Whalesbook – Q2 FY27 · [4] Multibagg – segment mix · [5] Sahi – Q1 FY27 · [6] NSE – Q3 FY26 presentation · [7] ScanX – Q3 FY26 & margin guidance · [8] CompoundingAI – guidance tracking · [9] FilingReader – H1 FY26 · [10] Kotak Neo – Q4 FY26 · [11] Stockanalysis – annual · [12] Fyers – FY25-FY26 PAT
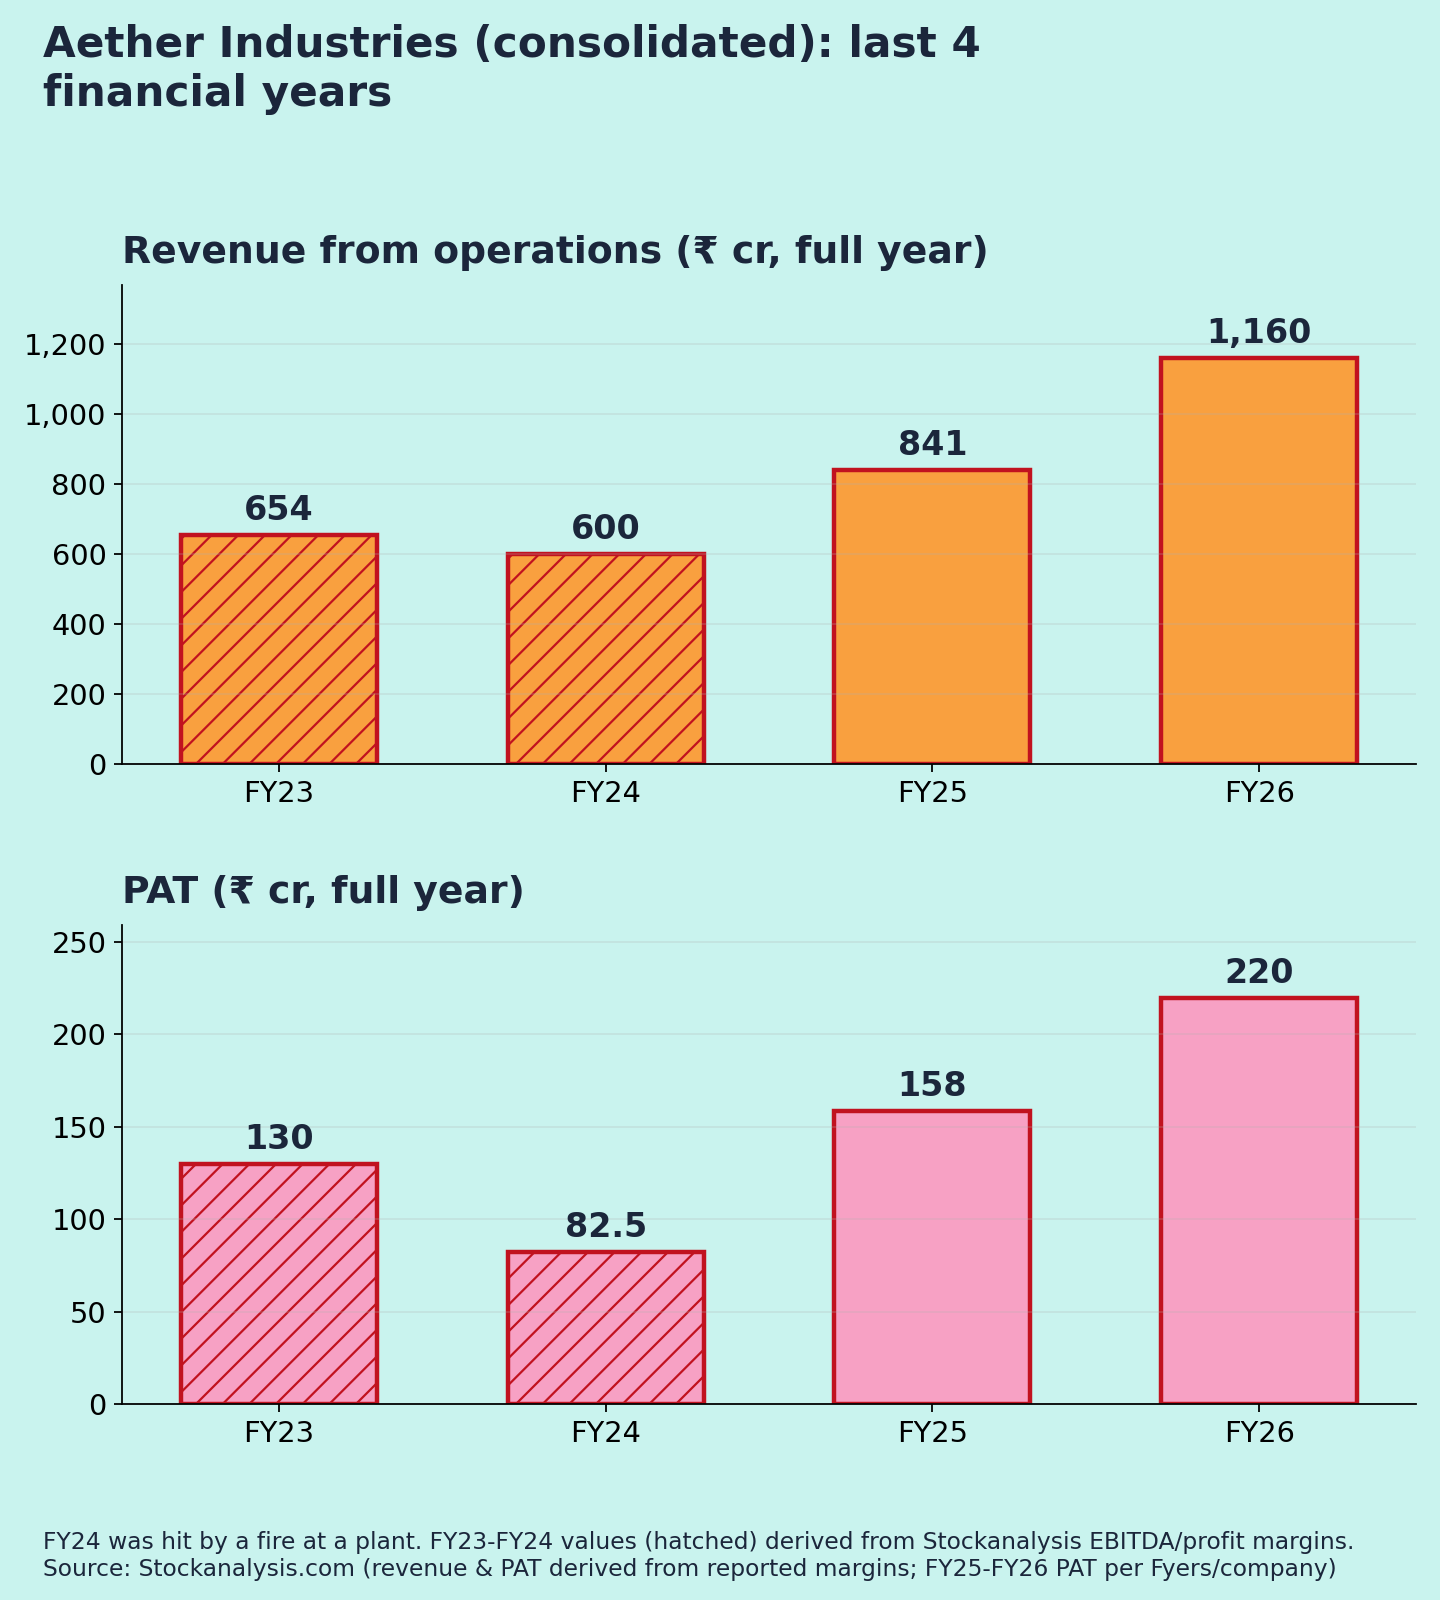
Charts: (1) last 5 quarters revenue & PAT (2) FY23–FY26 revenue & PAT(FY23–FY24 derived from reported margins); (3) EBITDA margin and PAT margin (own calc.).