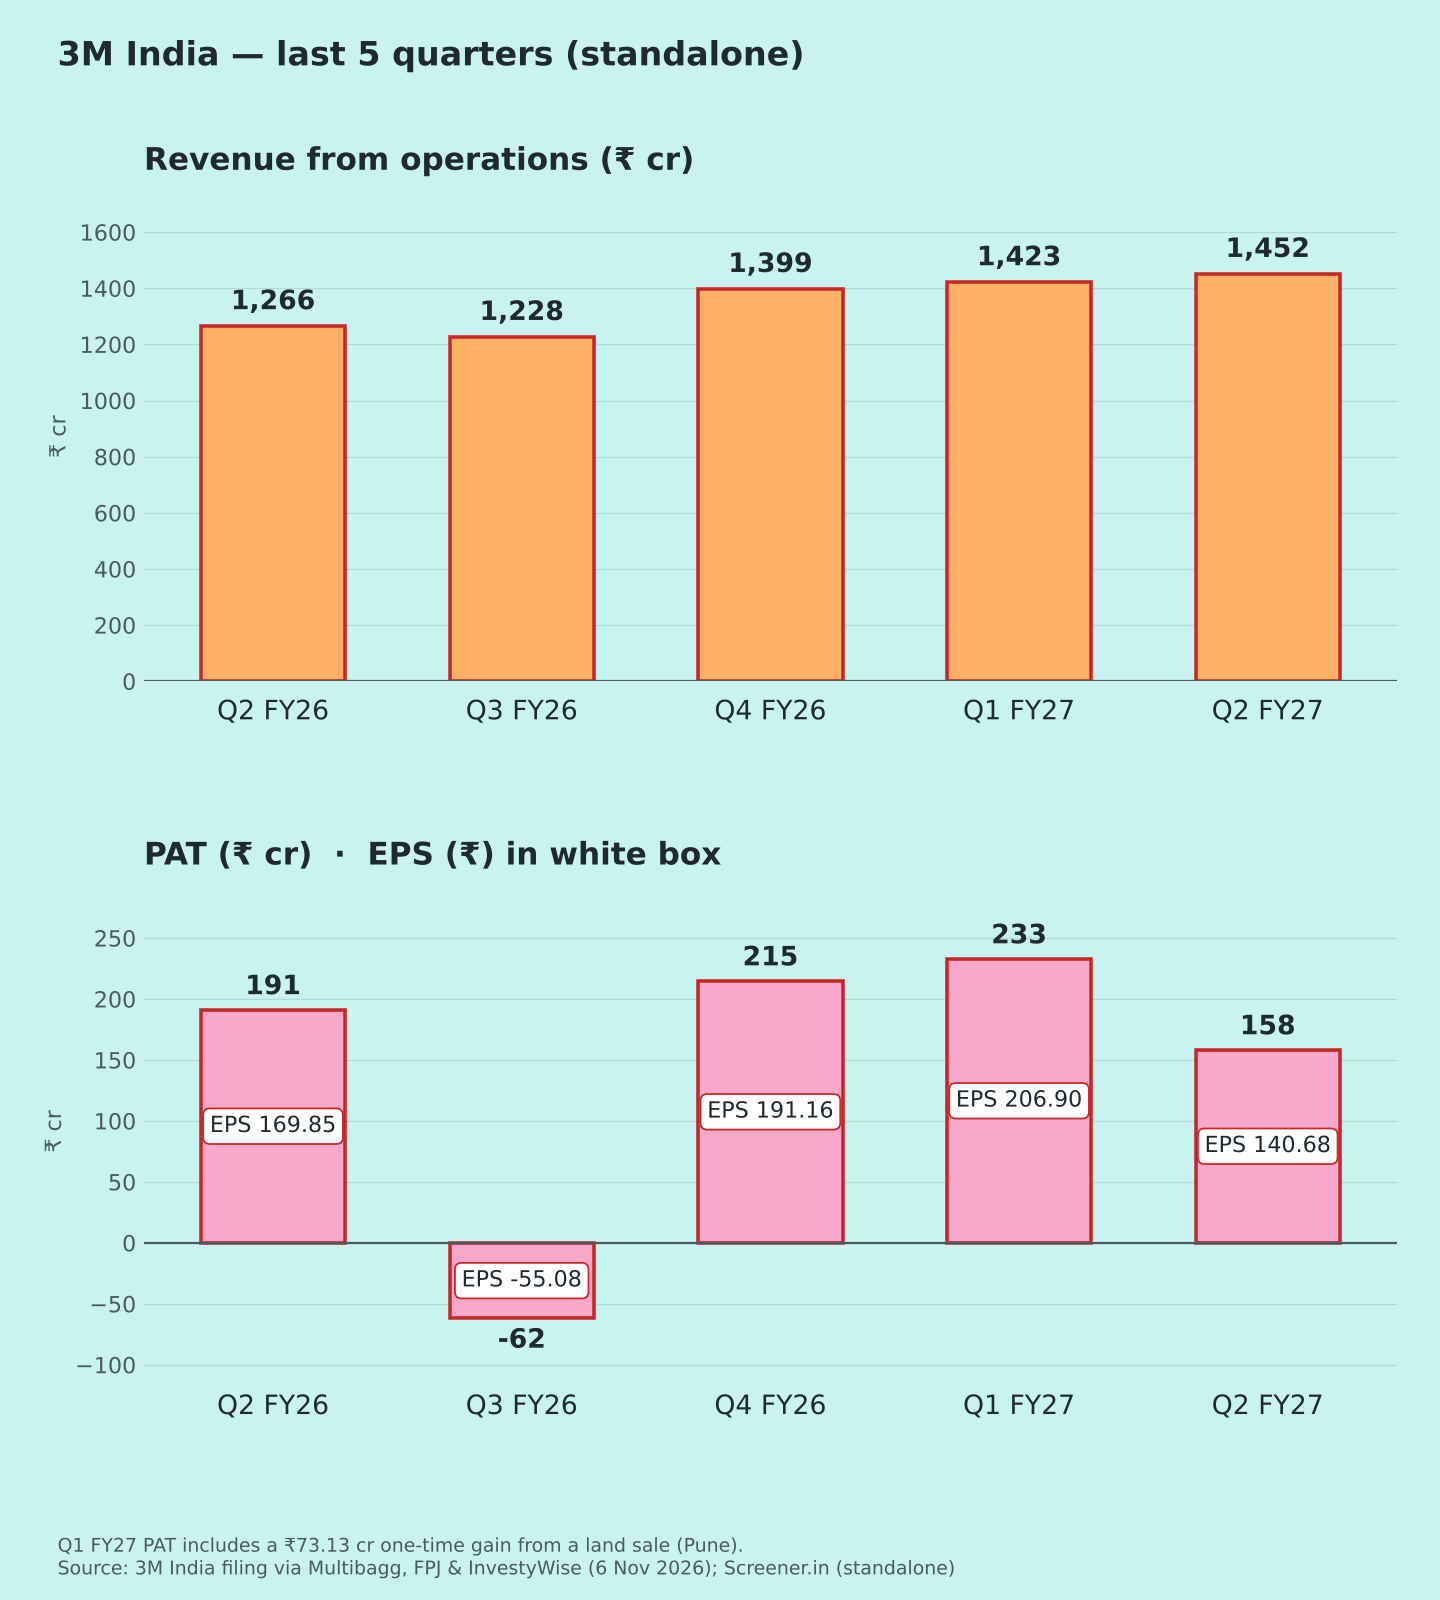
Standalone figures, ₹ crore. Results announced 6 Nov 2026. PAT = total PAT. YoY/QoQ % and margins are my calculations unless a source gives them.
| Metric | Q2 FY27 | YoY | QoQ |
| Revenue from ops | 1,452.49 | +14.7% | +2.1% |
| Total segment result | 205.42 | −14.7% | — |
| PBT | 212.32 | −15.3% | −7.3% (excl. Q1 land gain) |
| PAT | 158.48 | −17.2% | −32.0% |
| PAT margin | 10.9% | 15.1% | 16.4% |
| EPS (₹) | 140.68 | −17.2% | −32.0% |
| Other income / PBT | 5.3% | 4.9% | 5.1% (excl. land gain) |
Margin and ratio rows show year-ago and last-quarter values. "—" = Q1 segment total not in coverage. Q1 FY27 included a ₹73.13 cr one-time gain from selling land in Pune [1]. Sources: [1][2][5]
Quality of earnings
Revenue grew; costs grew faster. Total expenses rose 21.7% vs revenue +14.7% [1]:
- Purchases of traded goods +41.7%
- Raw materials +19.6%
- Finance cost ₹4.27 cr vs ₹2.32 cr
The company cited rupee depreciation and input-cost inflation linked to the Middle East crisis [3][4]. My view: a weaker rupee hurts more when a large share of goods is imported for resale.
Other income is small (~5% of PBT). The tax rate was ~25% vs ~24% (my calculation) [1]. There is no one-off in Q2, so the fall is operational.
The QoQ fall looks steep because Q1 had the land gain. Excluding it, PBT fell ~7% QoQ (my calculation).
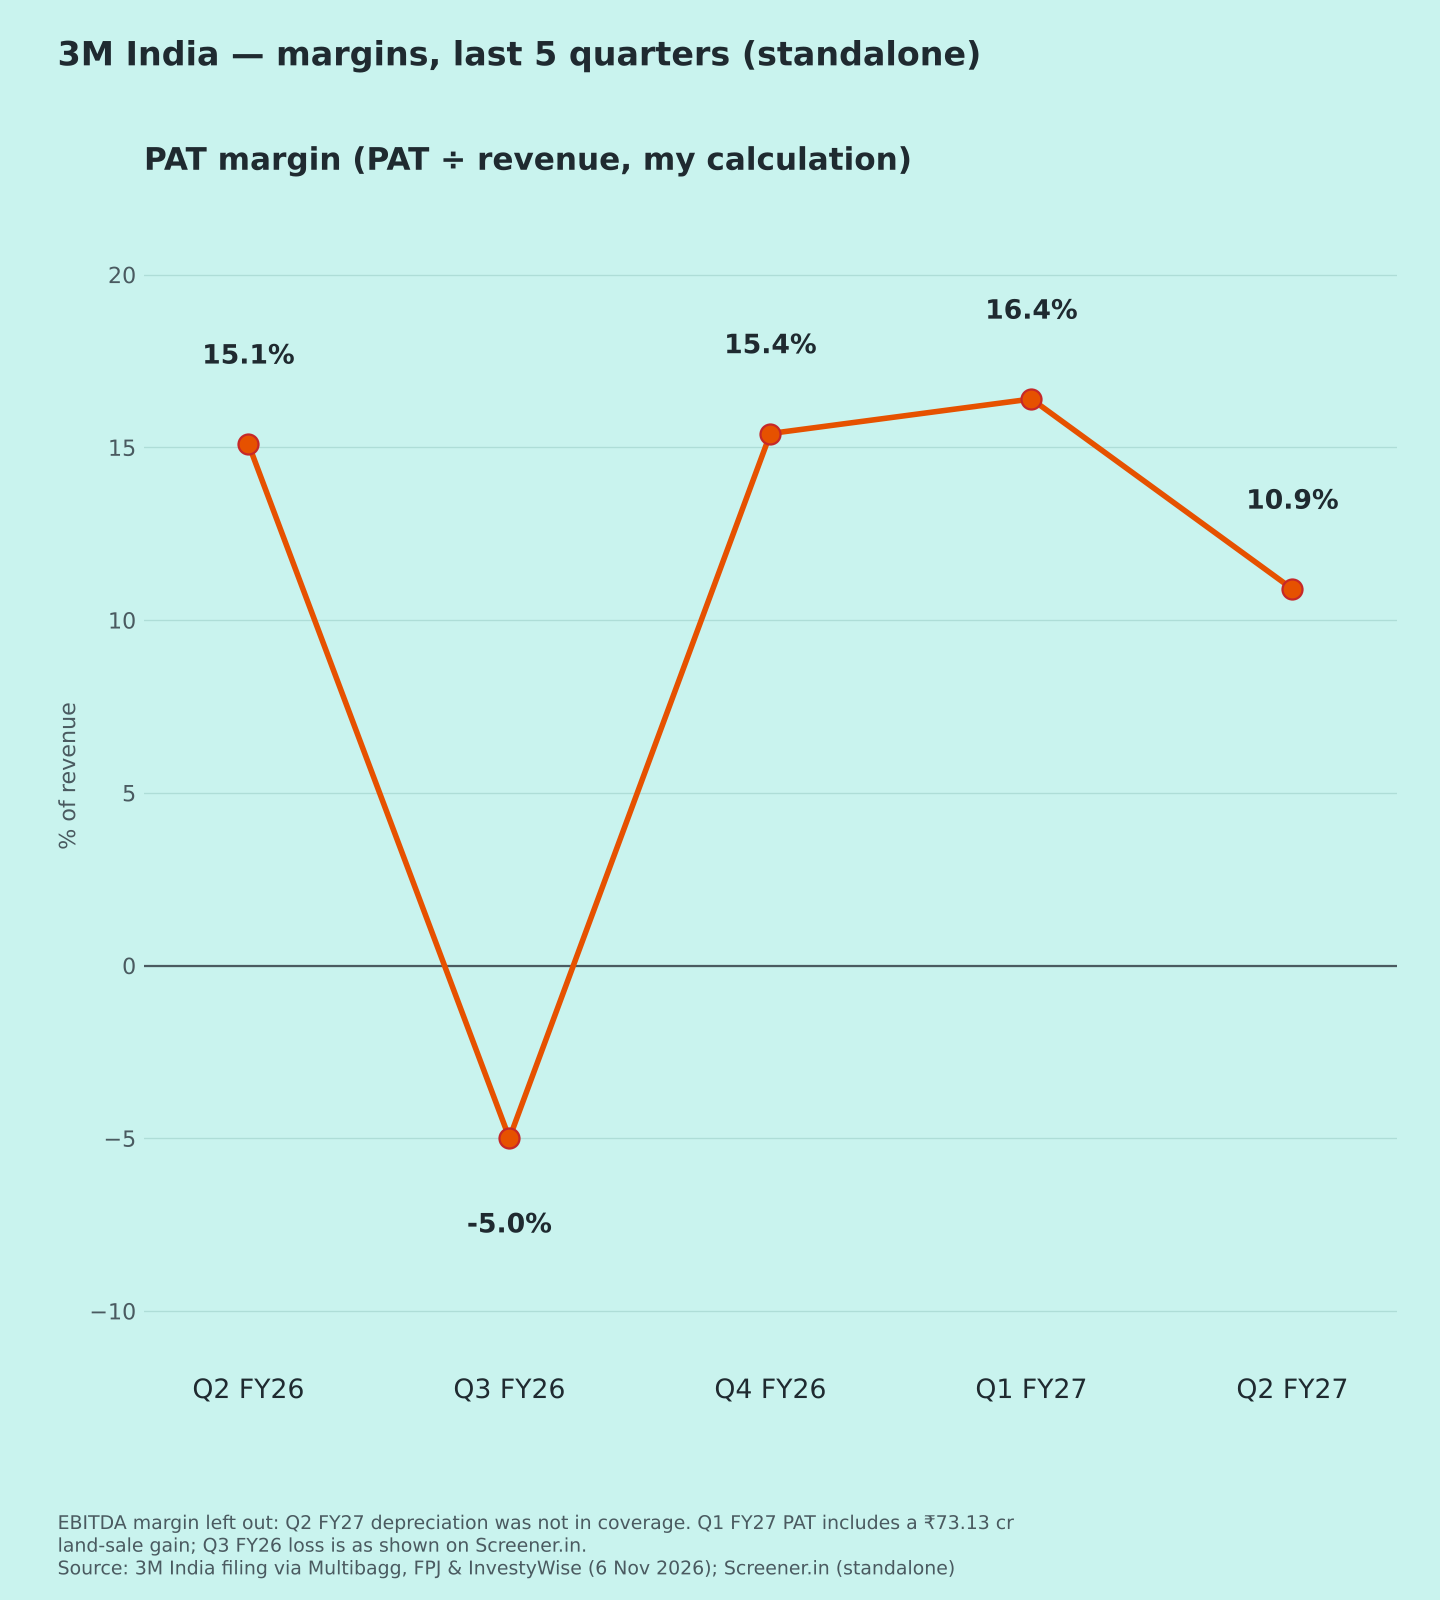
Margins (Chart 3)
PAT margin: 15.1% → −5.0% → 15.4% → 16.4% → 10.9% (my calculation) [1][5]. Q1 includes the land gain. Q3 FY26 was a loss on Screener, with negative other income and a 154% tax rate [5]. Coverage doesn't explain it.
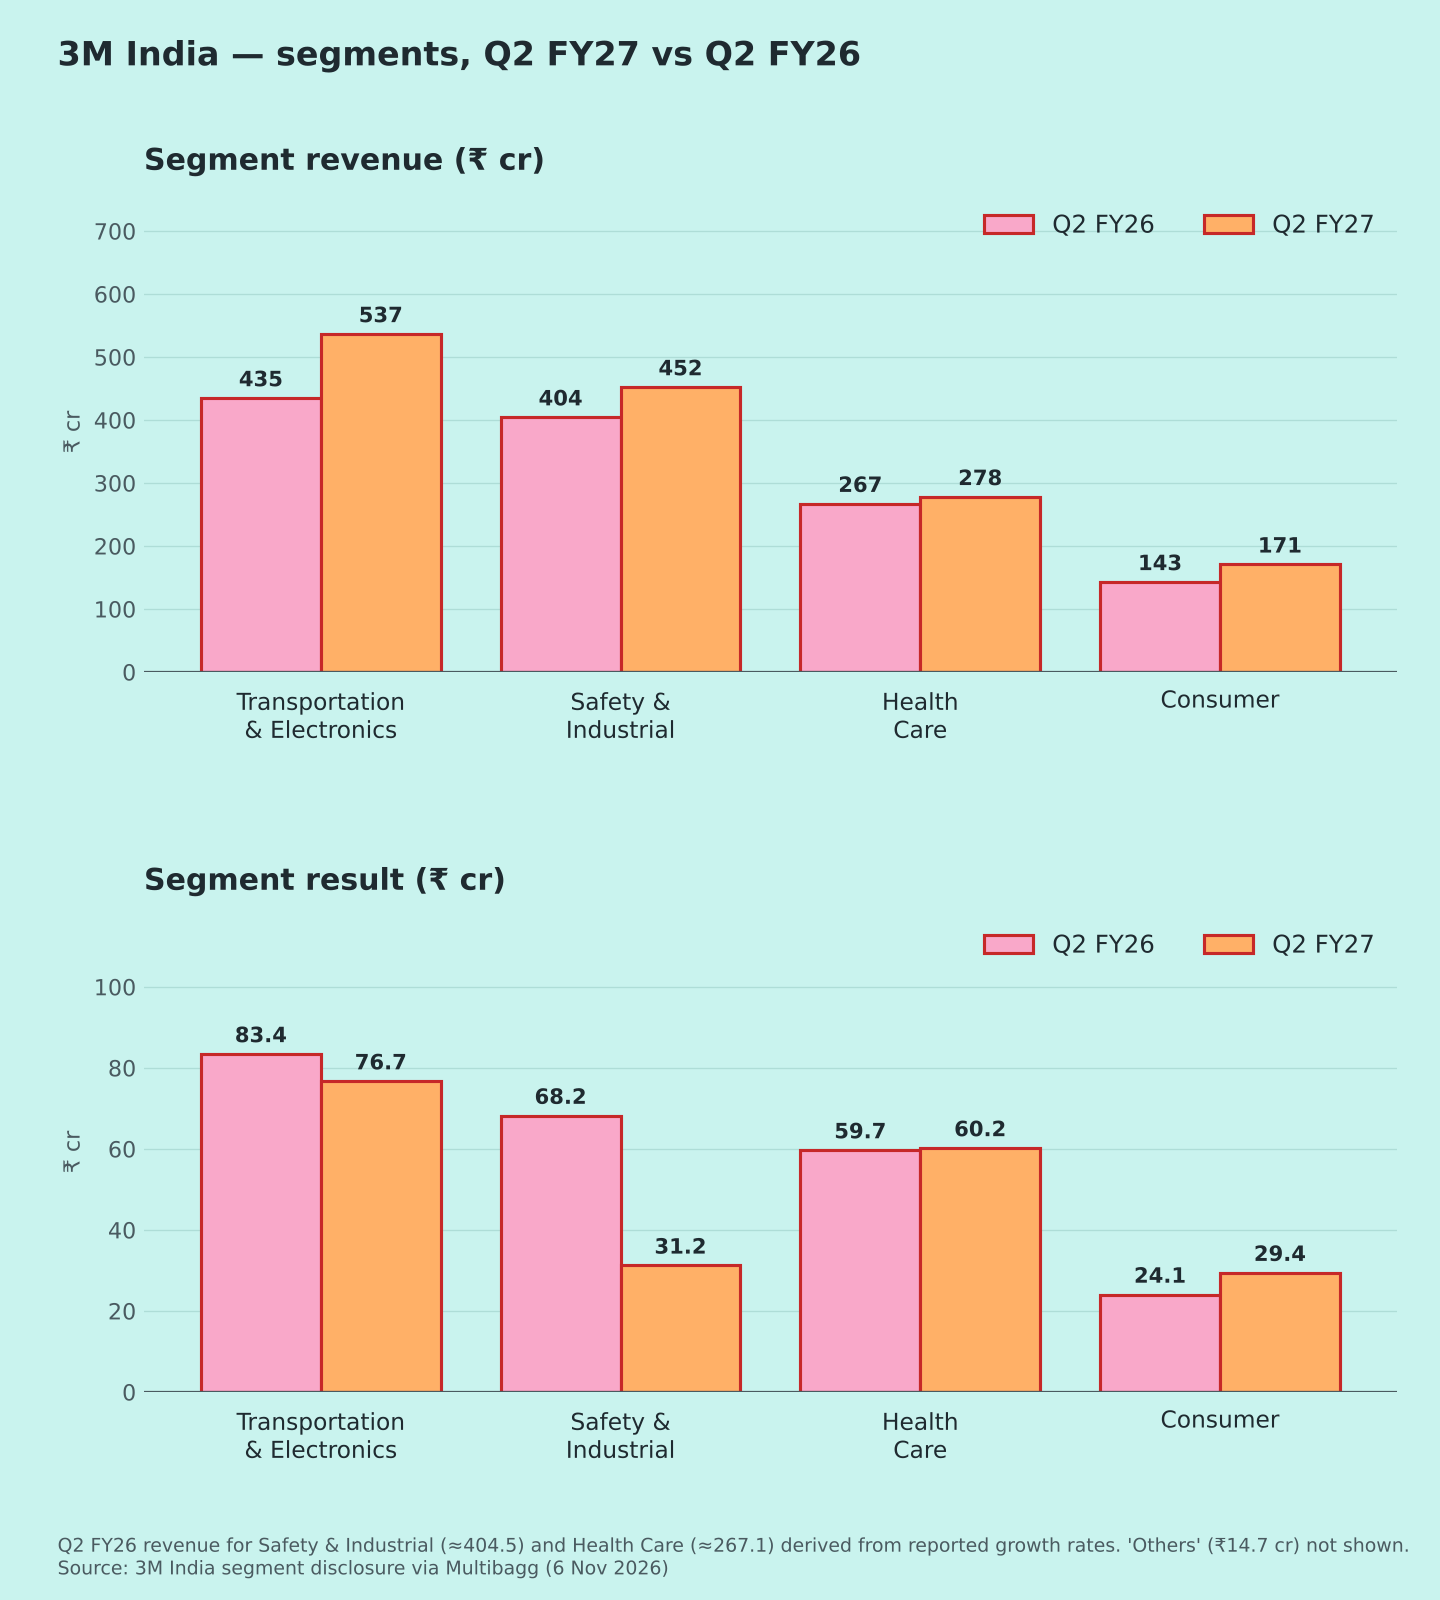
Segments (Chart 4)
- Safety & Industrial: revenue +11.8%; result ₹31.2 cr vs ₹68.2 cr (−54%). This is the main drag.
- Transportation & Electronics: revenue +23.4%; result ₹76.7 cr vs ₹83.4 cr.
- Health Care: revenue +4.1%; result ₹60.2 cr vs ₹59.7 cr.
- Consumer: revenue +19.5%; result ₹29.4 cr vs ₹24.1 cr.
- Others: revenue ₹14.7 cr, −13.9%.
Other updates
The health-care distribution arrangement with Solventum has been amended. Coverage describes it variously as an extension to 31 Mar 2031 [4] and as US$13 mn of compensation [5]; please check the filing. The FY26 dividend of ₹506 per share was paid during the quarter [1]. No guidance was found in coverage.
Positives
- Revenue +14.7%, led by Transportation & Electronics and Consumer [1]
- Consumer and Health Care segment profits held up [1]
Concerns
- Safety & Industrial profit more than halved [1]
- Costs outpacing revenue; rupee exposure [1][3]
Things to track in Q3 FY27
- Safety & Industrial margin recovery
- Rupee and traded-goods costs
- Any price increases
- The Solventum agreement terms
Not a buy/sell recommendation. I am not a SEBI-registered analyst. Facts are sourced; opinions are labelled.
Sources [1] Multibagg – Q2 results & segments · [2] Free Press Journal – Q2 results · [3] Lapaas Voice – reasons cited · [4] InvestyWise – results & board changes · [5] Screener.in – 3M India
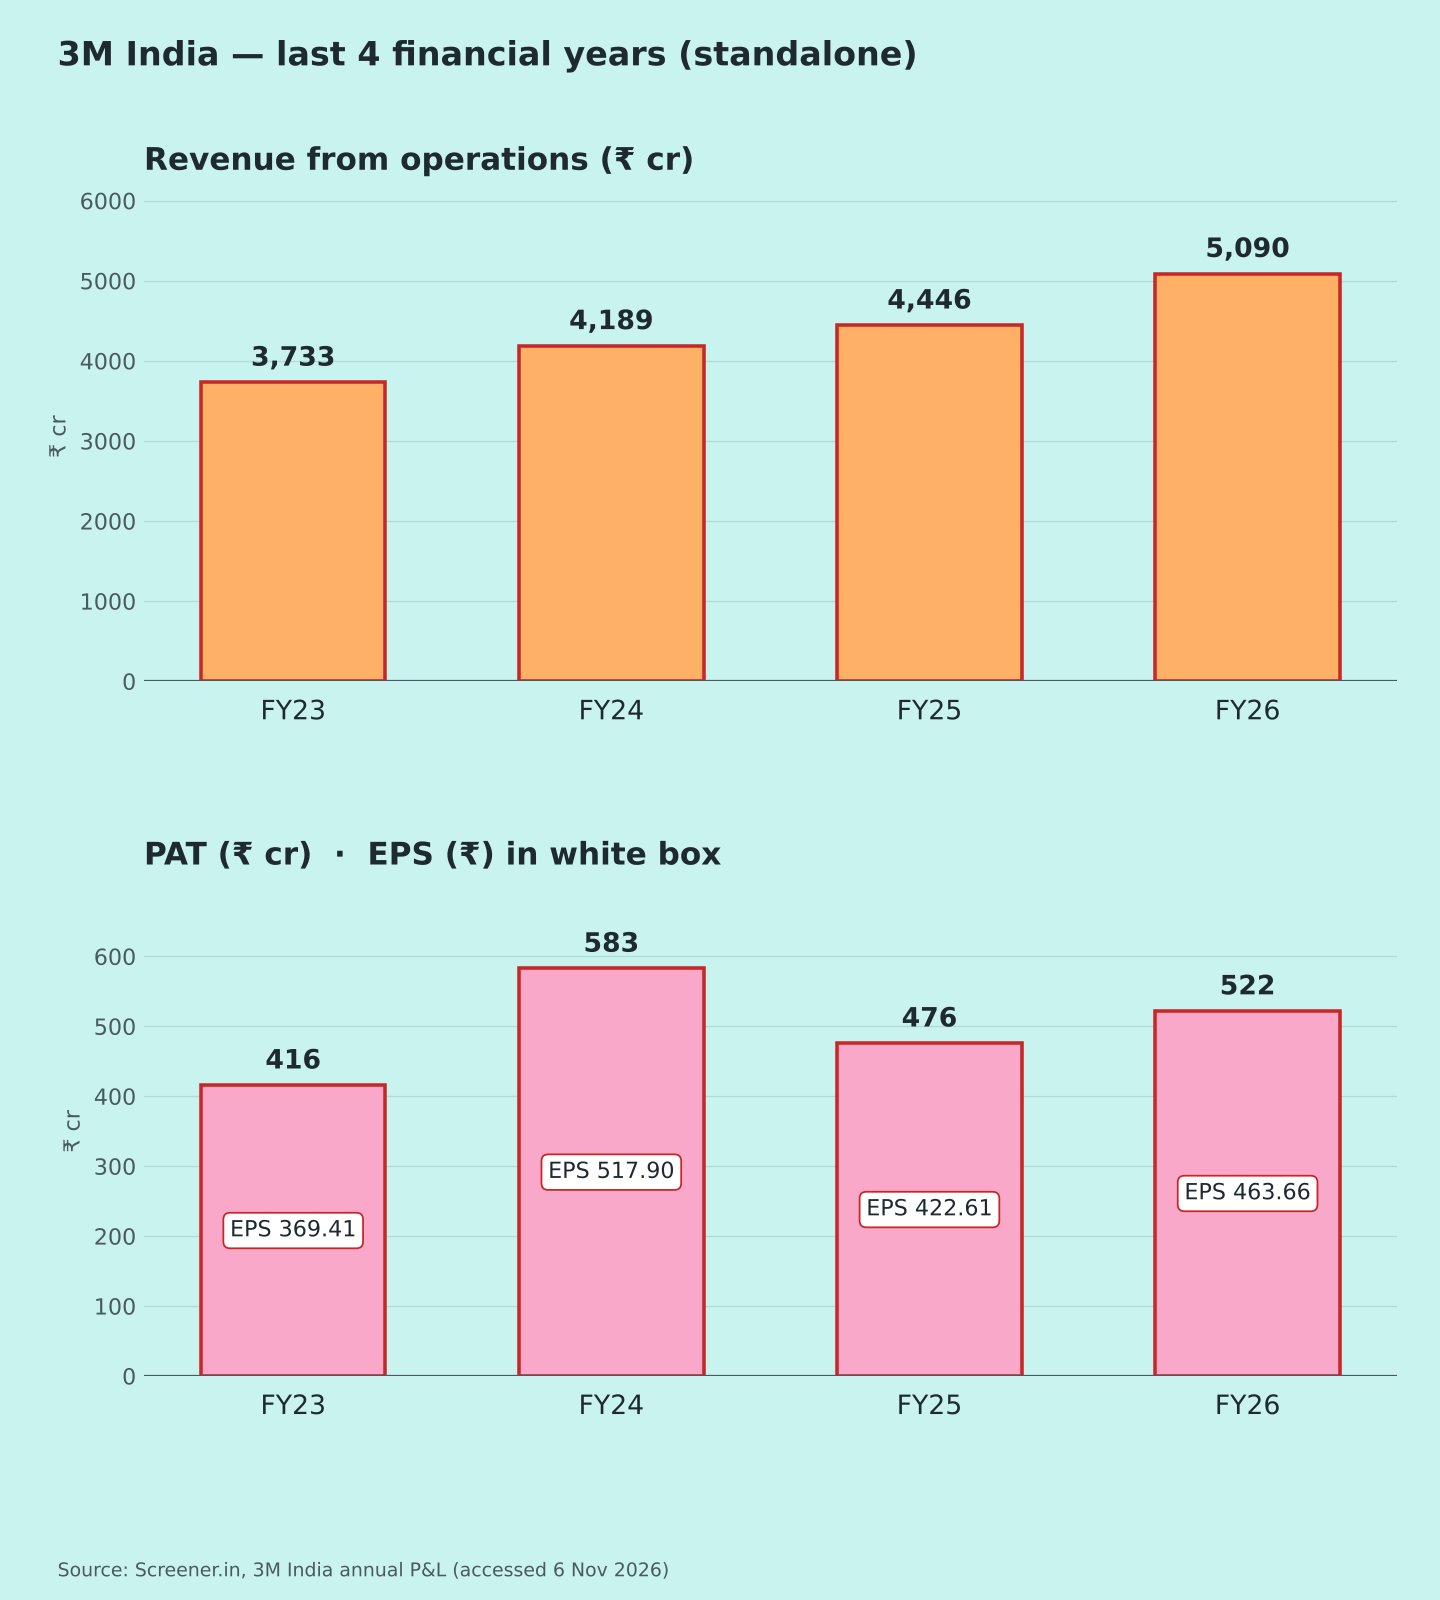
Charts: (1) 5 quarters revenue & PAT with EPS [1][5]; (2) FY23–FY26 [5]; (3) PAT margin [1][5]; (4) segments [1].