Mahindra Logistics (MAHLOG): Q2 FY27 results analysis
(quarter ended 30 Sep 2026)
All figures consolidated, ₹ crore unless stated. Results released on 23 Oct 2026. EBITDA is the company figure. YoY/QoQ %, margins and ratios are my calculations from reported numbers.
| Metric | Q2 FY27 | YoY | QoQ |
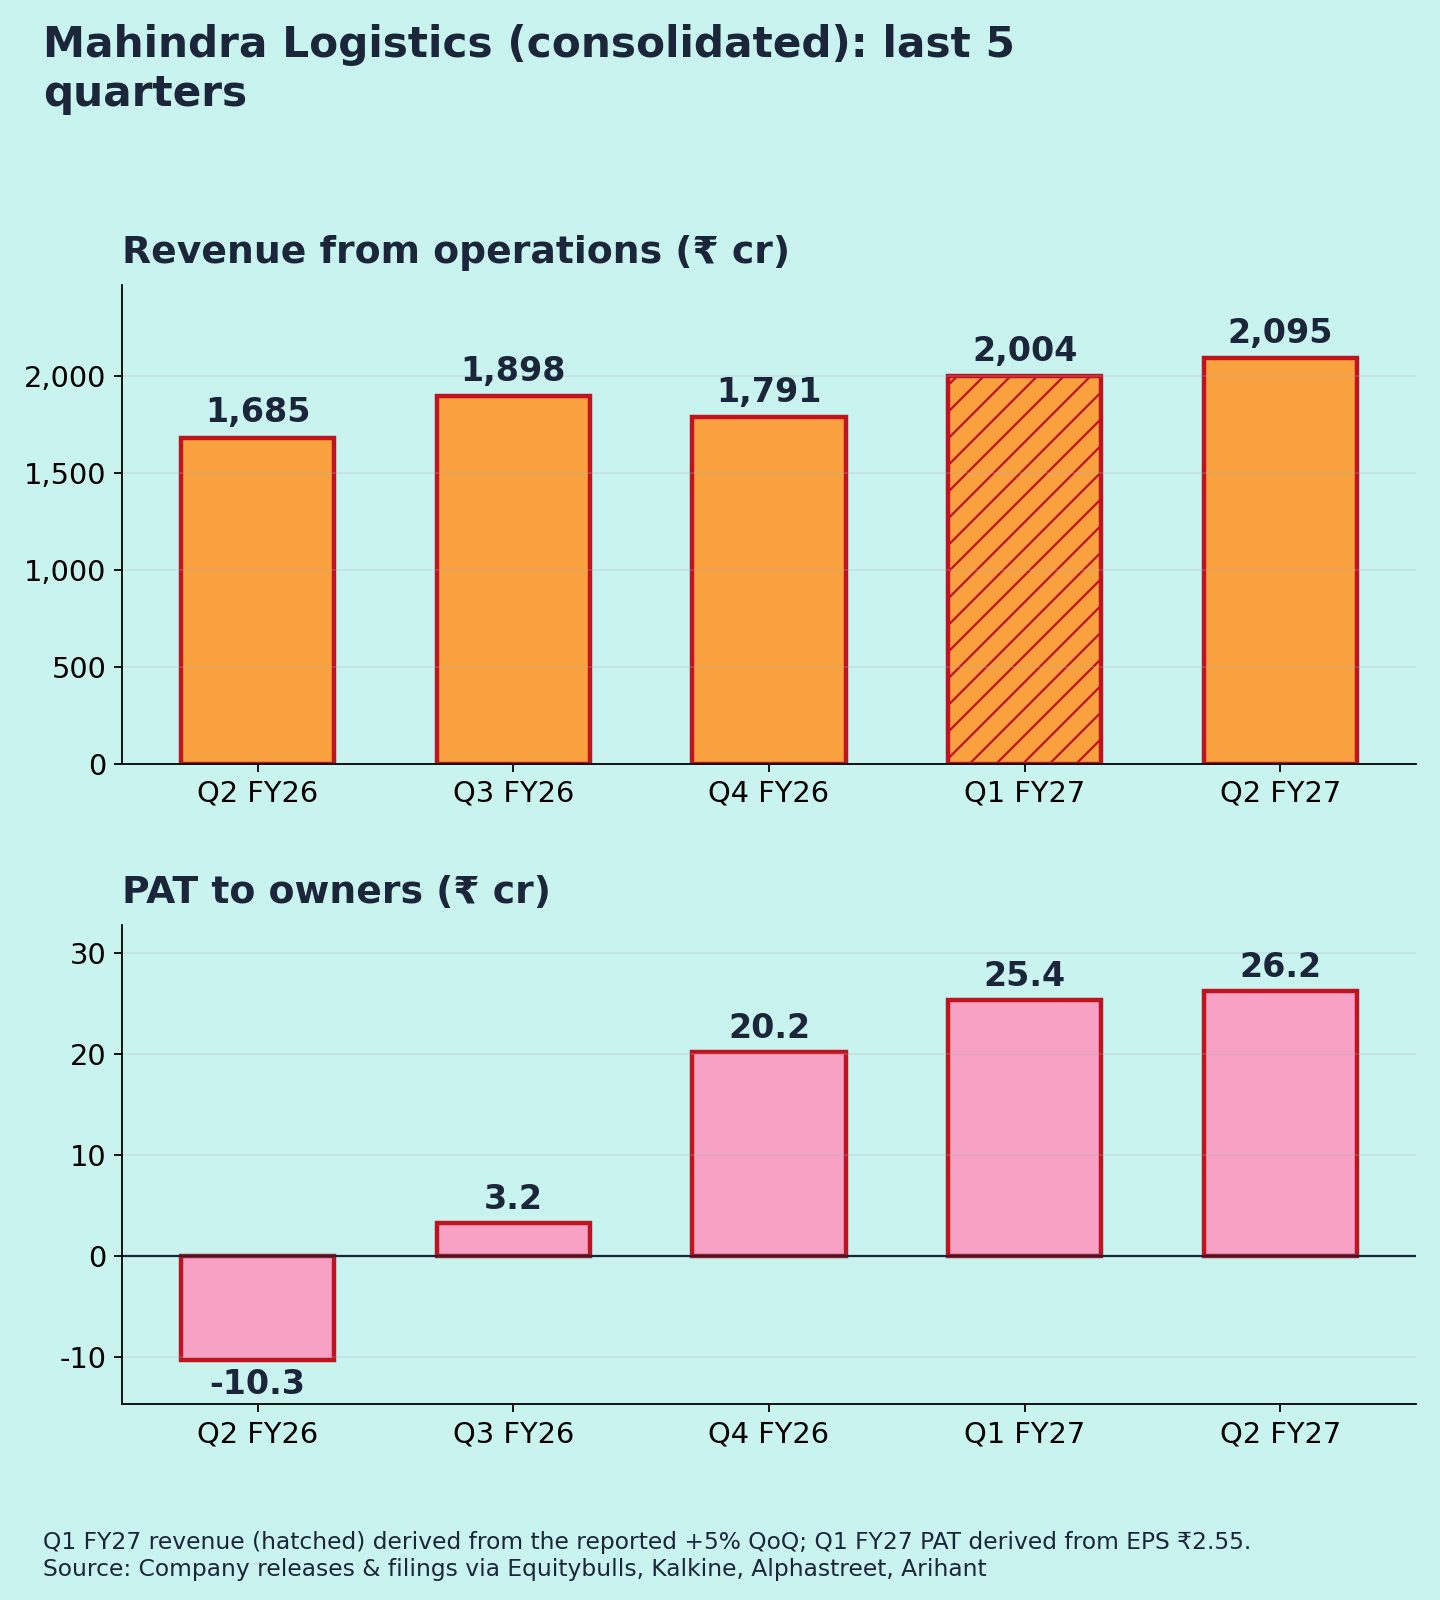
| Revenue from ops | 2,095.4 | +24.3% | ~+5% |
| EBITDA | 124 | +46% | +7% |
| EBITDA margin | 5.9% | 5.0% | 5.8% |
| PAT to owners | 26.3 | vs loss of 10.4 | +3.5% |
| PAT incl. minority | 28.9 | vs loss of 8.4 | +3.7% |
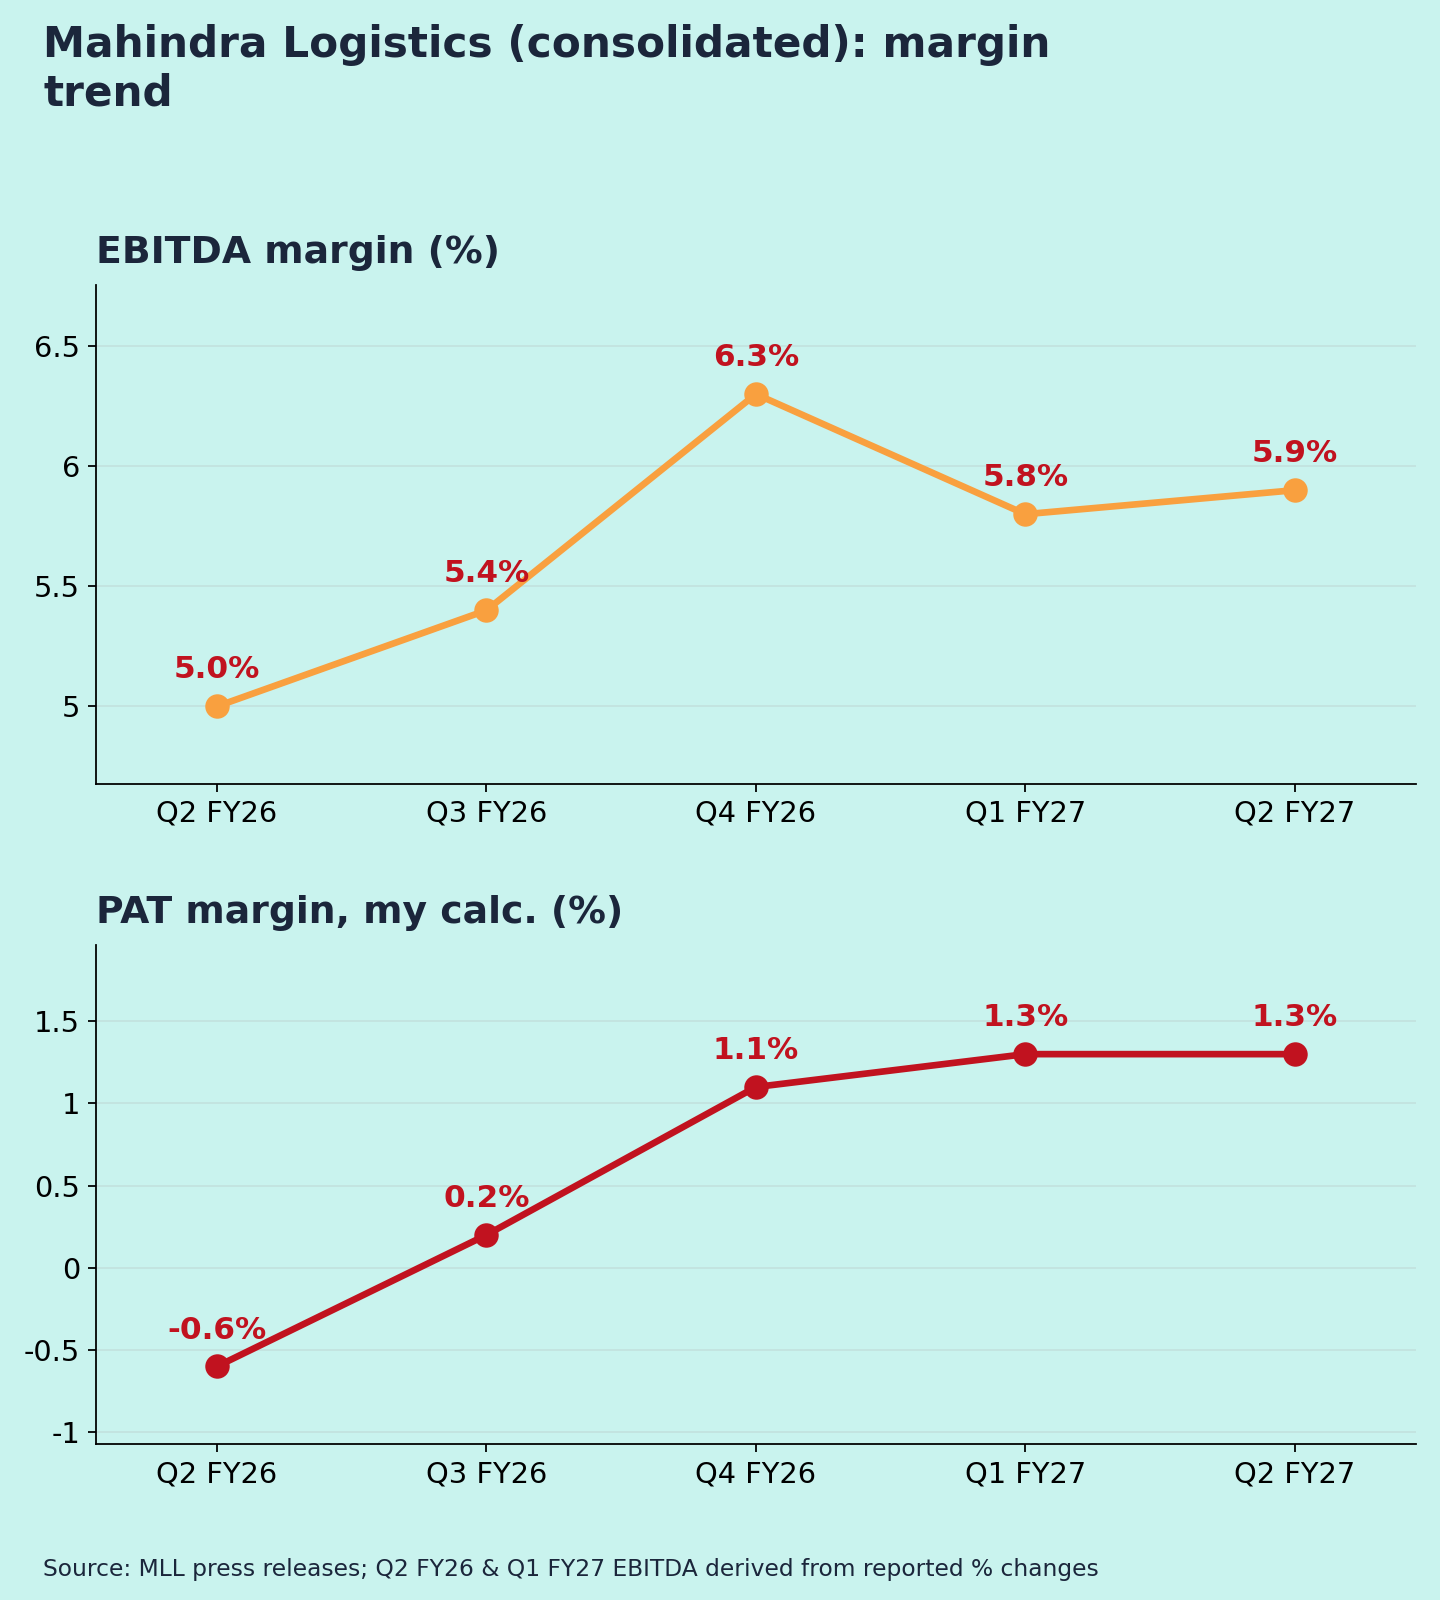
| PAT margin (owners) | 1.3% | −0.6% | 1.3% |
| Other income | 8.4 | – | – |
For margin rows, the YoY and QoQ columns show the prior-period value. Q2 FY26 and Q1 FY27 EBITDA are derived from the reported % changes; Q1 PAT is derived from EPS.
Source note: the press release headline uses PAT of ₹26.2 cr (owners) [1]. Angel One uses ₹28.87 cr, which includes minority interest [3].
Quality of earnings
The improvement is operational. Other income was only ₹8.4 cr (total income minus revenue [2]).
By segment [4]:
- Contract logistics: revenue ₹1,688 cr, +28%, with EBITDA of ₹115 cr.
- Express (Rivigo/MESPL): revenue +69% to ₹169 cr, and its first EBITDA-positive quarter (₹2.3 cr).
- Last-mile delivery: revenue −23% to ₹68 cr, as low-margin business was dropped deliberately.
Base effect: Q2 FY26 was a loss quarter, so headlines such as "PAT 3.5x" are flattered. QoQ, PAT rose just 3.5%, which is the cleaner read.
Margins are still thin. A PAT margin of 1.3% leaves little room for error (my view).
Margins (Chart 3)
EBITDA margin over five quarters: 5.0% → 5.4% → 6.3% → 5.8% → 5.9% [1][6][8]. The trend is steadily better than a year ago, but Q4 FY26's 6.3% hasn't been beaten yet. Q3 FY26 also carried one-off labour-code provisions [6].
Management commentary
- Guidance: no numeric revenue or margin guidance in the coverage I found.
- Returns: ROCE was 12.9% in H1 FY27, vs 1.7% a year ago [4].
- Strategy: the CEO credits "sharper execution, stronger operating discipline and a clear focus on profitable growth" [1].
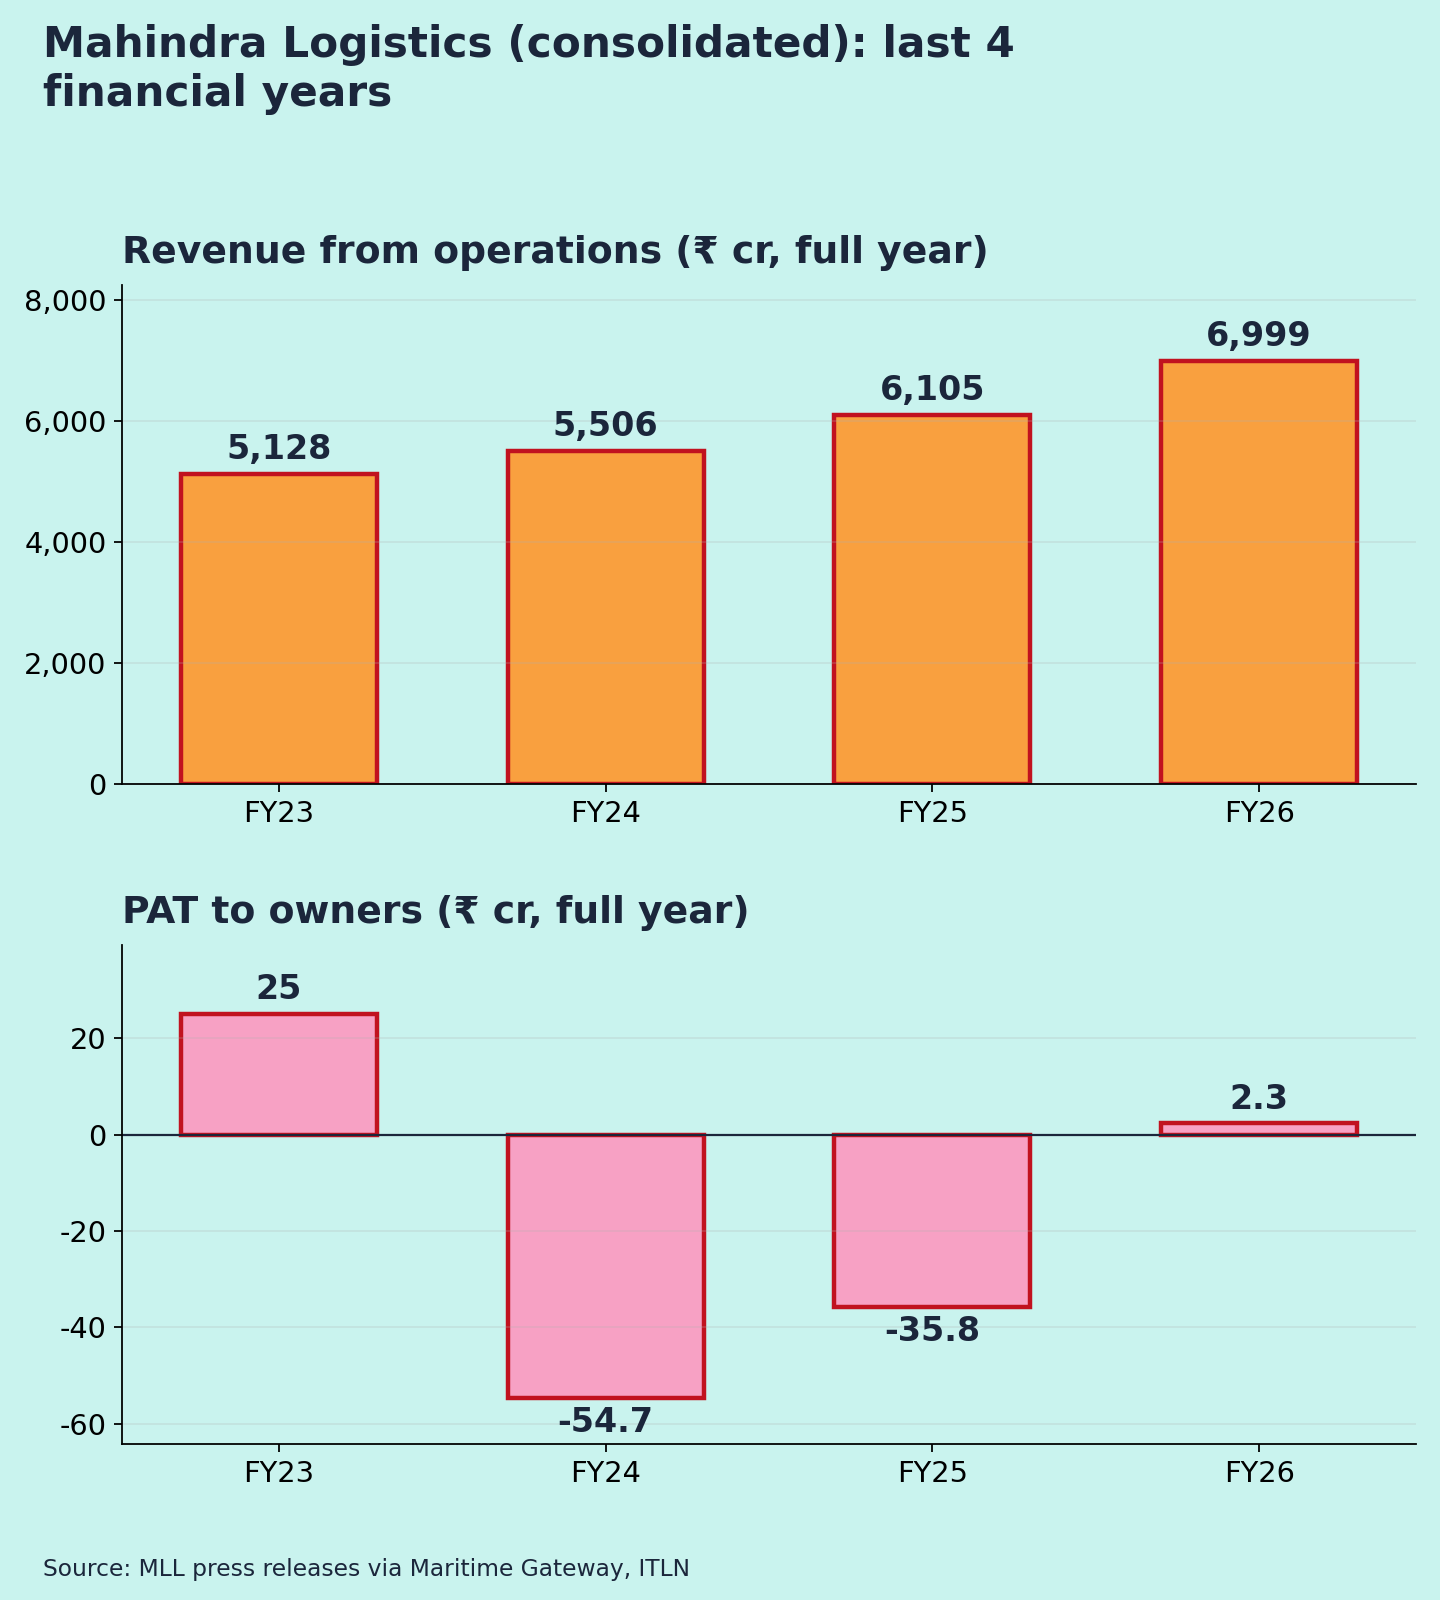
- Turnaround track: FY26 was the first profitable year after two years of losses (PAT ₹2.3 cr) [7]. H1 FY27 PAT is already far ahead of that [3].
- Beat: PAT beat the consensus estimate of ₹20.7 cr [11].
Positives
- Broad-based growth: revenue +24%, EBITDA +46% [1]
- Express business turned EBITDA-positive [4]
- ROCE recovery [4]
Concerns
- Very thin PAT margin (1.3%)
- Growth leans on the M&M auto volumes that drive contract logistics [4] (concentration, my view)
- Last-mile revenue still shrinking [4]
Things to track in Q3 FY27
- EBITDA margin moving above 6%
- Whether express stays EBITDA-positive
- Growth from non-Mahindra customers
- PAT run-rate vs H1 (₹51.6 cr to owners, my calculation)
Not a buy/sell recommendation. Facts are sourced; opinions are labelled.
Sources [1] Equitybulls – MLL Q2 FY27 press release · [2] Kalkine – filing · [3] Angel One, 23 Oct · [4] Investing.com – Q2 FY27 slides · [5] Investing.com – call transcript · [6] Alphastreet – Q3 FY26 · [7] ITLN – FY26 · [8] Arihant/Capital Market – Q4 FY26 · [9] ITLN – FY24 · [10] Maritime Gateway – FY23 · [11] Sahi – vs estimates
Charts: (1) last 5 quarters revenue & PAT [1][2][6][7]; (2) FY23–FY26 revenue & PAT [7][9][10]; (3) EBITDA and PAT margin (own calc.). Q1 FY27 revenue is derived from the reported +5% QoQ.