JK Tyre & Industries (JKTYRE): Q2 FY27 results analysis
(quarter ended 30 Sep 2026)
All figures consolidated, ₹ crore unless stated. Results released on 23 Oct 2026. EBITDA here excludes other income. YoY/QoQ %, margins and ratios are my calculations from reported numbers.
| Metric | Q2 FY27 | YoY | QoQ |
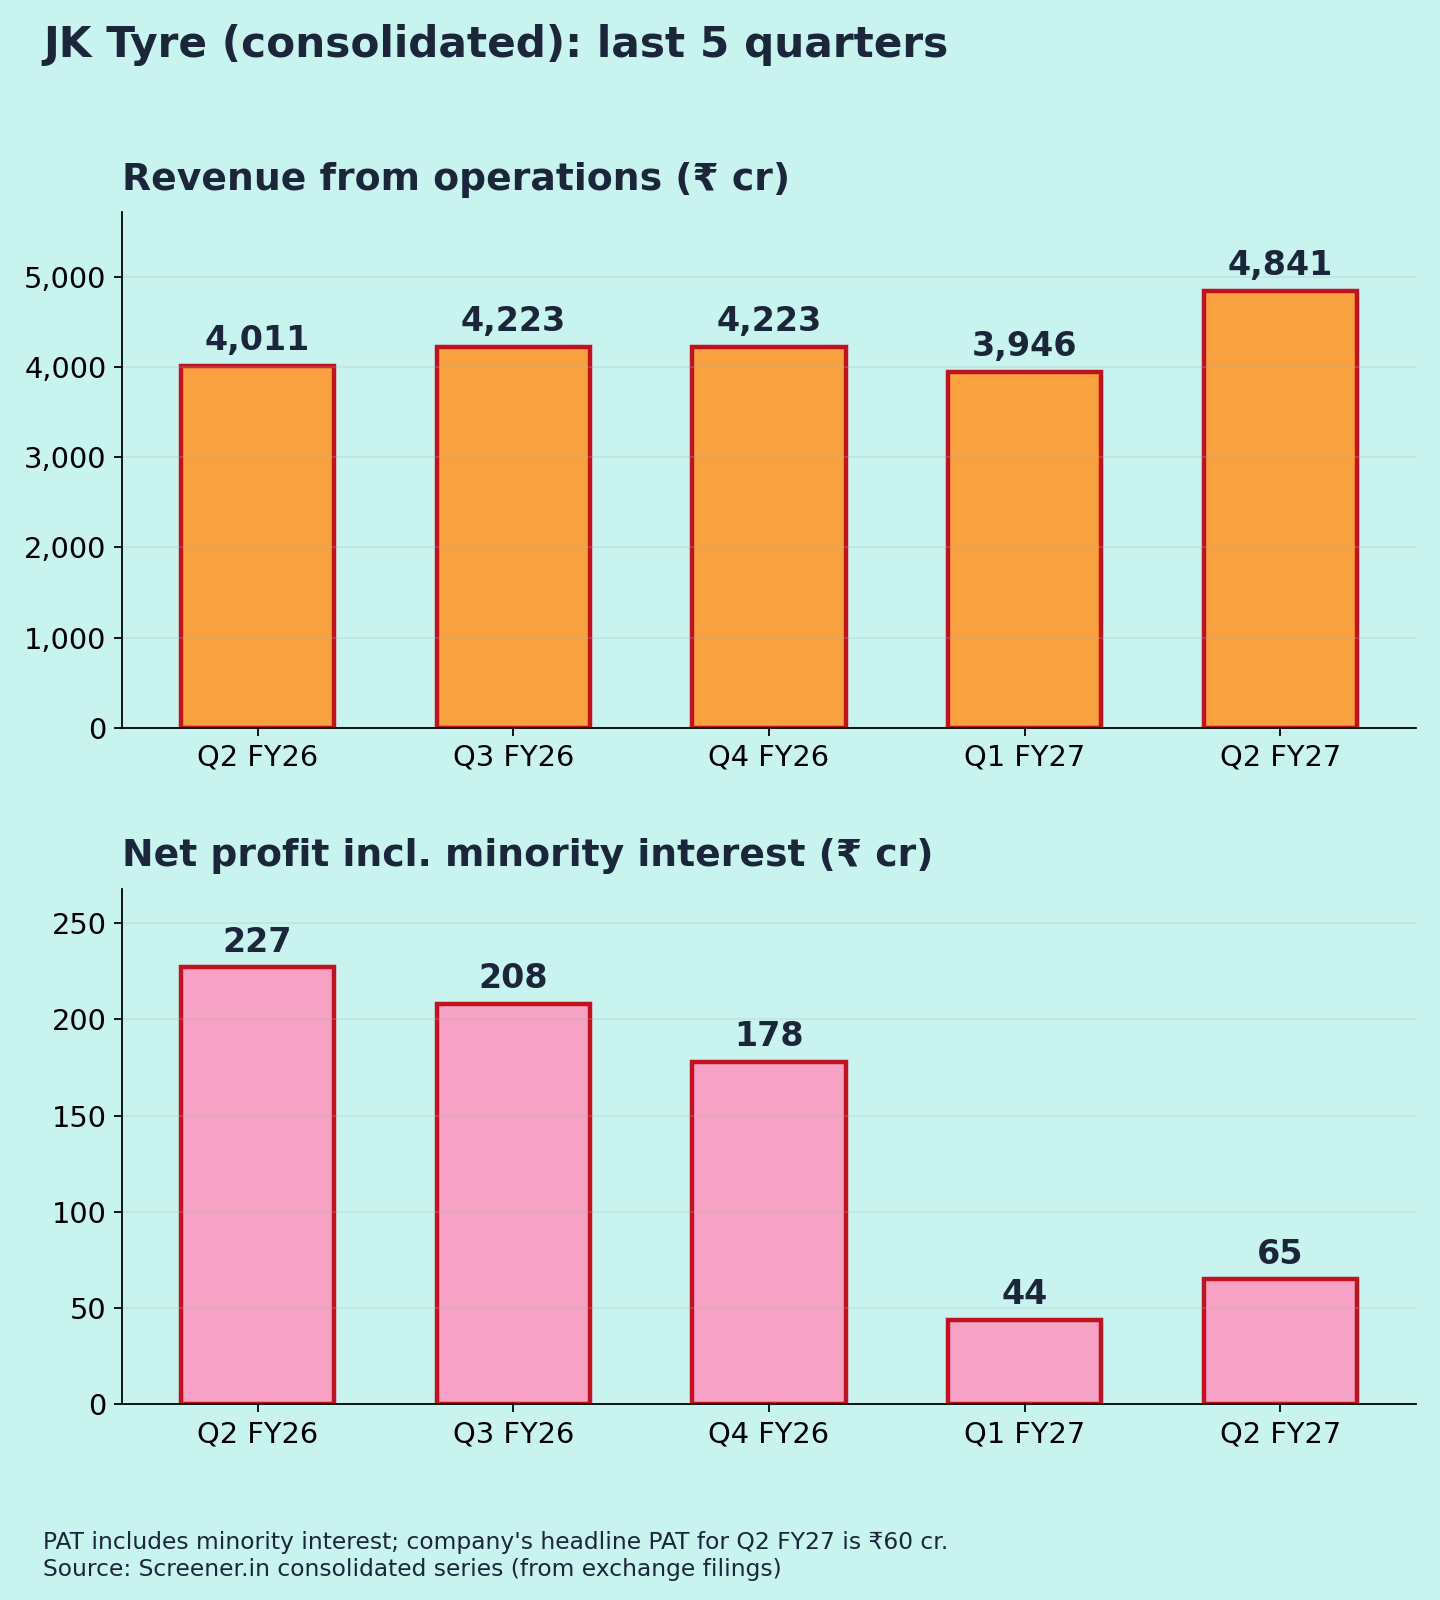
| Revenue from ops | 4,841 | +20.7% | +22.7% |
| EBITDA (ex-OI) | 334 | −35.9% | +29.5% |
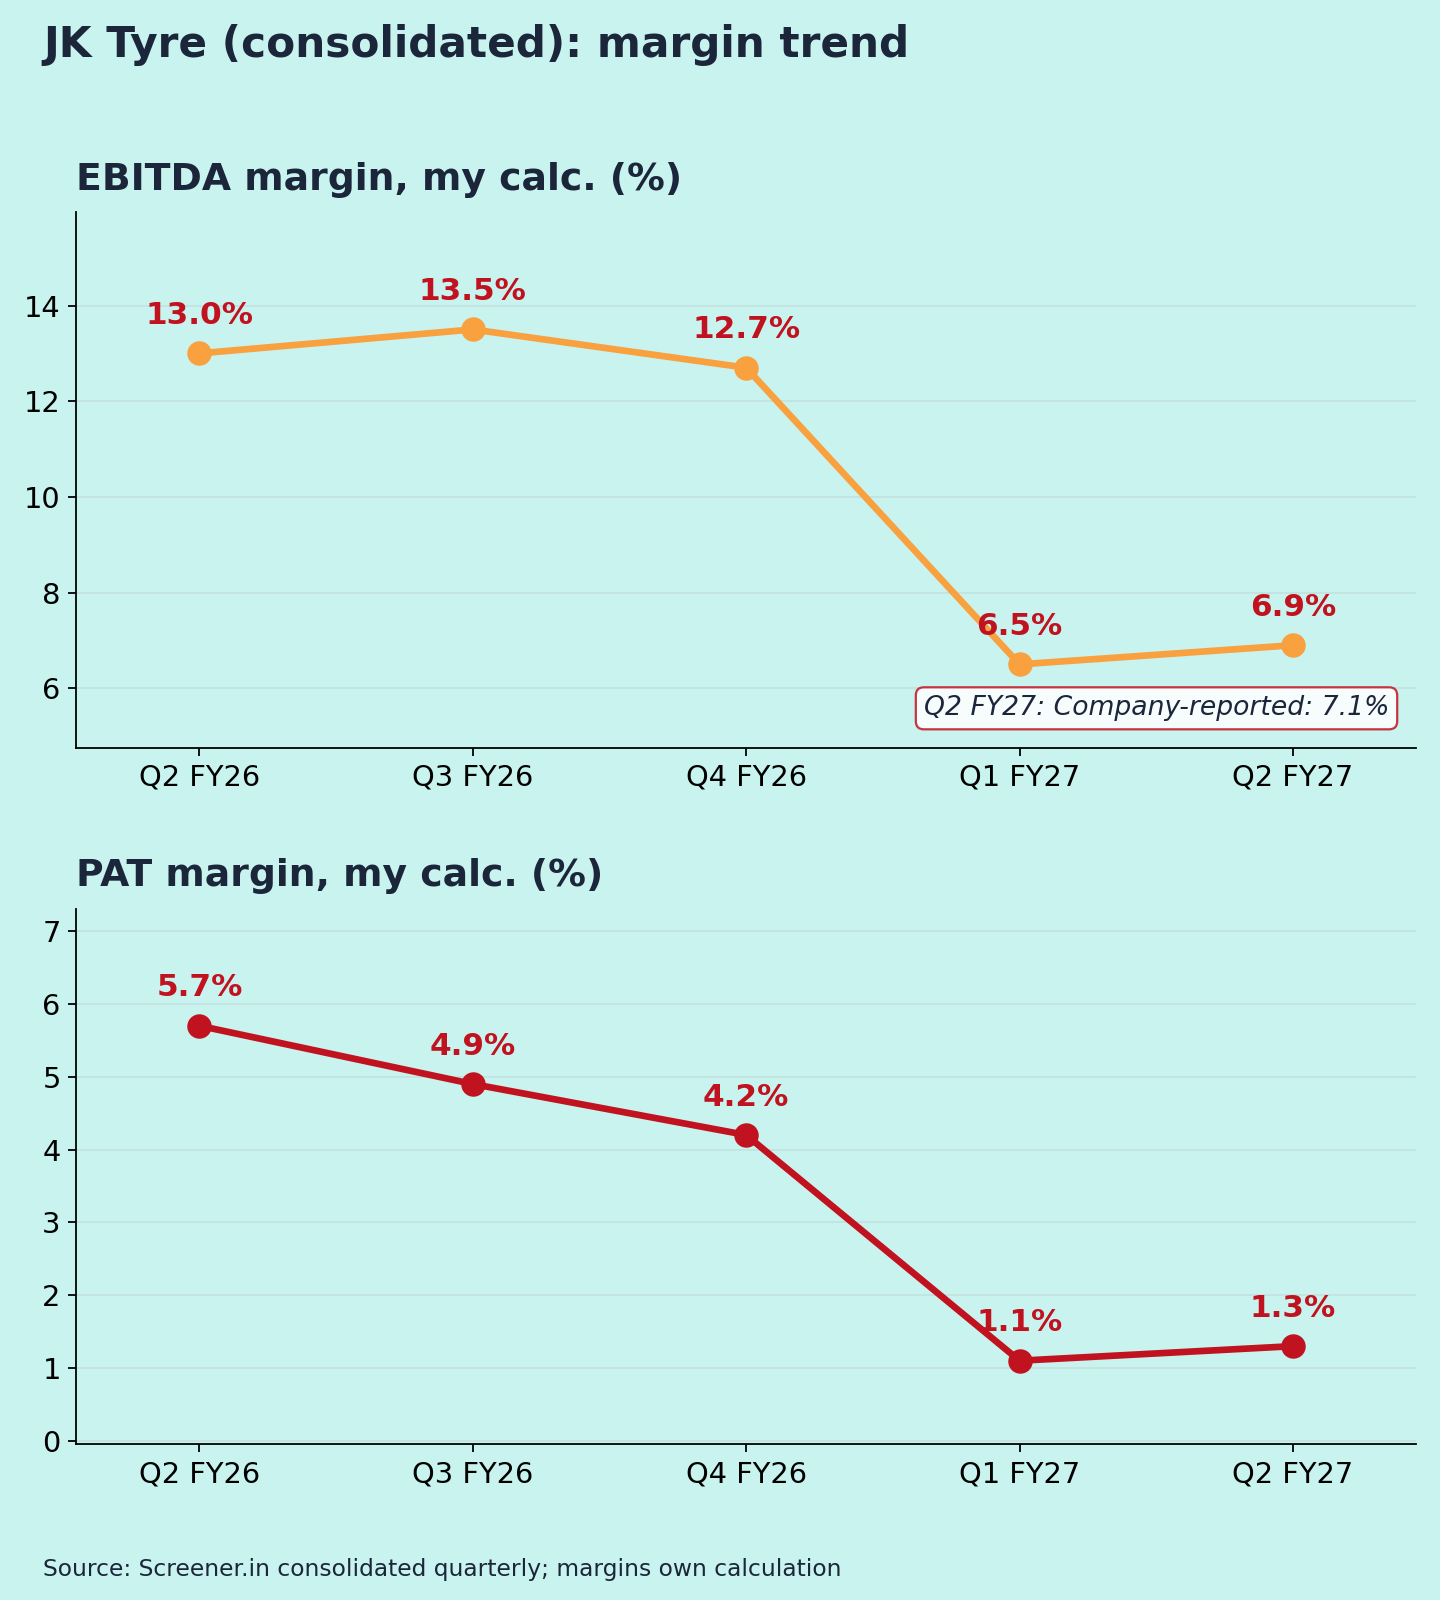
| EBITDA margin | 6.9% | 13.0% | 6.5% |
| PBT | 94 | −69.1% | +74.1% |
| Net profit (incl. minority) | 65 | −71.4% | +47.7% |
| PAT margin | 1.3% | 5.7% | 1.1% |
| Other income / PBT | −3% | 2% | 37% |
For margin and ratio rows, the YoY and QoQ columns show the prior-period value. Sources: [1][2]
Source note: the company reports EBITDA of ₹343 cr (7.1%, vs 13.3%) and PAT of ₹60 cr [2]. Screener's ₹65 cr includes minority interest [1][5]. The differences are small.
Quality of earnings
The revenue line was strong:
- Sales: record revenue; OEM sales +65% and domestic sales +32% after GST 2.0 [3].
- Mix: replacement 61%, OEM 28%, exports 11% [4].
- Mexico: JK Tornel rebounded to ₹479 cr [3].
The profit fall is operational. Raw-material costs rose ~20% QoQ in Q1, and management expected a further 8–9% in Q2 [8]. About 70% of tyre inputs are petro-linked [8].
Below EBITDA:
- Tax: the rate rose to ~36% from ~27% [1], cutting PAT further.
- Interest and D&A: interest was ₹109 cr and D&A ₹128 cr, both little changed [1].
- Debt: borrowings rose to ₹6,125 cr from ₹4,882 cr in March, with CWIP at ₹980 cr [1]. This funds the ₹4,980 cr capex plan [6] plus working capital.
Base effect: Q2 FY26 was a strong quarter (13% margin), so part of the YoY fall is a high base. The QoQ improvement (+29.5% EBITDA) suggests price hikes are starting to work (my reading).
Margins (Chart 3)
EBITDA margin over five quarters: 13.0% → 13.5% → 12.7% → 6.5% → 6.9% [1]. Only a small recovery so far from the Q1 trough.
Guidance: what changed
- Revenue: double-digit growth for FY27, guided after Q1 [7]. H1 revenue is +11% YoY [1].
- Margin: after Q1, management targeted 10–11% operating margin for FY27 [7]. Another report cites 11–13% for H2 [6].
- What H2 needs: H1 EBITDA margin is ~6.7%. Reaching 10% for the year needs roughly 13% in H2 (my calculation). That is a steep step-up from 6.9%.
- Pricing: cumulative price hikes of ~11% up to August [6].
- Earnings call: the Q2 call wasn't available at the time of writing.
Positives
- Record revenue; strong OEM and domestic volumes [3]
- Sequential EBITDA recovery of 29.5% [1]
- Mexico business rebounding [3]
Concerns
- Margin far below the guided H2 path (my view) [6][7]
- Borrowings up ₹1,243 cr in six months [1]
- High exposure to crude and rubber prices [8]
Things to track in Q3 FY27
- EBITDA margin vs the 11–13% H2 indication
- Crude and natural rubber prices; further price hikes
- Borrowings and capex commissioning
- Mexico (JK Tornel) profitability
Not a buy/sell recommendation. Facts are sourced; opinions are labelled.
Sources [1] Screener.in – consolidated · [2] Kotak Neo, 23 Oct 2026 · [3] Autocar Pro – Q2 FY27 · [4] Multibagg – Q2 FY27 presentation · [5] Whalesbook – Q2 FY27 · [6] Sahi – FY27 outlook and capex · [7] Quartr – Q1 FY27 summary · [8] Autocar Pro – Q1 FY27 raw materials
Charts:
(1) last 5 quarters revenue & net profit [1];
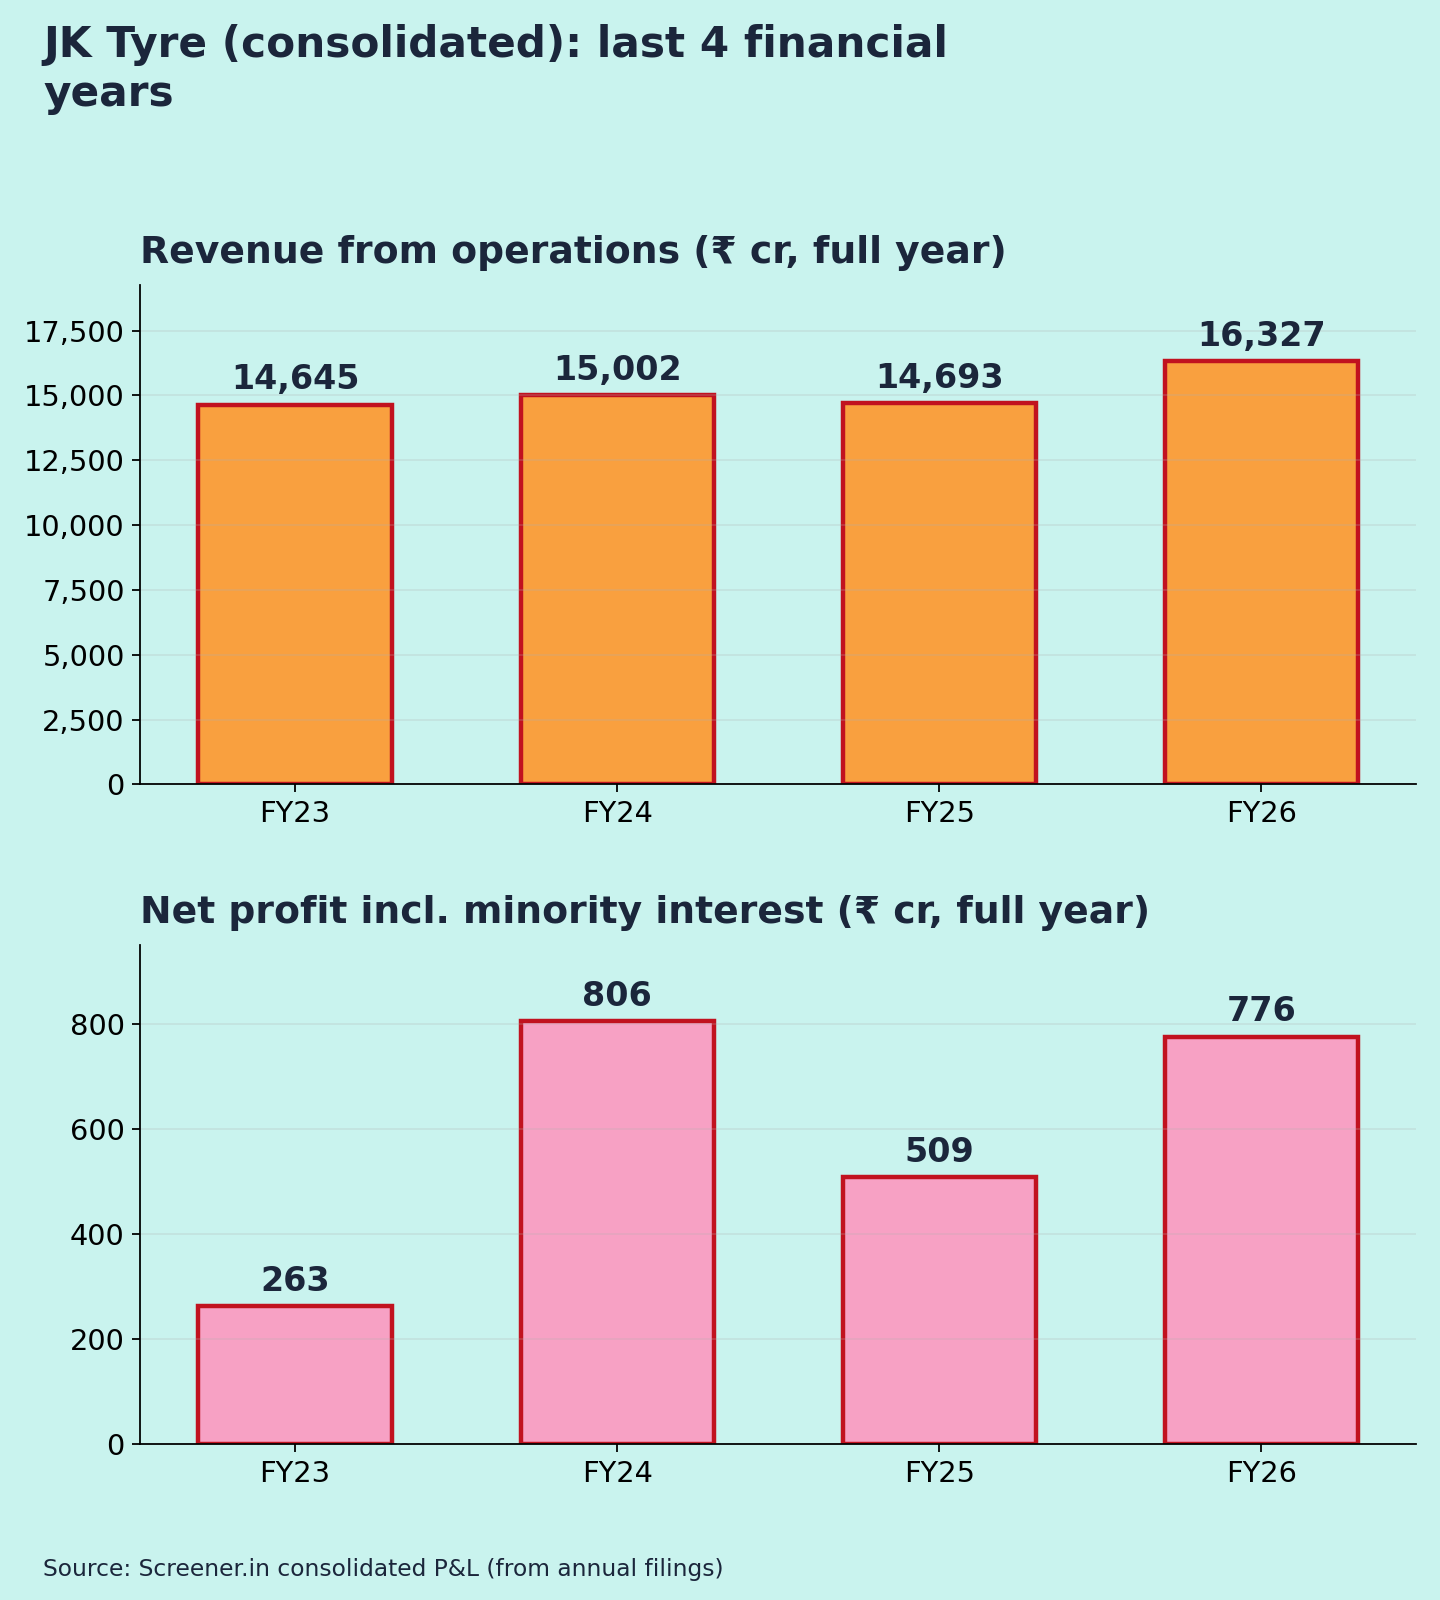
(2) FY23–FY26 revenue & net profit [1];
(3) EBITDA and PAT margin (own calc. from [1]).