Jindal Stainless (JSL): Q2 FY27 results analysis
(quarter ended 30 Sep 2026)
All figures consolidated, ₹ crore unless stated, as per the company release of 22 Oct 2026 [1]. EBITDA is the company's figure. YoY/QoQ %, margins and per-tonne numbers are my calculations.
| Metric | Q2 FY27 | YoY | QoQ |
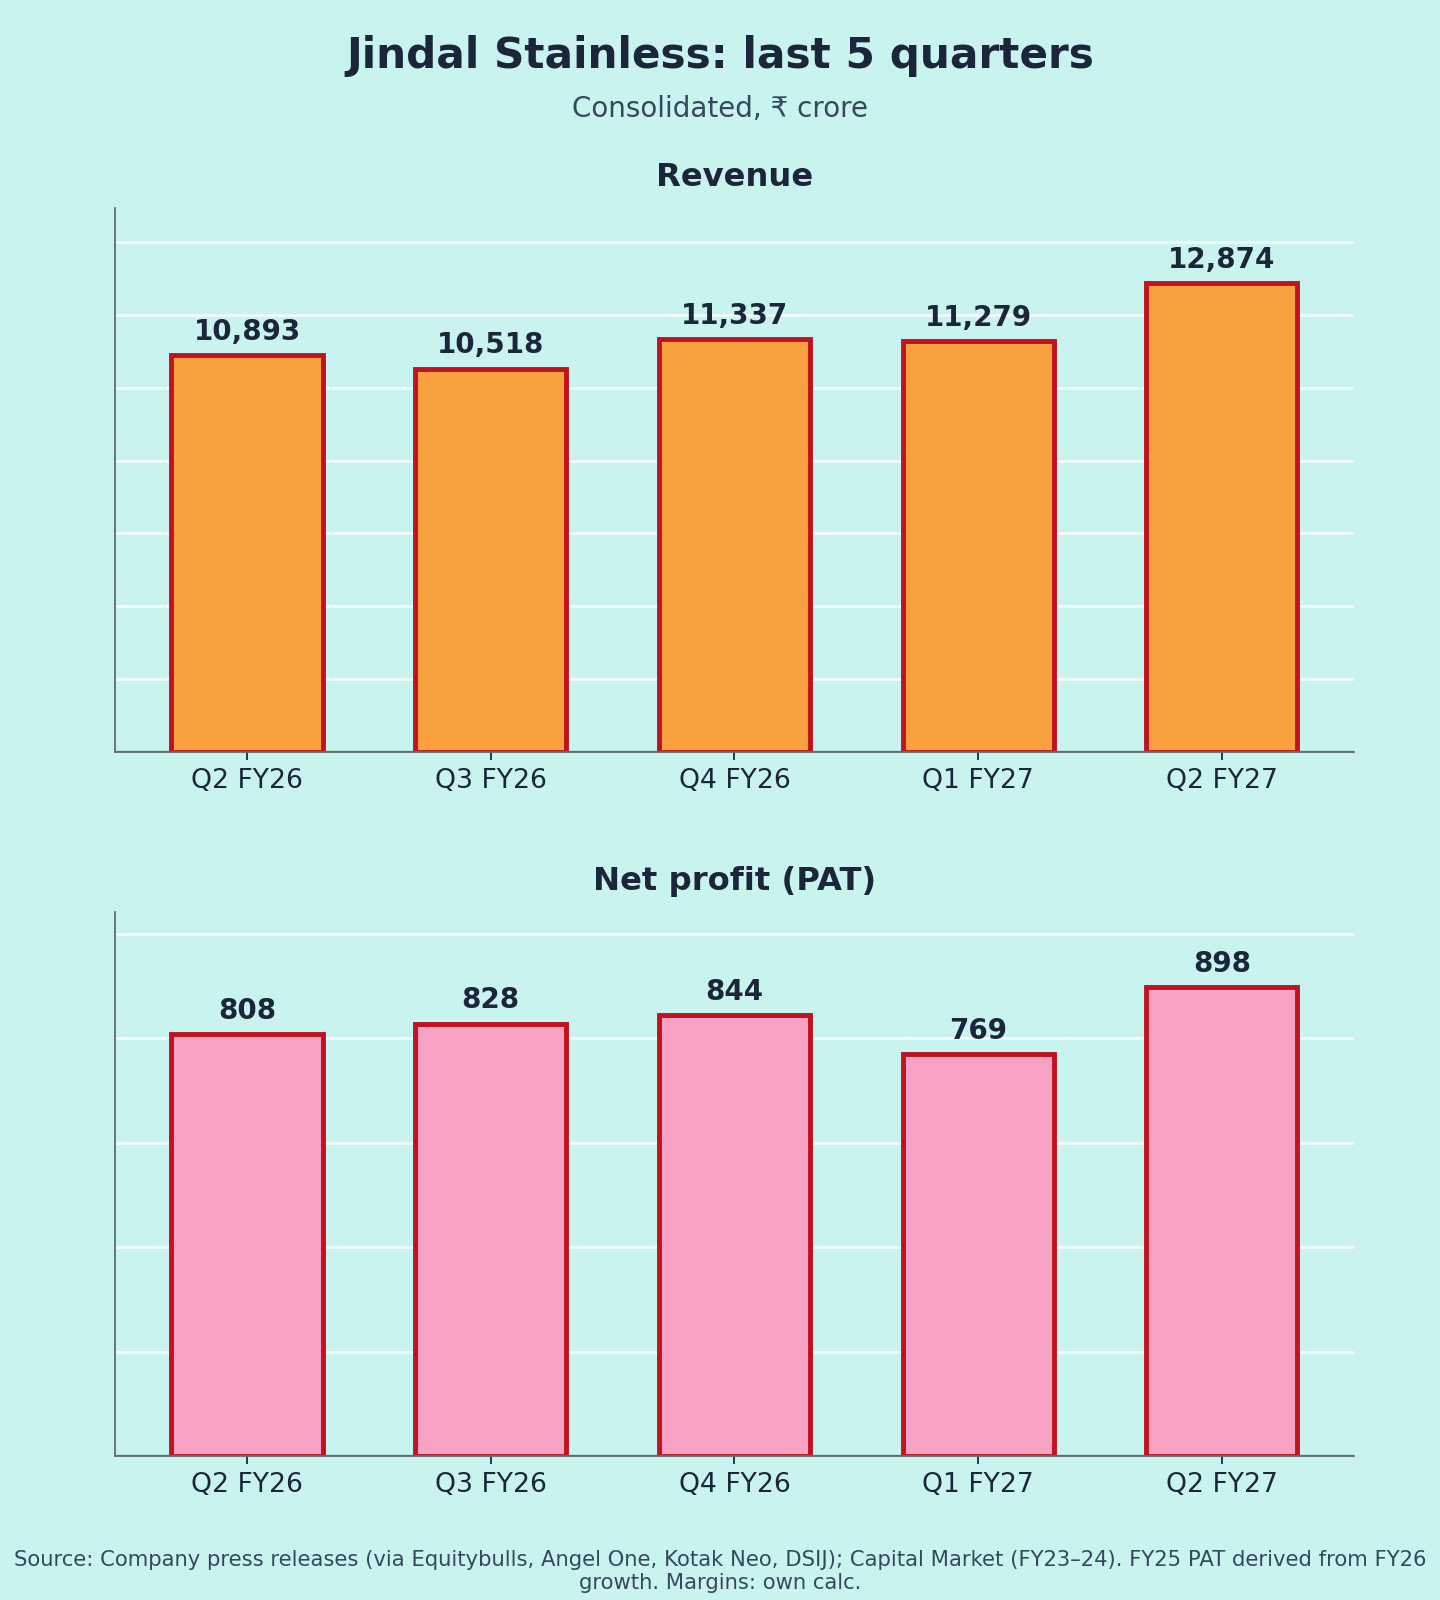
| Revenue from ops | 12,874 | +18.2% | +14.1% |
| Sales volume (tonnes) | 6,64,378 | +2.5% | +14.4% |
| EBITDA | 1,433 | +3.2% | +7.8% |
| EBITDA margin | 11.1% | 12.7% | 11.8% |
| EBITDA per tonne (₹) | 21,569 | 21,418 | 22,882 |
| PAT | 898 | +11.1% | +16.8% |
| PAT margin | 7.0% | 7.4% | 6.8% |
Sources: [1][2].
Quality of earnings
Revenue grew 18%, but volume grew only 2.5%. Most of the growth is higher prices per tonne (~₹1.94 lakh vs ~₹1.68 lakh), likely raw material pass-through (my calculation and interpretation).
EBITDA per tonne was flat YoY. So the margin % "fall" to 11.1% is mostly a bigger revenue base, not weaker profit per tonne (my reading).
PAT grew faster (+11%) than EBITDA (+3%). The release doesn't explain why; lower interest/depreciation or a better JV contribution are possible. Check the filing. No exceptional item is mentioned.
Base: Q1 FY27 was disrupted by the geopolitical situation and industrial gas shortages [1]. The +14% QoQ volume is partly a rebound.
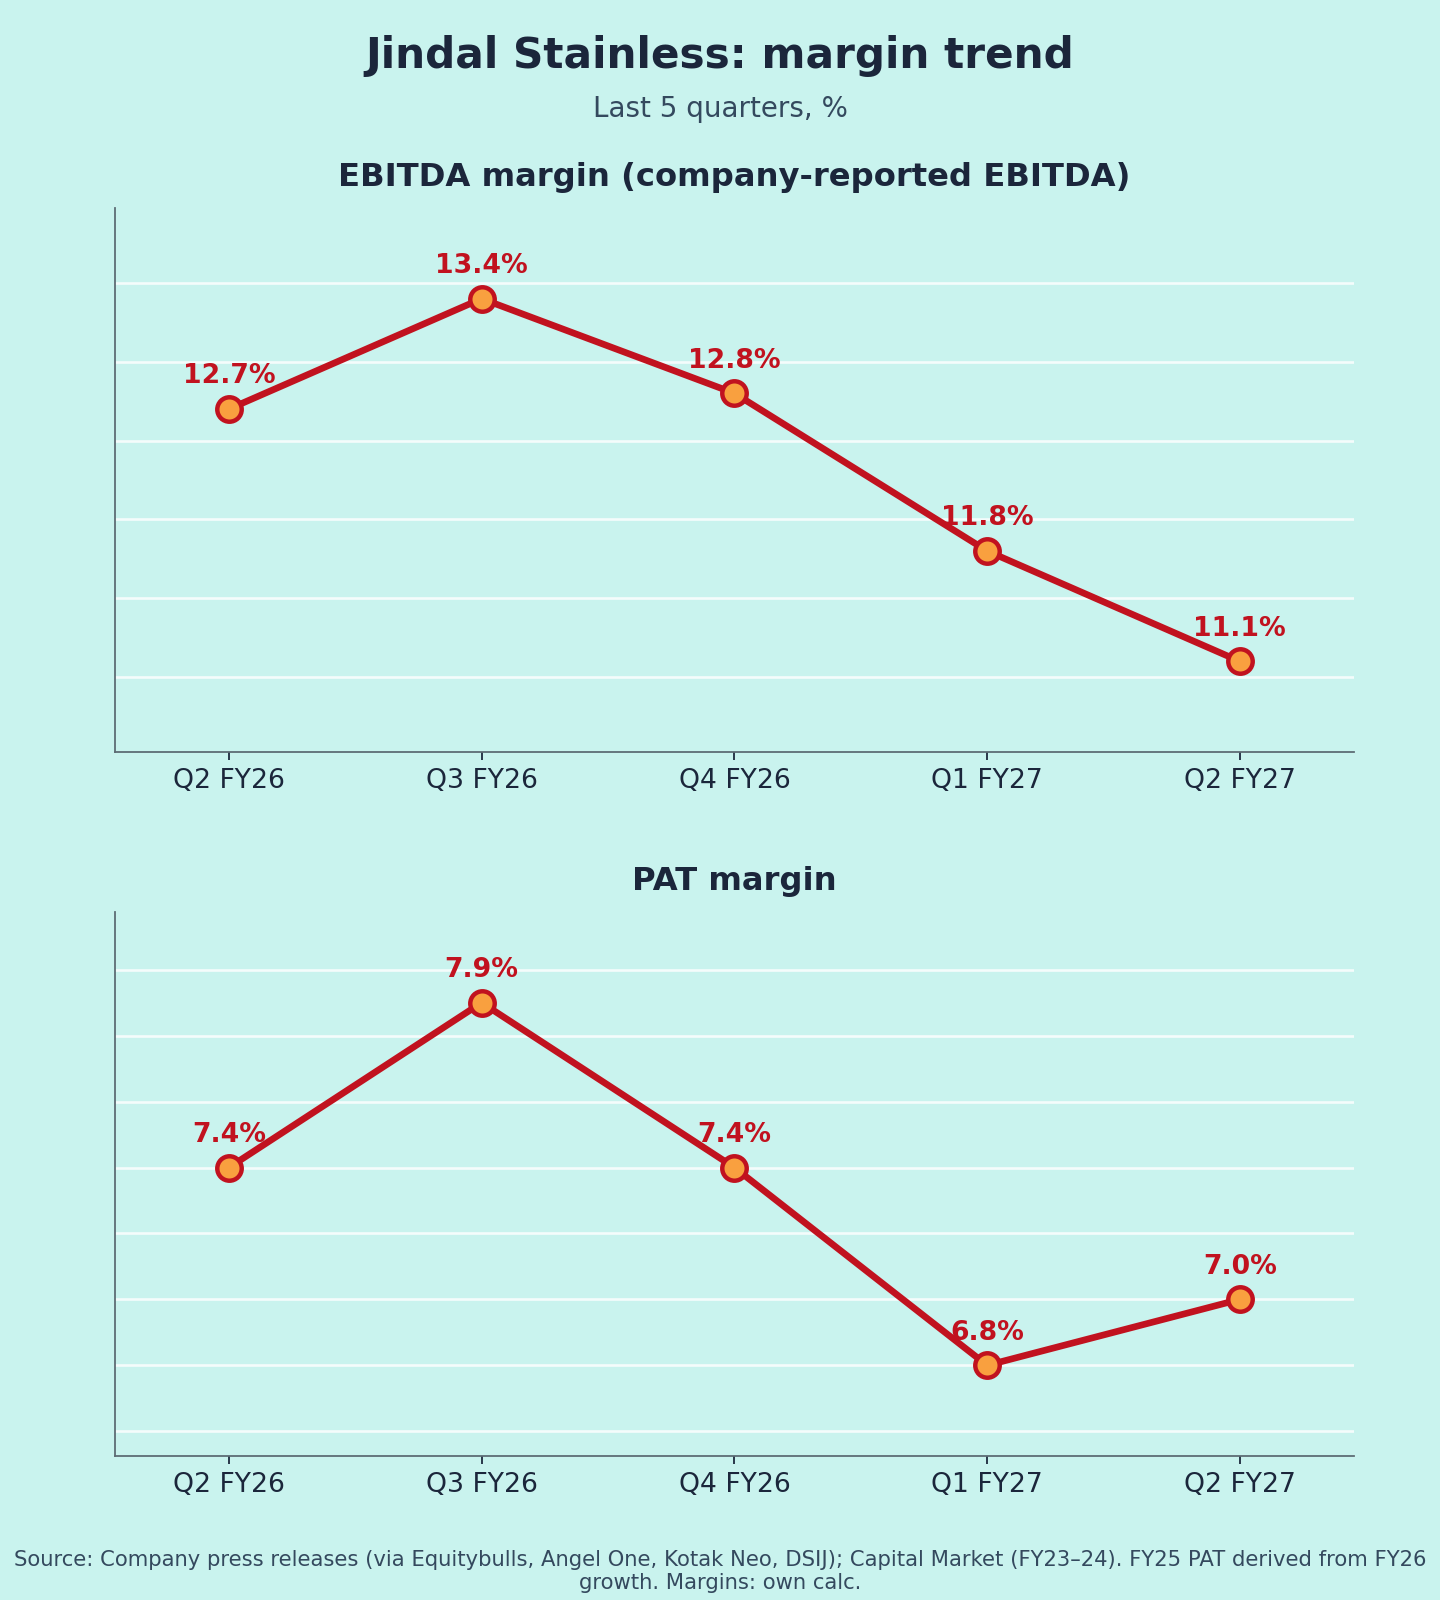
Margins (Chart 3)
EBITDA margin: 12.7% → 13.4% → 12.8% → 11.8% → 11.1% [1][3][4]. Margin has slipped for three quarters. Drivers per the company: energy costs earlier, and now cheap Chinese imports after Quality Control Orders were suspended [1][4].
Guidance: what changed
- Volume: FY27 sales-volume growth guidance cut to 4–6% from 7–9% [5]. Management chose to protect per-tonne margins over chasing volume [5].
- Imports: July imports from China were 2.9x the FY26 monthly average. The first four months of FY27 equal ~63% of all FY26 imports from China [1].
- Exports: +36% YoY and +20% QoQ; 11% of volume [1][6].
- Capacity: the 4.2 MTPA melt capacity target for FY27 [7]; I found no Q2 update on it.
- Restructuring: a scheme to merge four subsidiaries (incl. Jindal United Steel, Chromeni) into JSL [6].
Positives
- PAT +11% and above estimates [5]
- Net debt only ₹3,121 cr; net debt/equity 0.15x [1][6]
- Strong export growth [1]
Concerns
- Volume guidance cut [5]
- Chinese import surge after QCO suspension [1]
- Margin down three quarters in a row (my calculation)
Things to track in Q3 FY27
- Volume growth vs the new 4–6% guidance
- EBITDA per tonne holding near ₹21,000+
- Any policy action on imports (QCOs, safeguard duty)
- Melt-capacity progress and the merger scheme
Not a buy/sell recommendation. Facts are sourced; opinions are labelled.
Sources [1] Equitybulls – company release, 22 Oct · [2] BW Businessworld · [3] Angel One – FY26 · [4] Kotak Neo – Q4 FY26 · [5] Sahi – estimates & guidance · [6] Multibagg – Q2 presentation · [7] The Machine Maker – Q3 FY26 · [8] Business Standard – FY24 · [9] DSIJ – FY26
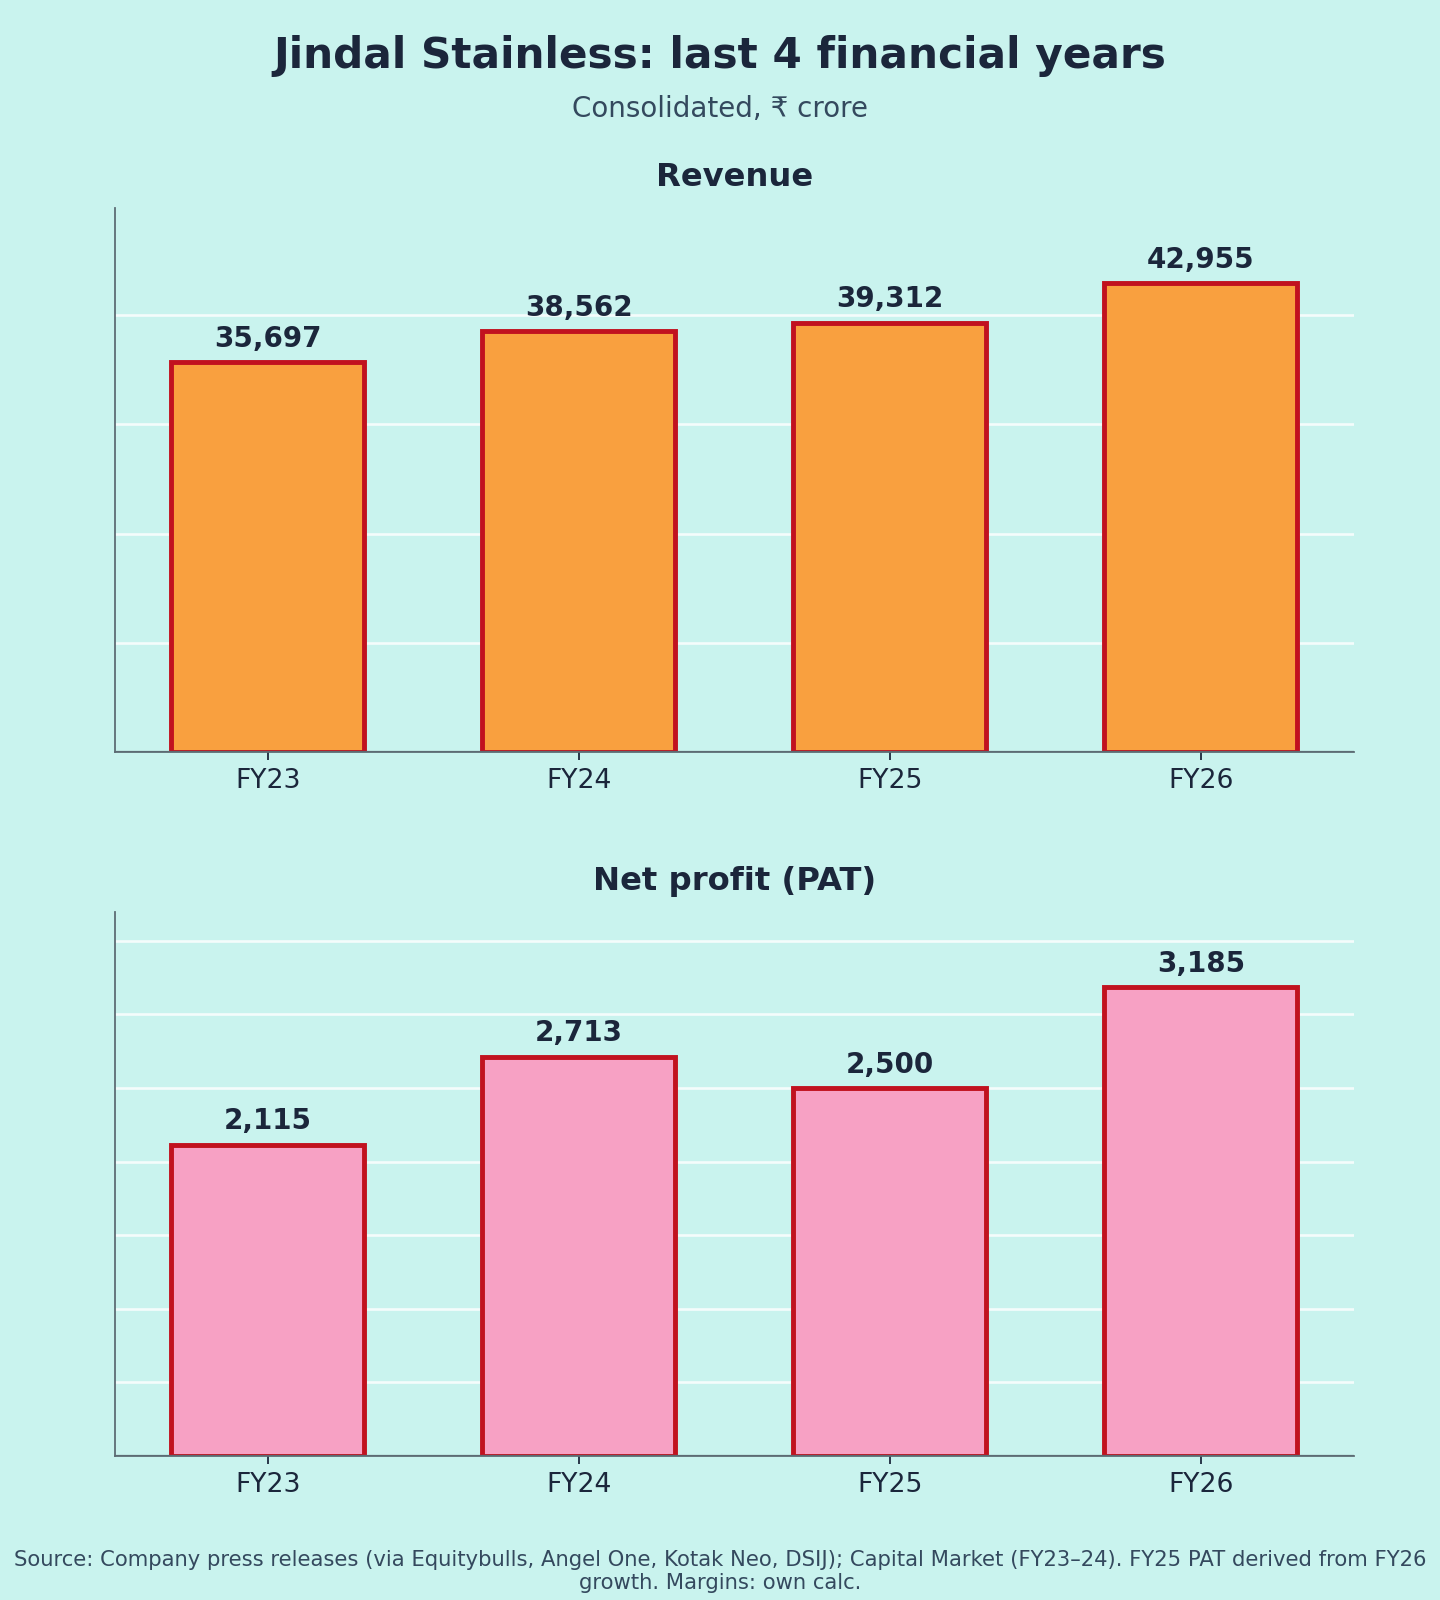
Charts: (1) last 5 quarters revenue & PAT [1][3][4][7]; (2) FY23–FY26 revenue & PAT [8][9][3] (FY25 PAT derived from FY26 growth); (3) EBITDA and PAT margin (own calc.).