Havells India (HAVELLS): Q2 FY27 Results Analysis
(Quarter ended 30 Sep 2026)
All figures consolidated, ₹ crore unless stated. Results released on 22 Oct 2026 [2][3]. EBITDA here excludes other income. YoY/QoQ %, margins and ratios are my calculations from reported numbers.
| Metric | Q2 FY27 | YoY | QoQ |
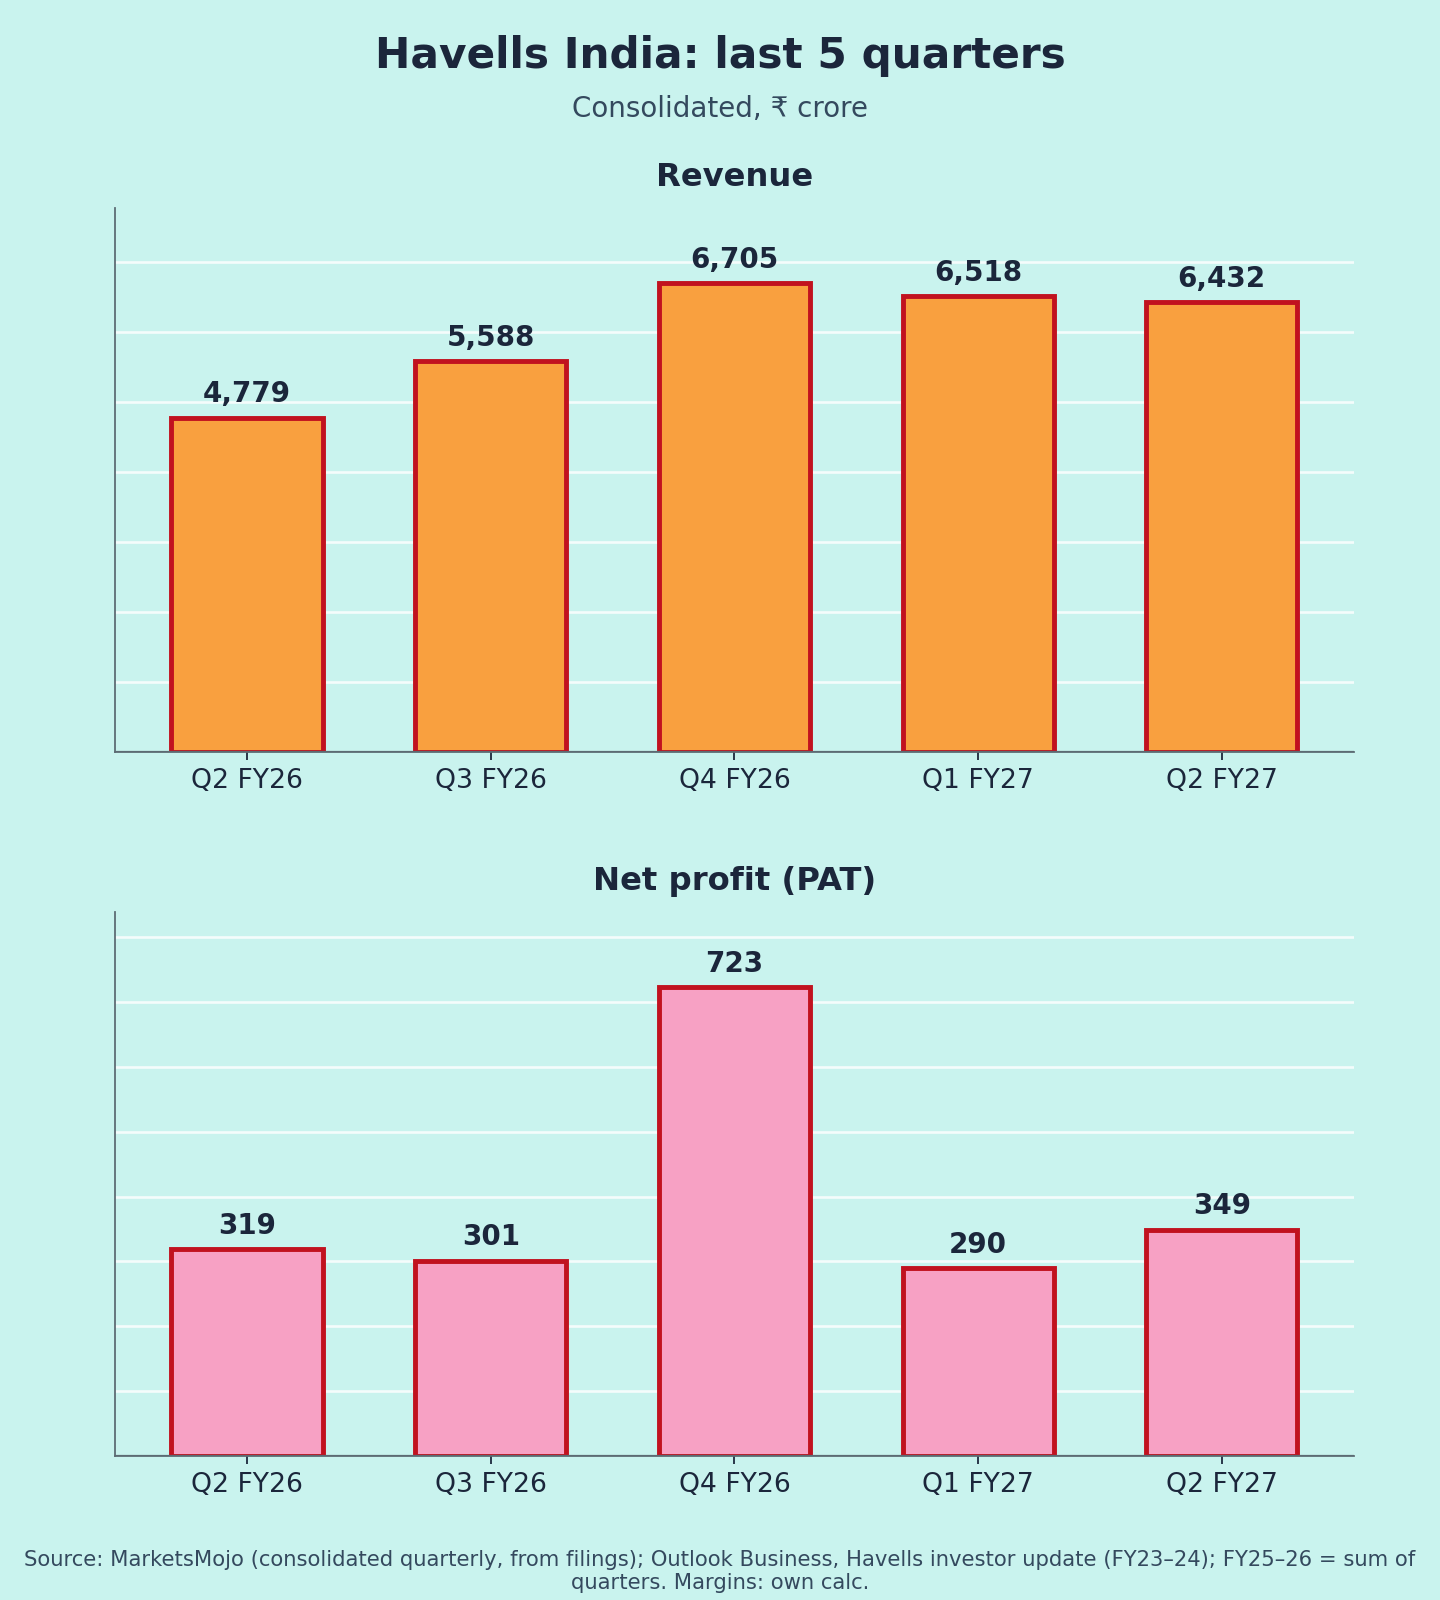
| Revenue from ops | 6,432 | +34.6% | −1.3% |
| EBITDA (ex-OI) | 573 | +30.8% | +23.0% |
| EBITDA margin | 8.9% | 9.2% | 7.2% |
| PBT | 473 | +14.0% | +20.5% |
| PAT | 349 | +9.7% | +20.5% |
| PAT margin | 5.4% | 6.7% | 4.4% |
| Other income / PBT | 6.9% | 20.8% | 13.8% |
Sources: [1][2]
Quality of earnings
The operating business did well: EBITDA rose 31%. The weak spot sits below EBITDA.
- Other income fell to ₹33 cr from ₹86 cr [1]. Cash fell to ₹1,190 cr from ₹2,351 cr in H1, after capex and payouts [5].
- Tax rate rose to ~26% from ~23% (my calculation from [1]).
Together these are why PAT grew only ~10%. No exceptional item this quarter (Q3 FY26 had a ₹45 cr charge) [1].
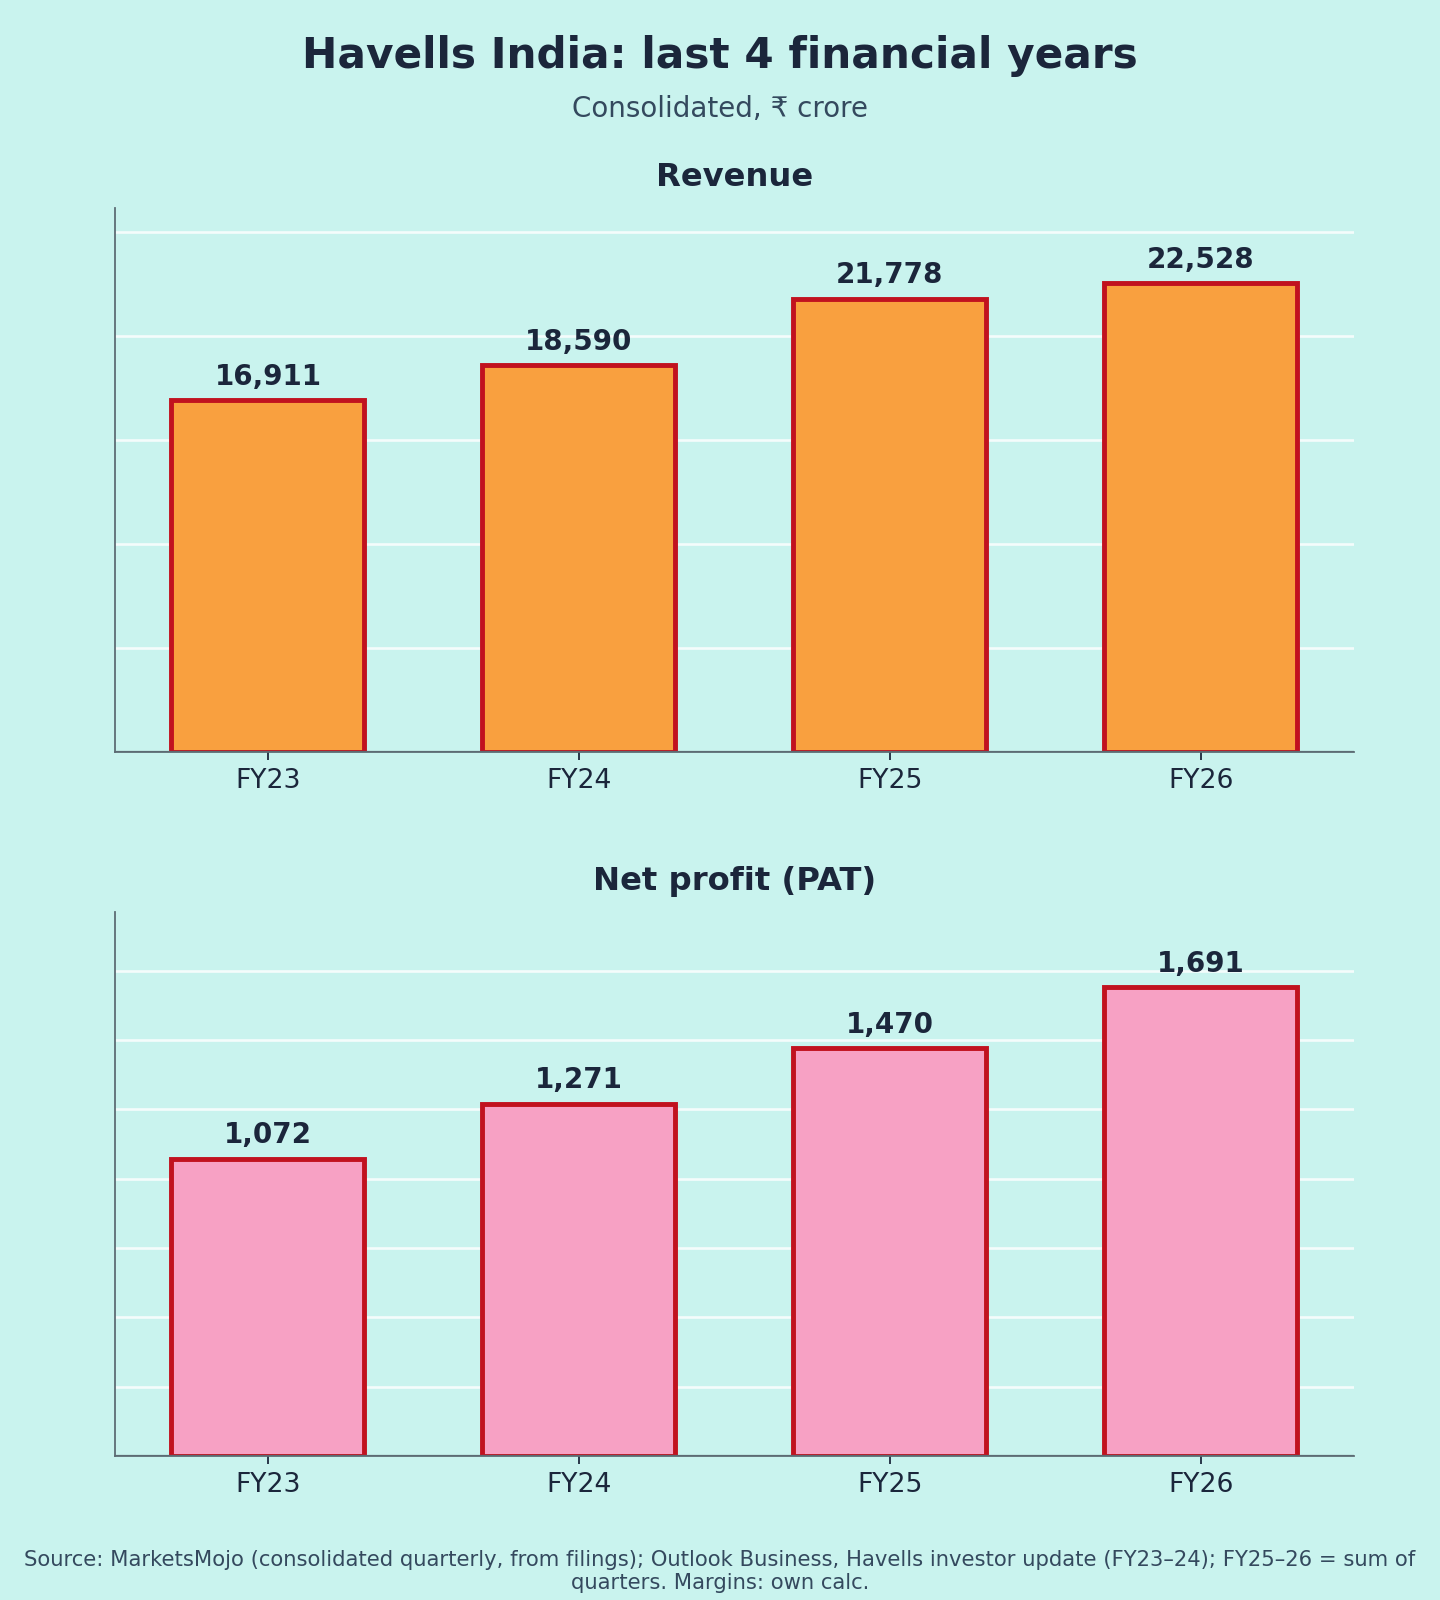
Base note: Q2 FY26 revenue had grown only ~5% [1], so the 35% jump is partly off a soft base. Q4 FY26 PAT (₹723 cr) was lifted by ₹296 cr of other income [1], which flatters the FY26 annual bar in Chart 2.
Segments
- Cables: revenue +47.9% to ₹2,999 cr, now close to half of sales [6].
- Lloyd: revenue up ~28% but a segment loss of ₹105.5 cr in its off-season quarter [7][8].
- Contribution margin: fell to 18.2% from 20.1%, mainly cables, where falling aluminium prices hurt [4][5]. Other businesses passed on cost inflation through price hikes [5].
Margins (Chart 3)
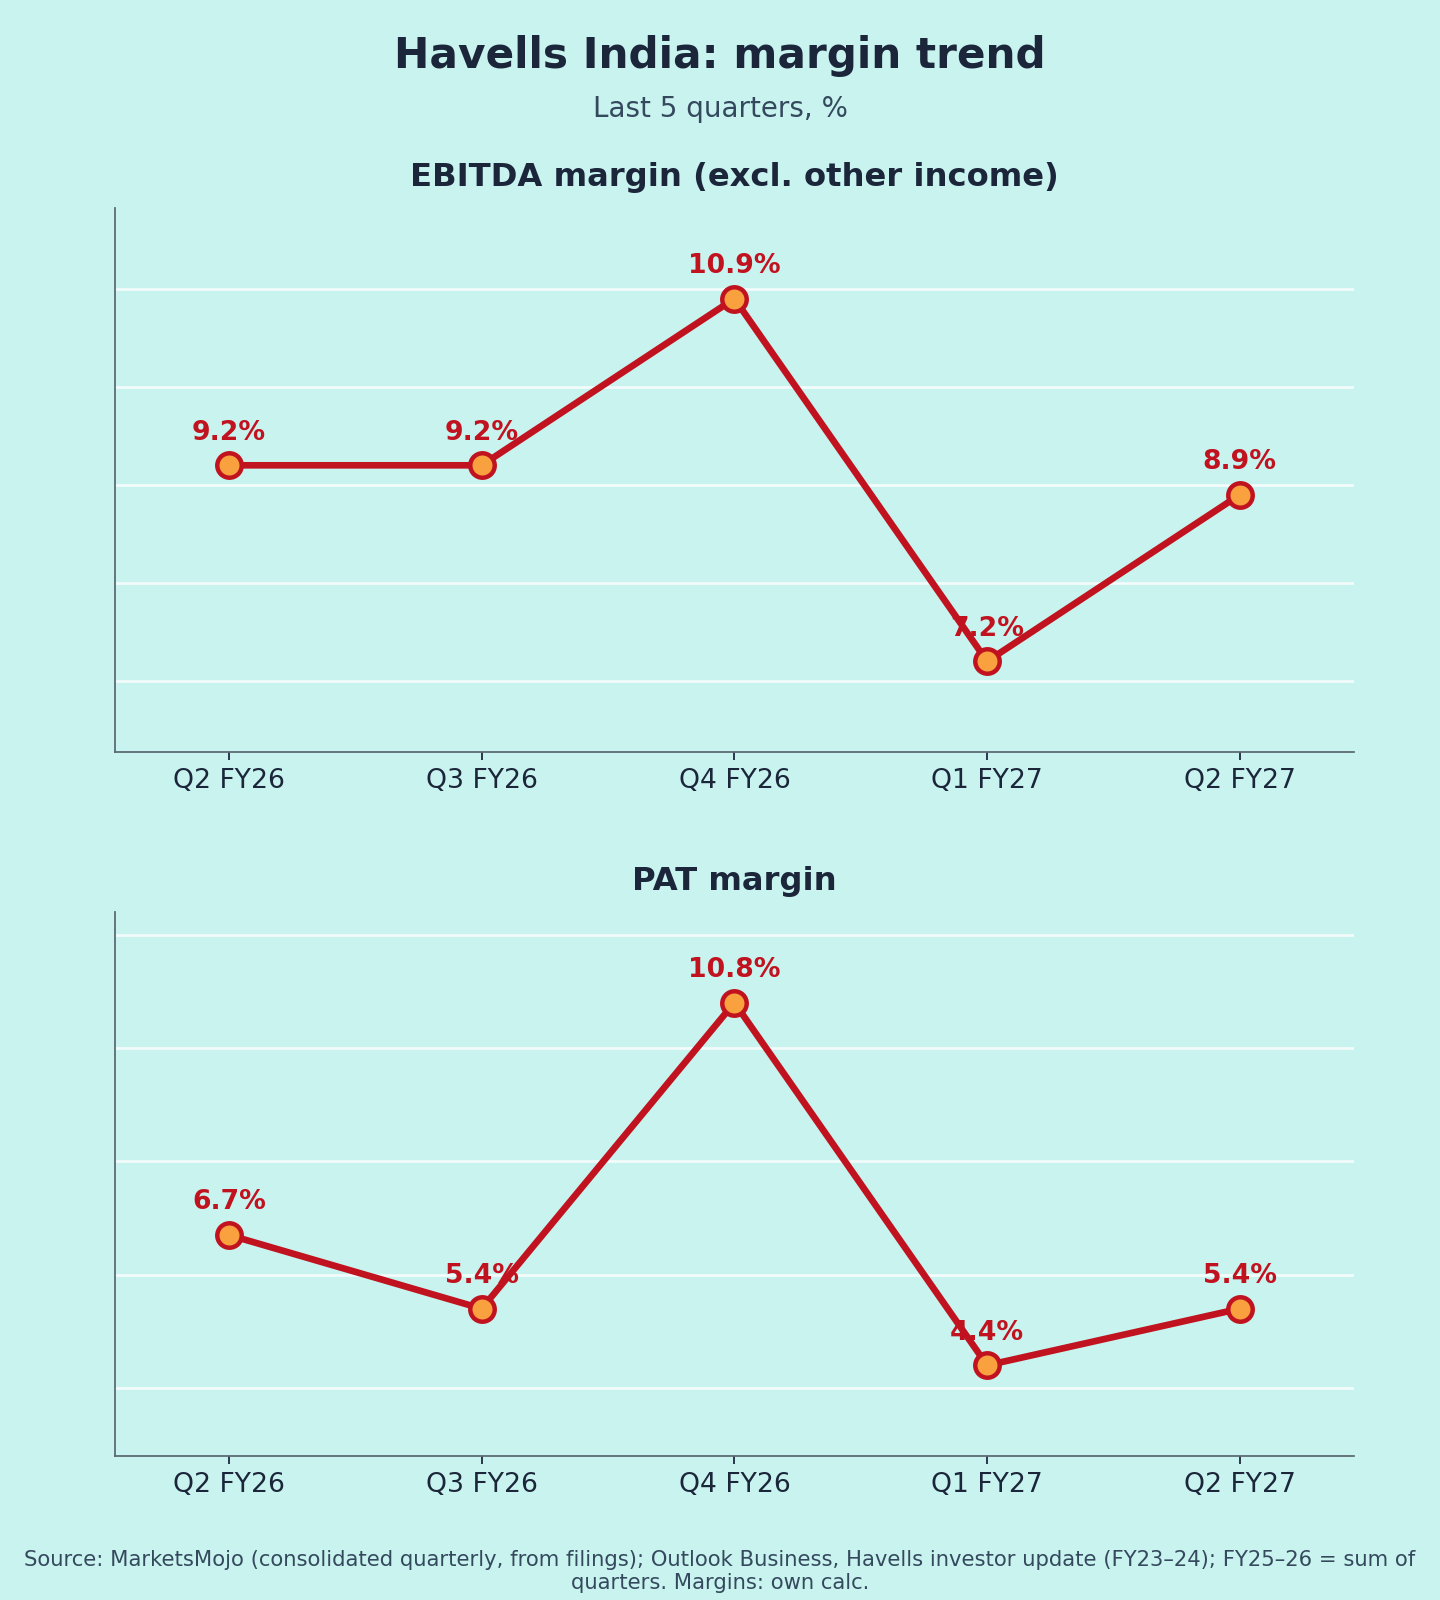
EBITDA margin (ex-OI): 9.2% → 9.2% → 10.9% → 7.2% → 8.9% [1]. Q2 recovered from the Q1 low but stayed below last year. Mix shift toward lower-margin cables explains part of it (interpretation).
Guidance: what changed
- Margin: a year ago, management hoped for ~100–150 bps margin expansion in FY27 [9]. H1 FY27 EBITDA margin is ~8.0% vs ~9.3% in H1 FY26 (my calculation from [1]). Running well behind that hope.
- Capex: ₹1,400 cr for FY27, unchanged, mostly cables/wires and an R&D centre [5][8]. Full capacity expansion is expected within 18 months [8].
- Cables margin: the long-term contribution band of ~15–16% is reiterated; H1 is ~15% [8][9].
Market reaction (interpretation)
The stock closed at ₹1,075.60 (+0.4%) on 22 Oct [6]. Revenue was strong, but margin pressure in cables and Lloyd balanced it out.
Positives
- Revenue +35% and EBITDA +31% YoY [1]
- Cables growing fast on infra/project demand [6]
- Switchgear contribution margin steady at ~38–39% [8]
Concerns
- Lloyd still loss-making in its off-season (~₹105 cr) [7]
- Margin expansion hope for FY27 is slipping [9]
- Lower other income and cash after heavy capex [1][5]
- Cable margins swing with copper/aluminium prices (my view)
Things to track in Q3 FY27
- EBITDA margin back toward ~10% as Lloyd losses ease
- Cables contribution margin vs the 15–16% band
- Lloyd ahead of the summer season
- Capex progress and cash balance
Not a buy/sell recommendation. Facts are sourced; opinions are labelled.
Sources [1] MarketsMojo – consolidated quarterly · [2] Trade Brains, 22 Oct · [3] InvestyWise – company release · [4] Kotak Neo · [5] Multibagg – information update · [6] Multibagg – results & price · [7] Indian Television – segments · [8] Investing.com – call transcript · [9] Broker note, Oct 2025 (BS) · [10] Outlook Business – FY23 · [11] Equitymaster – FY24 quarters
Charts: (1) last 5 quarters revenue & PAT [1]; (2) FY23–FY26 revenue & PAT [1][10][11] (FY24–FY26 summed from quarters); (3) EBITDA and PAT margin (own calc. from [1]).