Godrej Properties (GODREJPROP): Q2 FY27 results analysis
(quarter ended 30 Sep 2026)
All figures consolidated, ₹ crore unless stated. Results released on 23 Oct 2026. EBITDA and PAT are the company's figures. YoY/QoQ % and margins are my calculations.
| Metric | Q2 FY27 | YoY | QoQ |
| Total income (filing) | 2,571.7 | +31.9% | +91.2% |
| EBITDA (company) | 171 | −72.1% | −68.6% |
| EBITDA margin | 6.6% | 32.9% | 40.8% |
| PBT | 98 | −82.7% | −79.6% |
| PAT (owners) | 154 | −62.0% | −55.9% |
| PAT margin | 6.0% | 21.7% | 26.2% |
| Interest & other income / PBT | ~650% | – | – |
| Booking value | 8,008 | −6% | −7% |
| Collections | 5,318 | +31% | +22% |
For margin and ratio rows, the YoY and QoQ columns show the prior-period value. Sources: [1][2][3][8]
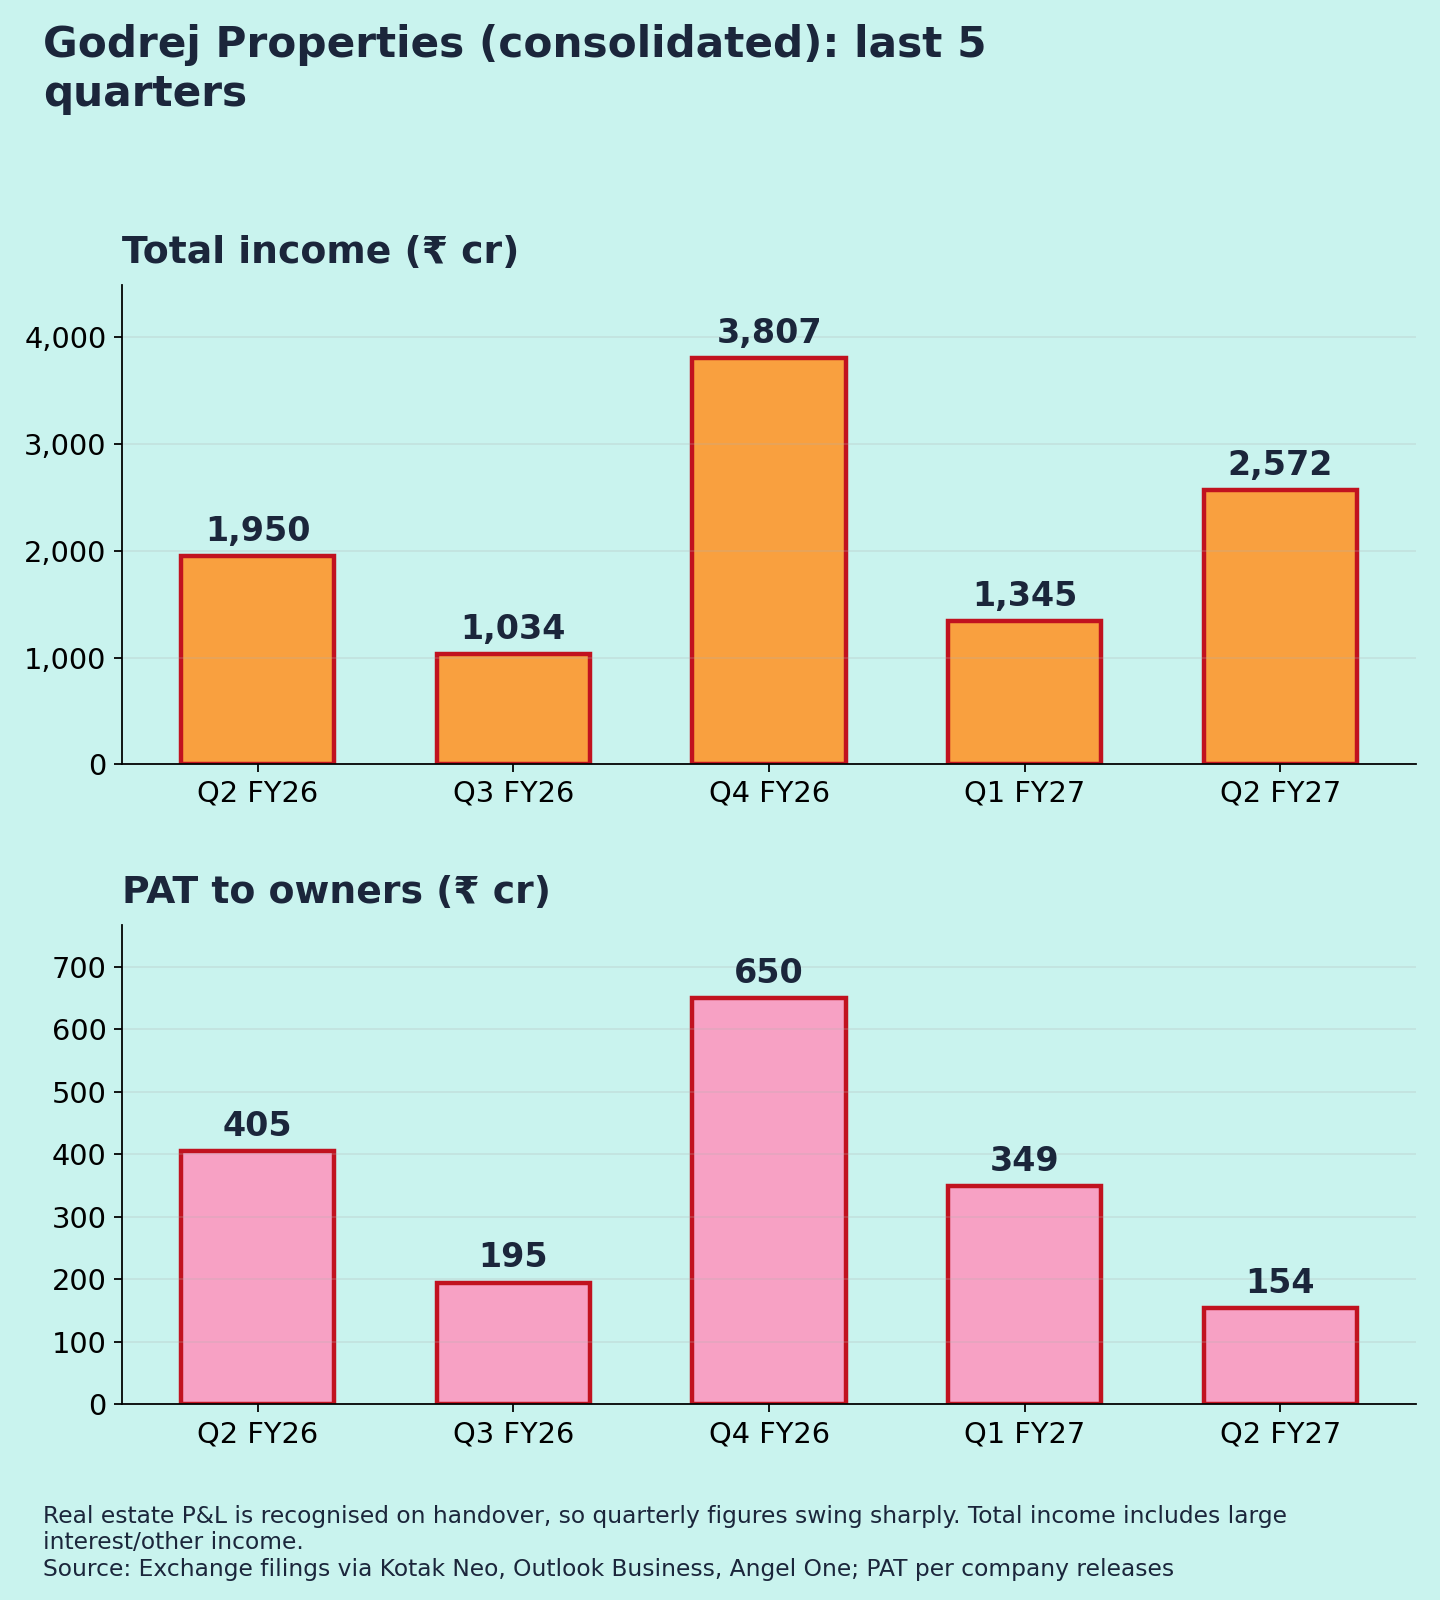
Source note: the company deck shows total income of ₹2,575 cr, +38% on a ₹1,867 cr base [2]. The filing shows ₹2,571.7 cr against ₹1,950.1 cr, which is +31.9% [3][13]. Angel One's "₹145.5 cr profit" is a different line from the company's ₹154 cr [3].
Read P&L and bookings separately
Real estate revenue is booked on handover, not on sale. Bookings and collections show how the business is doing today.
- Bookings: ₹8,008 cr, the 7th straight quarter above ₹7,000 cr, but down 6% YoY. Some launches slipped into Q3; only ₹5,500 cr was launched in Q2 [2].
- Sustenance sales: ₹5,054 cr, +83% [1]. These are sales from projects launched earlier.
- H1: a record ₹16,659 cr of bookings, +7% [1].
- Cash: collections +31% and operating cash flow of ₹1,584 cr [2].
Quality of earnings
This is the weak spot. One project, Mahalunge in Pune, contributed ₹1,589 cr of total income [2]. Interest and other income was ₹637 cr, about 6.5x PBT [2]. My reading: the development business earned very little this quarter.
PAT (₹154 cr) is higher than PBT (₹98 cr). That implies a tax credit and/or JV share added below PBT; the sources I found don't say which.
Base effect: Q2 FY26 was strong (PBT ₹566 cr) [2], so part of the fall is a high base.
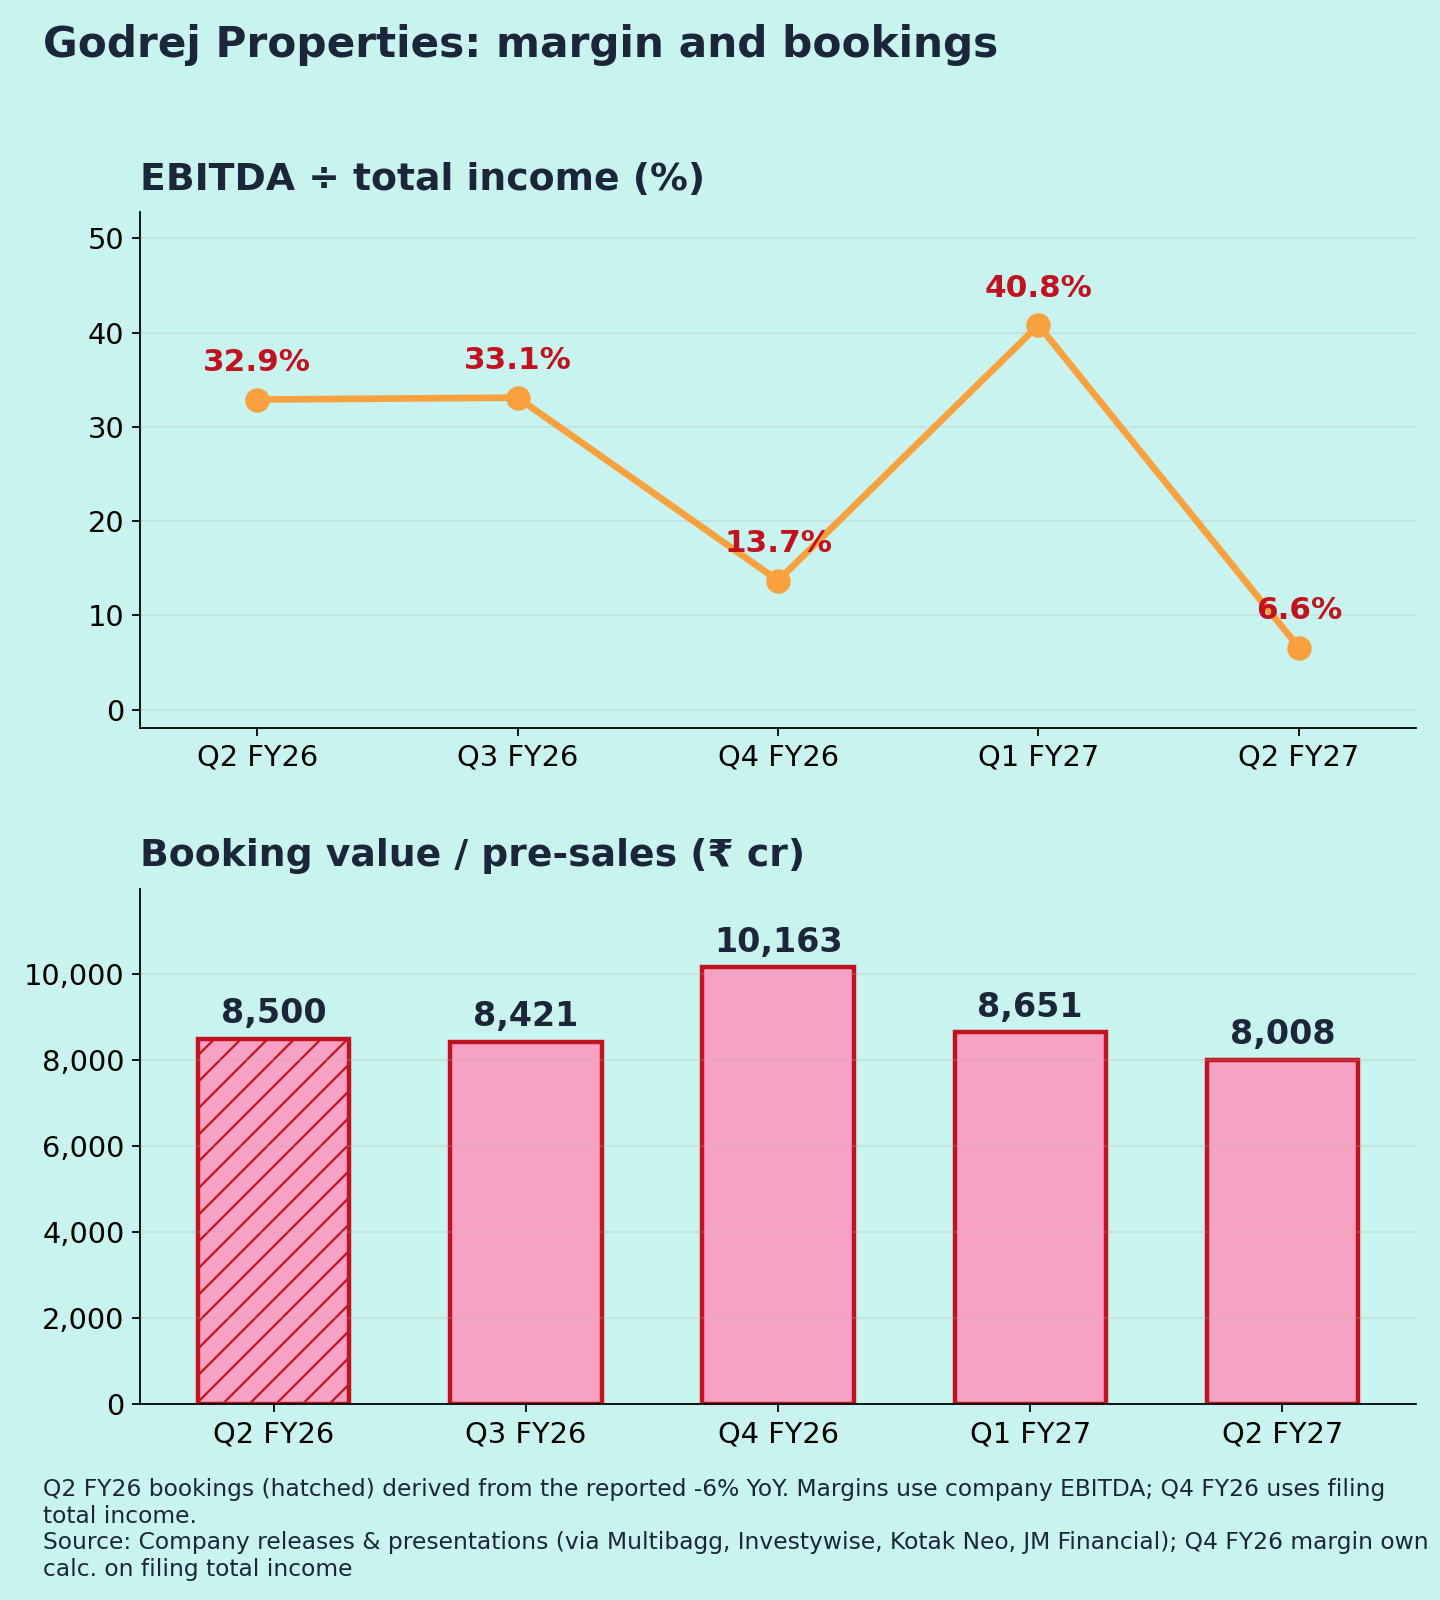
Margins (Chart 3)
EBITDA margin: 32.9% → 33.1% → 13.7% → 40.8% → 6.6% [2][8][10][11]. It swings with which projects get handed over (interpretation).
Guidance: what changed
- FY27 bookings: at Q4 the target was "over ₹39,000 cr" [7]. Now it is 15–20% growth [2], about ₹39,300–41,000 cr on FY26's ₹34,171 cr [6]. Broadly unchanged.
- H2 bookings: ₹22,500–25,000 cr, 35–50% above H1 (my calculation). This rests on about ₹32,000 cr of launches [2].
- Cash: H2 collections of ~₹15,000 cr, H2 operating cash flow of ~₹7,000 cr, and free cash flow positive in H2 [2].
- Revenue recognition: about ₹40,000 cr of bookings to reach the P&L by FY28, vs ~₹15,000 cr in FY25–26 [2].
- Debt: net debt ₹6,414 cr (Mar) → ₹7,637 cr (Jun) → ₹7,908 cr (Sep); net debt/equity 0.41 [2][9].
Market reaction (interpretation)
The shares fell 4.73% on 23 Oct. Likely reasons: a 62% PAT drop, lower YoY bookings and rising net debt.
Positives
- Record H1 bookings and collections [1]
- Sustenance sales +83% [1]
- H1 business development already 78% of the FY target [2]
Concerns
- Thin core profit; heavy reliance on other income [2]
- Net debt up ₹1,494 cr since March [2]
- The H2 plan depends on launch approvals; Q1 deliveries were only 7% of the annual target [15]
Things to track in Q3 FY27
- Q3 launches and bookings vs the H2 guidance
- Collections toward ₹15,000 cr in H2
- Whether net debt starts falling
- Deliveries, which drive future reported profit
Not a buy/sell recommendation. Facts are sourced; opinions are labelled.
Sources [1] Business Standard, 24 Oct 2026 · [2] Multibagg – Q2 FY27 presentation summary · [3] Angel One – filing figures · [4] Kotak Neo · [5] Investing.com – slides · [6] Outlook Business – FY26 · [7] Outlook Business – FY27 target · [8] JM Financial – Q1 FY27 · [9] FilingReader – Q1 FY27 net debt · [10] Investywise – Q3 FY26 · [11] Kotak Neo – Q4 FY26 · [12] Business Standard – FY24 · [13] Kotak Neo – Q3 FY26 filing (Q2 FY26 total income) · [14] Angel One – Q1 FY27 · [15] Quartr – Q1 FY27 summary
Charts:
(1) last 5 quarters total income & PAT;
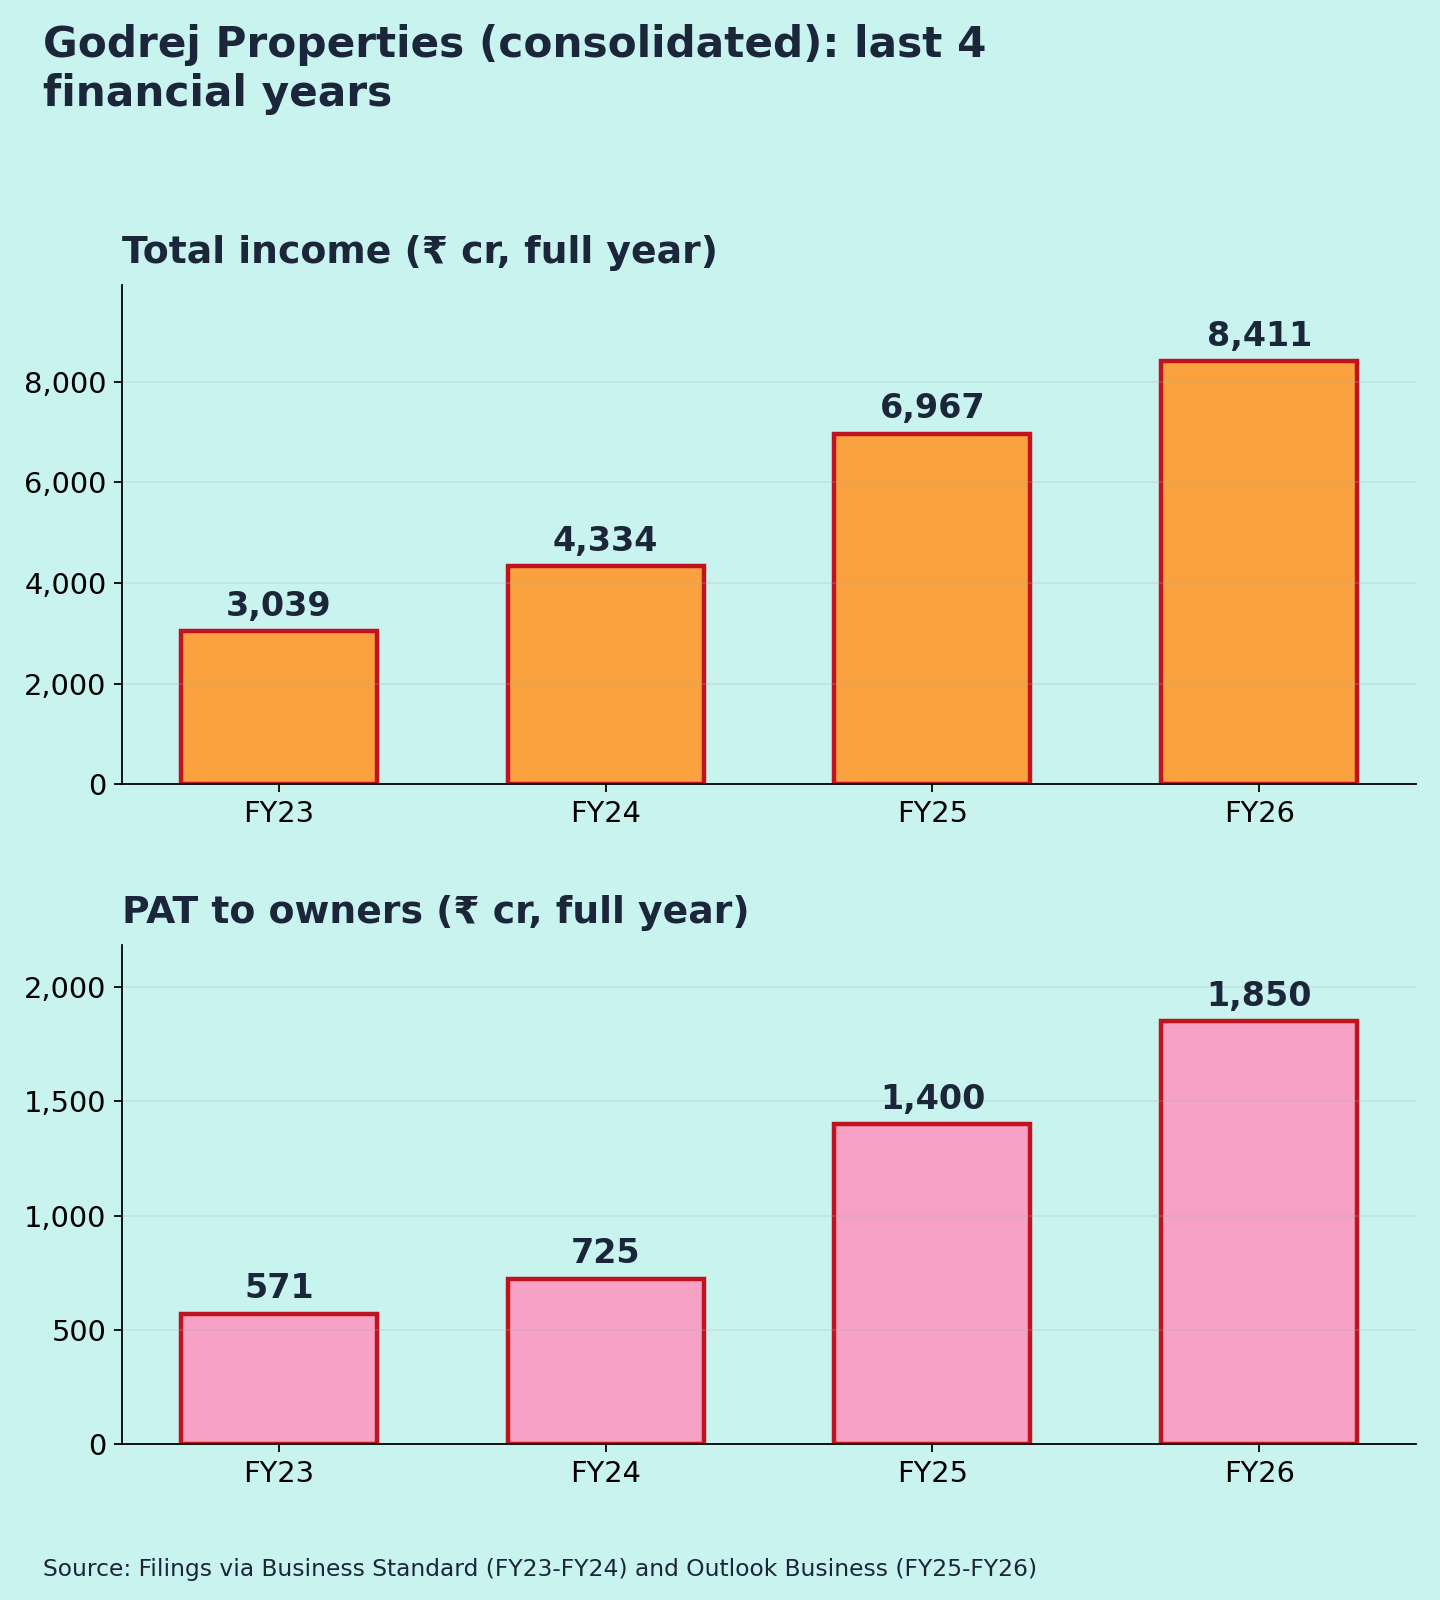
(2) FY23–FY26 total income & PAT;
(3) EBITDA margin and bookings . Q2 FY26 bookings are derived from the reported −6% YoY.