DCB Bank (DCBBANK): Q2 FY27 results analysis
(Quarter ended 30 Sep 2026)
All figures standalone (the basis the bank reports on), ₹ crore unless stated. Results released on 23 Oct 2026. YoY/QoQ % and CD ratio are my calculations from reported numbers.
| Metric | Q2 FY27 | YoY | QoQ |
| Advances | 64,127 | +21.1% | +7.0% |
| Deposits | 76,839 | +18.6% | +3.2% |
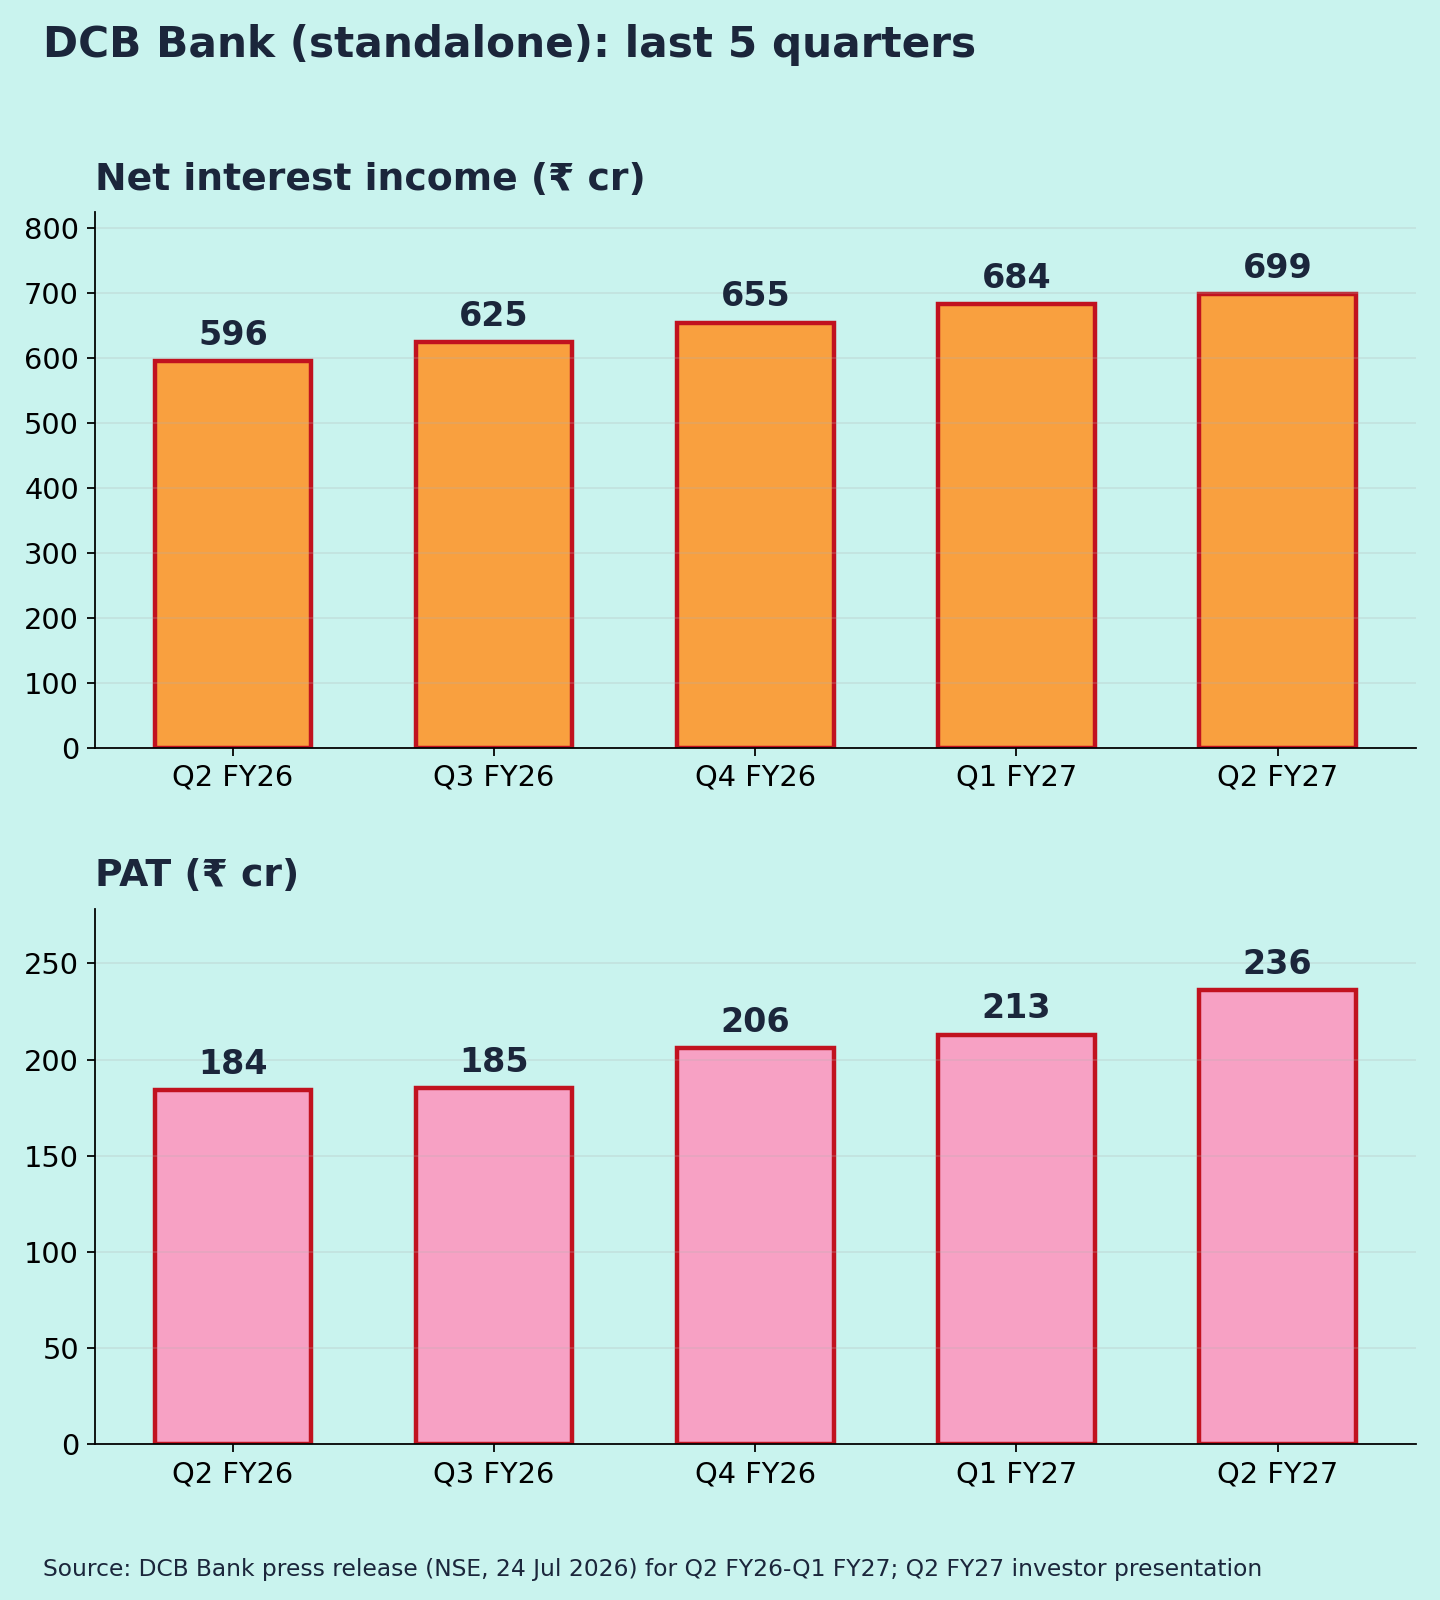
| NII | 699 | +17.3% | +2.2% |
| NIM | 3.25% | 3.23% | 3.35% |
| Other income | 249 | +34% | +27% |
| Operating profit | 383 | +25.9% | +11.2% |
| Provisions | 65 | slightly higher | +14% |
| Credit cost | 0.28% | – | 0.26% |
| PAT | 236.4 | +28.5% | +10.9% |
| GNPA / NNPA | 2.29% / 0.73% | 2.91% / 1.21% | 2.43% / 0.84% |
| PCR | 81.4% | 74.2% | 79.8% |
| CASA | 22.3% | 23.5% | 21.7% |
| CD ratio | 83.5% | 81.8% | 80.5% |
| CRAR | 16.63% | – | 17.03% |
| RoA / RoE | 1.03% / 14.6% | 0.94% / 13.2% | – |
For ratio rows, the YoY and QoQ columns show the prior-period value.
Quality of earnings
Profit growth is core-led:
- NII: +17%, roughly in line with loan growth [1].
- Fees: commission, exchange and brokerage were ₹195 cr of the ₹249 cr other income [1]. Q1 other income had been hit by an ₹85 cr one-time treasury drop [16], so the +27% QoQ partly reflects that low base.
- Costs: up 18%, slower than revenue (+21%). Cost-to-income improved to 59.6% [1].
- Tax: a normal ~26% (₹81.7 cr on PBT of ₹318 cr) [1][5].
One tailwind may not last. The credit cost of 0.28% [3] is well below the bank's own 45–55 bps planning range [1]. So part of the PAT growth comes from low provisions (my view).
Base effect: Q2 FY26 was a normal quarter, so YoY growth isn't flattered.
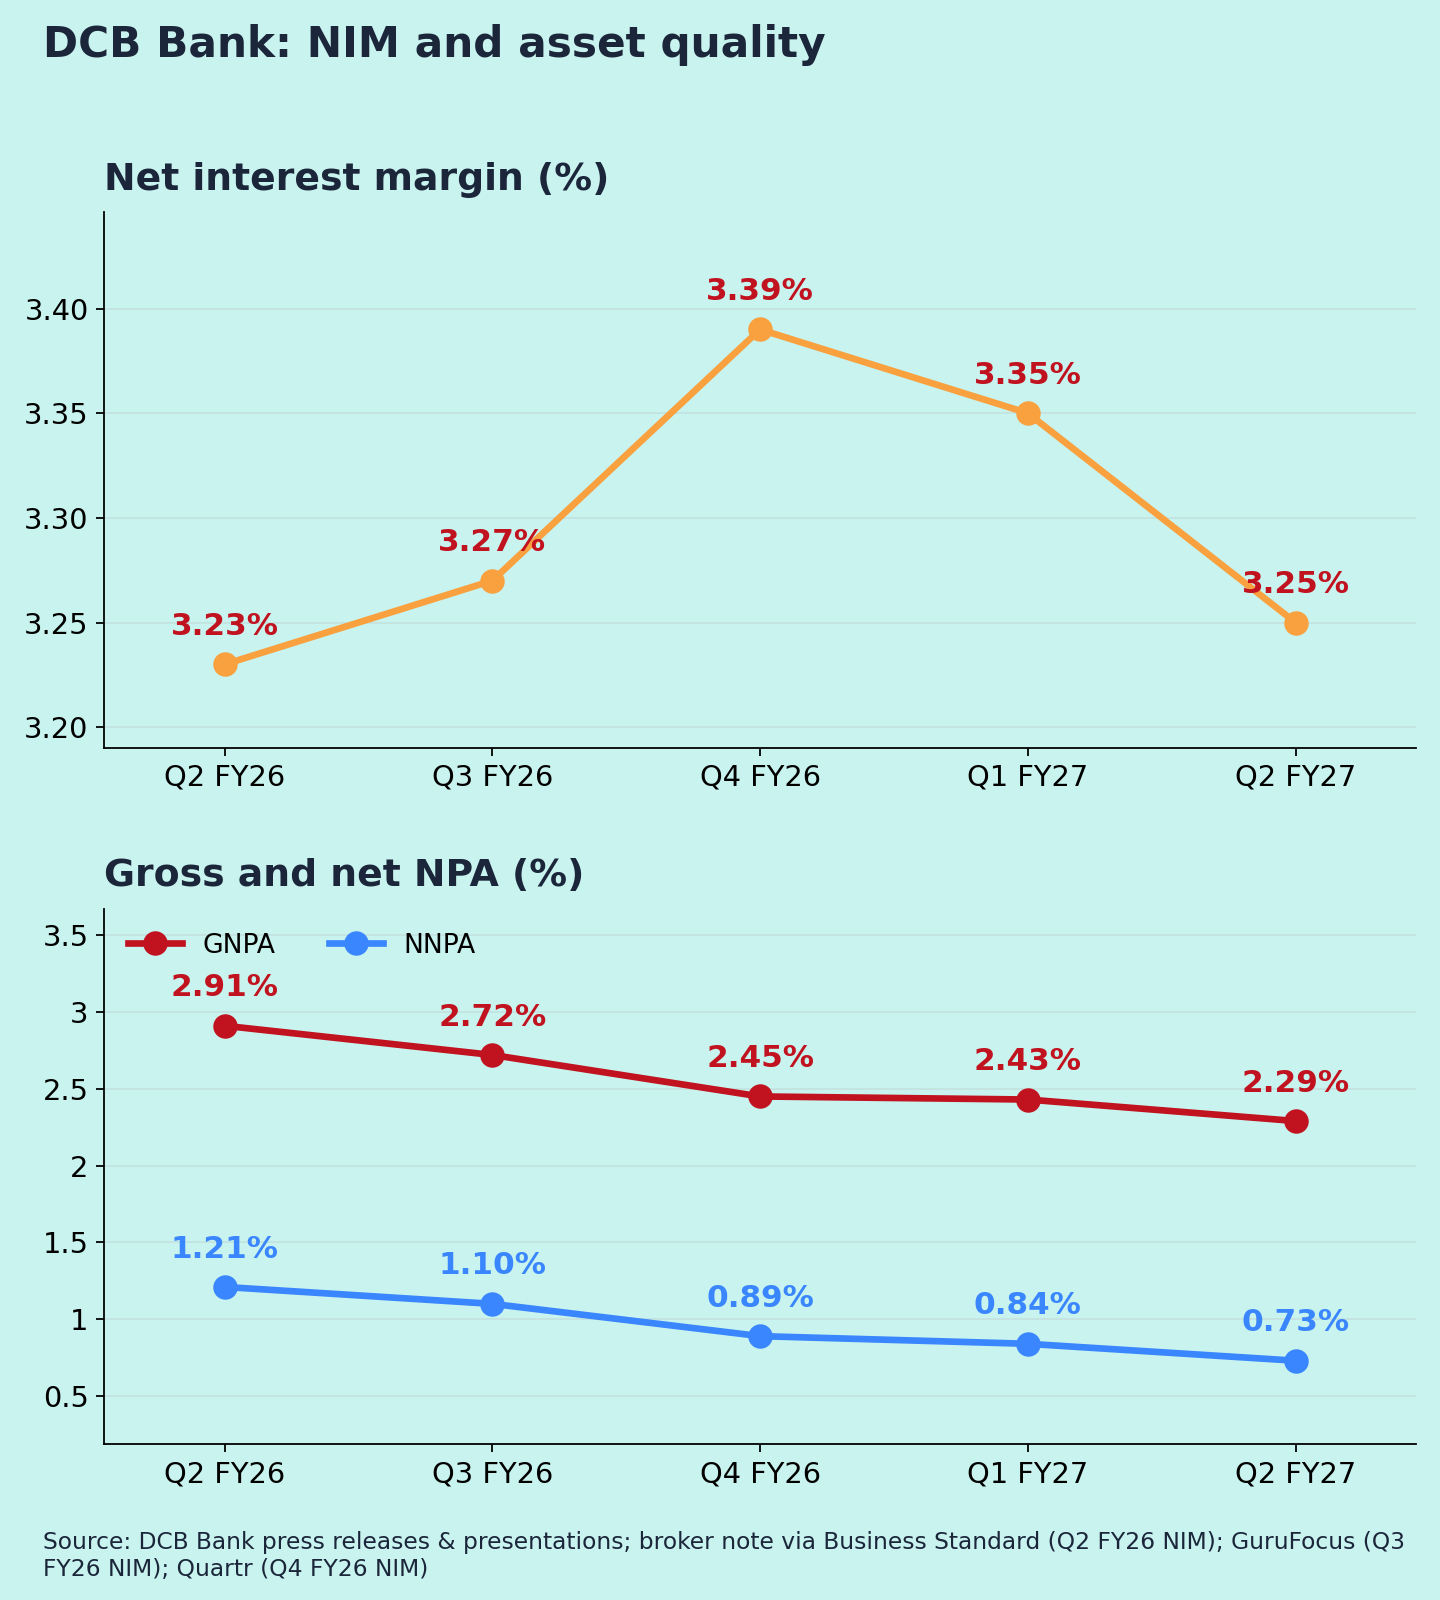
NIM and asset quality (Chart 3)
NIM over five quarters: 3.23% → 3.27% → 3.39% → 3.35% → 3.25%. Management blamed the Q2 dip on excess liquidity from FCNR(B) deposits and lower loan yields (10.73%), even as the cost of deposits fell to 6.65% [1][3].
GNPA fell steadily from 2.91% to 2.29%, and NNPA from 1.21% to 0.73% [1][7]. Both are 23-quarter lows [3].
Guidance: what changed
- Business-model targets [1]:
- NIM: 3.50–3.65%. Q2 is still below this range.
- Asset quality: GNPA below 2.5%, NNPA at 1%.
- Credit cost: 45–55 bps; cost-to-income at or below 60%.
- ROE: the FY27 guidance of 13.5% is being beaten (14.6%) [3].
- NIM path: after Q3 FY26, management expected NIM to improve through Q1–Q2 FY27, barring repo moves [9]. It rose in Q4, then slipped in Q1–Q2 (my reading). It now sees a recovery ahead [3]. RBI raised the repo rate to 5.50% on 9 Oct [17]. The effect on NIM depends on how fast loans reprice vs deposits (interpretation).
- Ownership: RBI has cleared ICICI Prudential AMC to acquire up to 9.95% of the bank [2].
Positives
- Record PAT for the fifth straight quarter [3]
- NPAs at multi-year lows; PCR up to 81% [1]
- RoA above 1% [1]
Concerns
- CASA falling to 22.3%; heavy reliance on term deposits [1]
- Gold loans +142% YoY, with gold-loan slippages rising to 8.04% [1]
- NIM still below the bank's own target band [1]
- Credit cost likely to normalise upward (my view)
Things to track in Q3 FY27
- NIM recovery as the FCNR liquidity is deployed
- CASA ratio trend
- Gold-loan slippages
- Credit cost vs the 45–55 bps range
Not a buy/sell recommendation. Facts are sourced; opinions are labelled.
Sources
[1] Multibagg – Q2 FY27 investor presentation summary ·
[2] Free Press Journal, 23 Oct 2026 ·
[3] GuruFocus – Q2 FY27 call highlights ·
[4] Investing.com – call transcript ·
[5] Equitybulls – filing ·
[6] NSE – Q1 FY27 press release ·
[7] NSE – Q4 FY26 press release ·
[8] JM Financial – Q1 FY27 ·
[9] GuruFocus via Yahoo – Q3 FY26 call ·
[10] Quartr – Q4 FY26 summary ·
[11] Broker note via Business Standard – Q2 FY26 ·
[12] Quartr – FY25 summary ·
[13] Business Standard – FY24 ·
[14] BOB Capital – FY23 NII ·
[15] Free Press Journal – Q1 FY27 CRAR · [16] Quartr – Q1 FY27 summary ·
[17] SCC Online – RBI policy, 9 Oct 2026 ·
[18] Business Standard – Q1 FY25 (Q1 FY24 NII) ·
Charts:
(1) last 5 quarters NII & PAT;
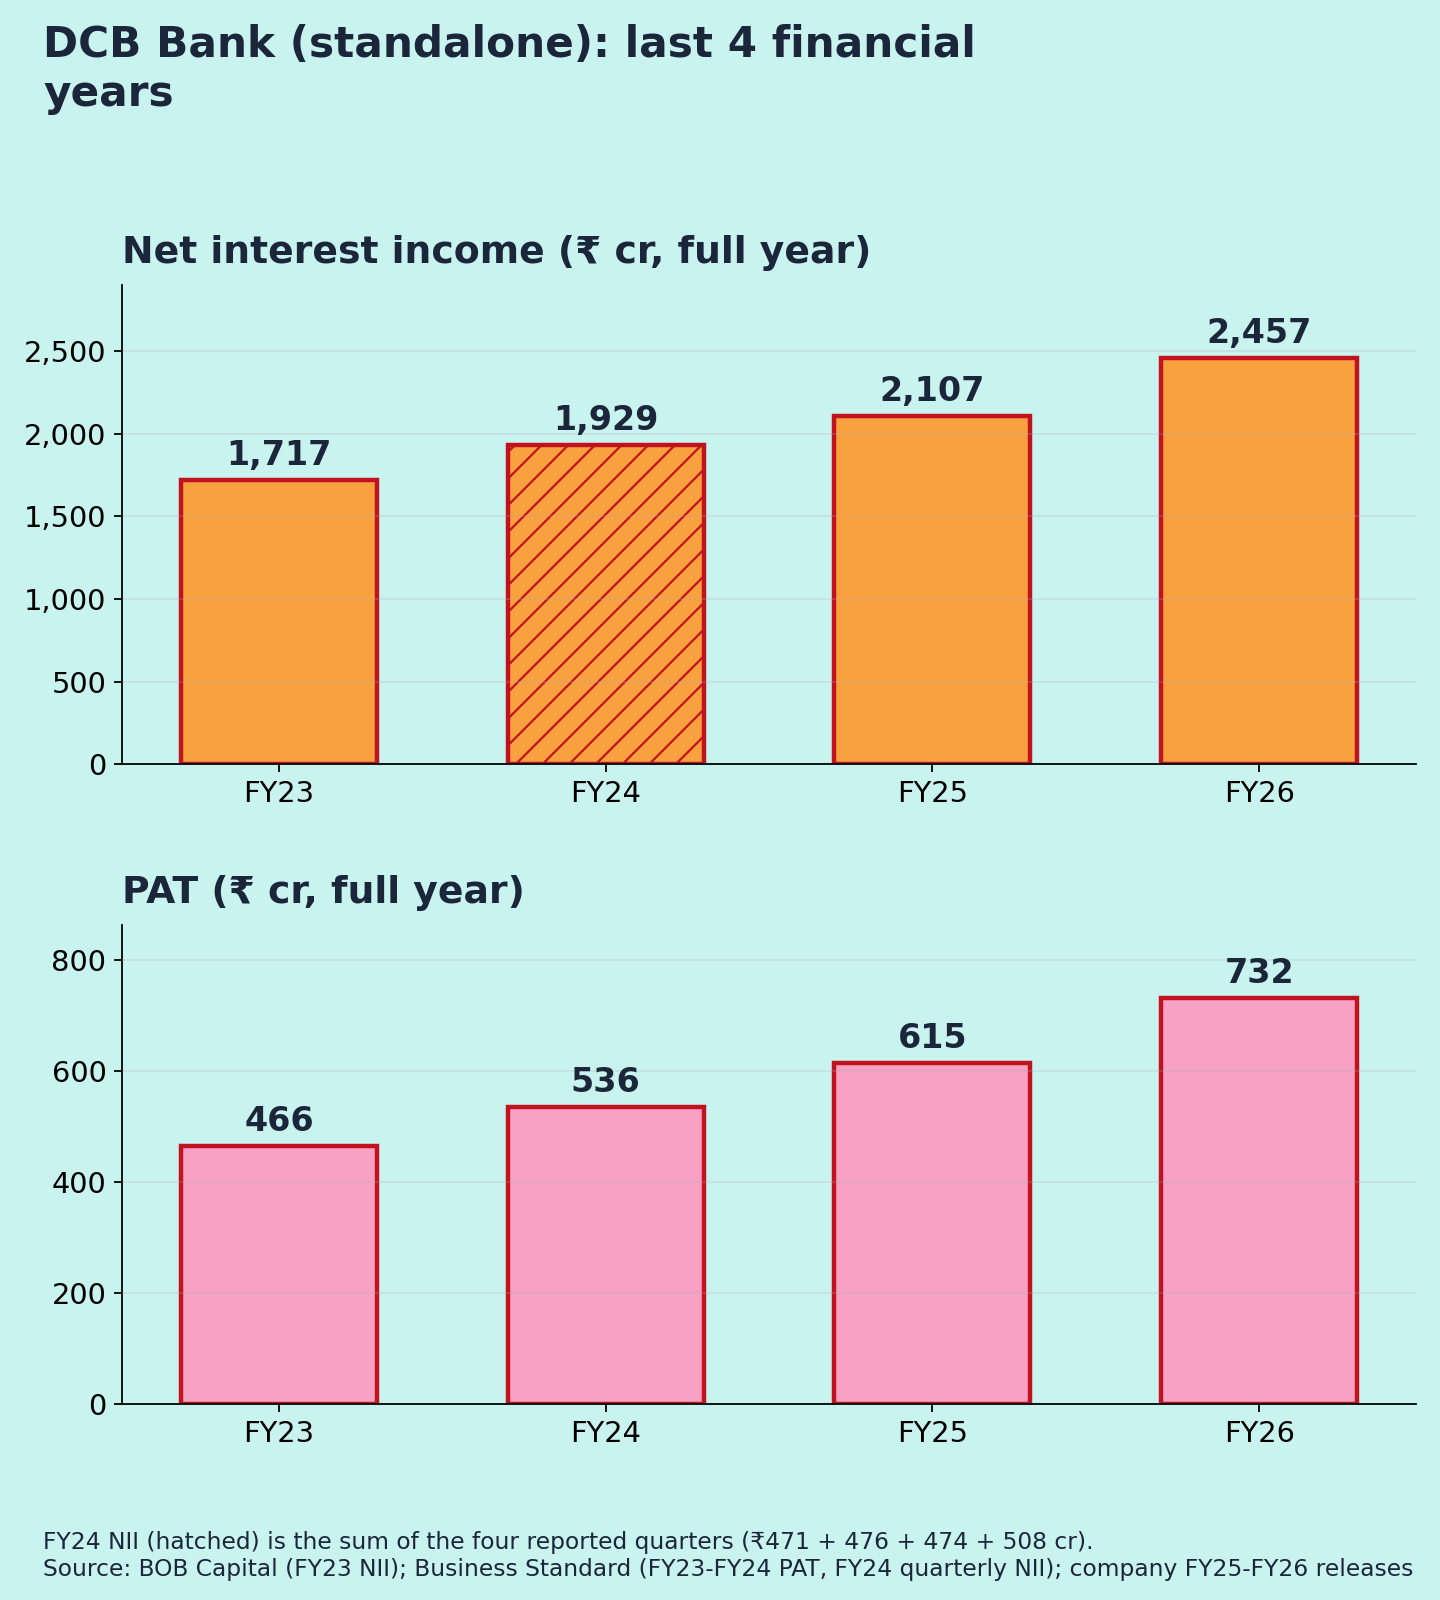
(2) FY23–FY26 NII & PAT. FY24 NII is the sum of the four reported quarters.
(3) NIM and GNPA/NNPA.