Coforge (COFORGE): Q2 FY27 results analysis
(quarter ended 30 Sep 2026)
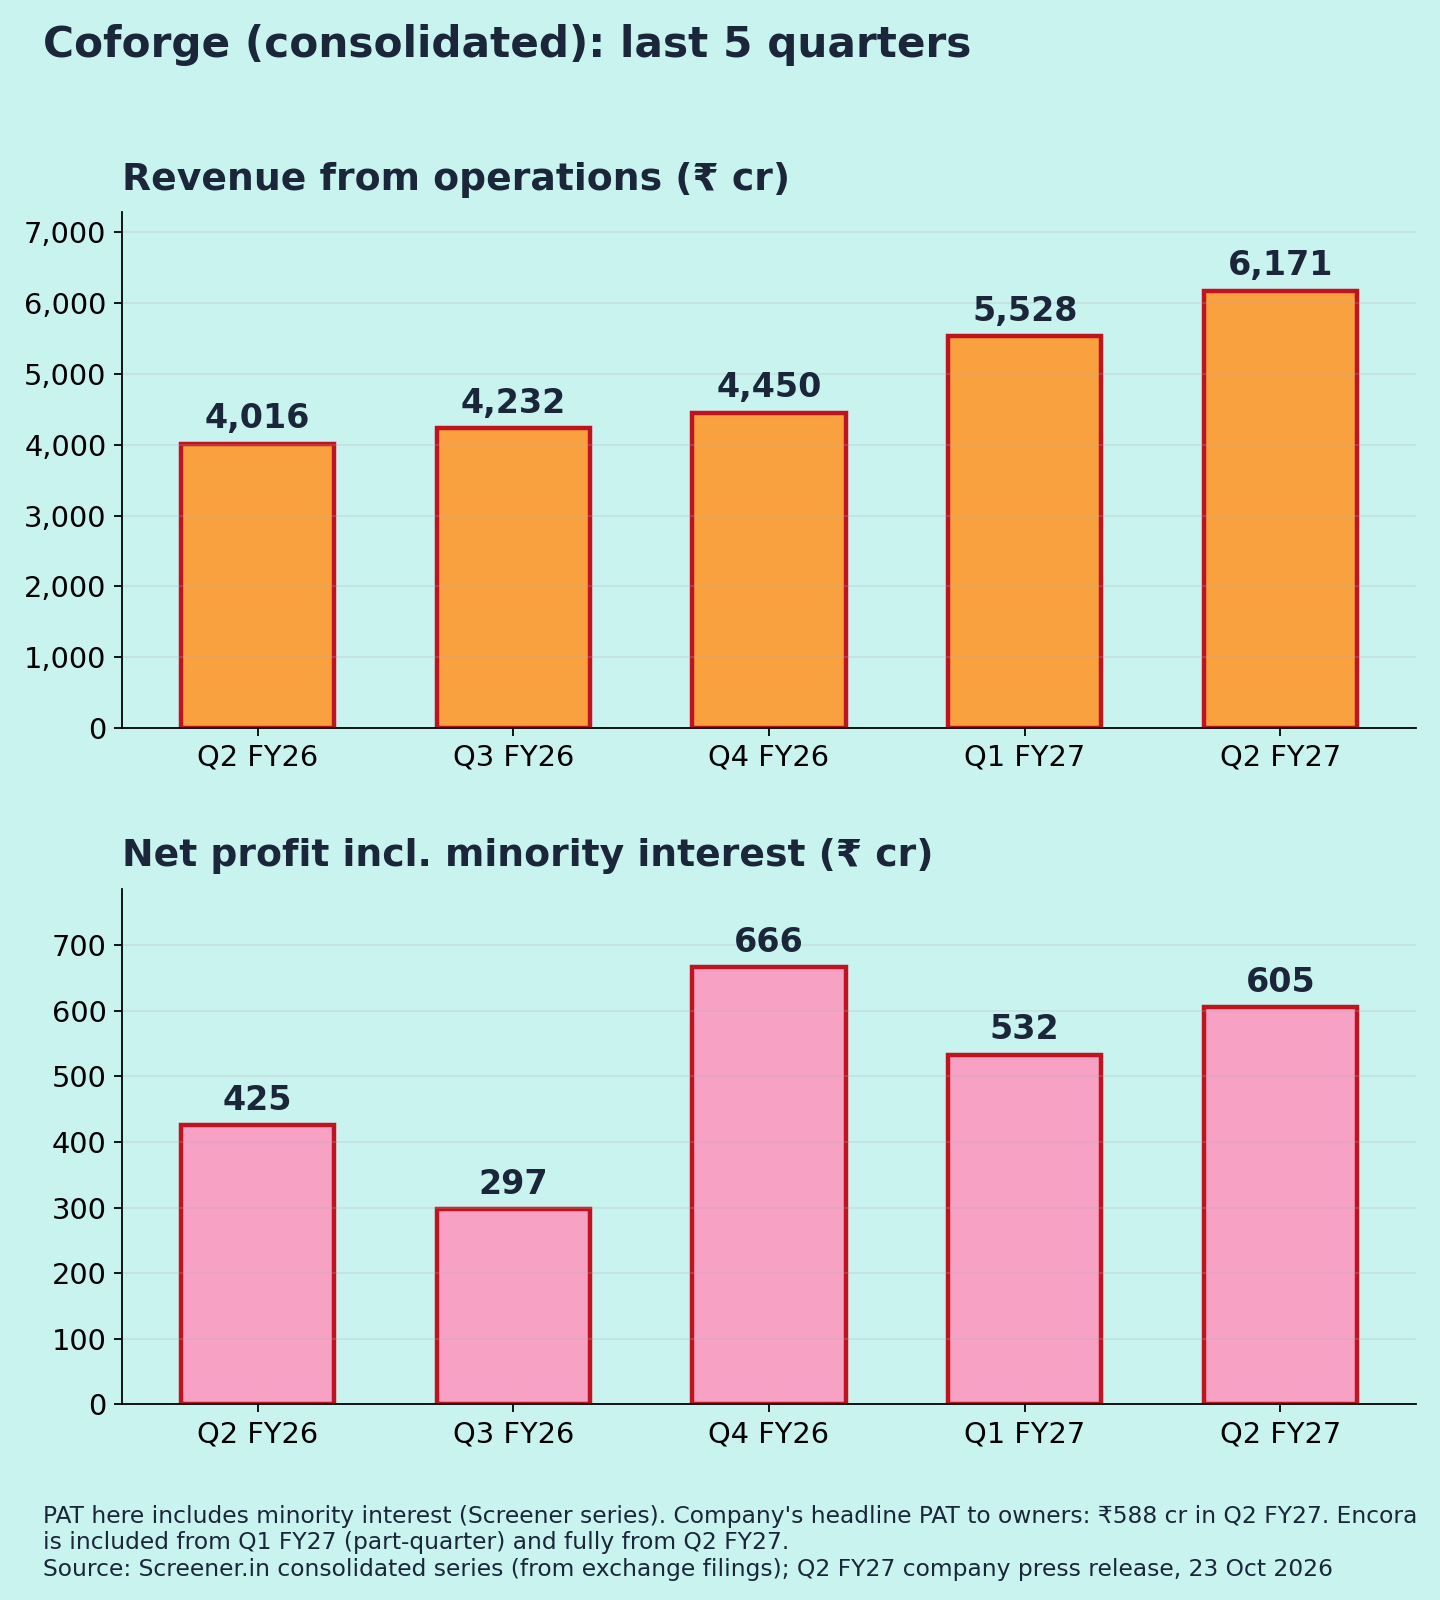
All figures consolidated, ₹ crore unless stated. Results released after market hours on 23 Oct 2026 [1]. YoY/QoQ % and margins are my calculations. Encora was consolidated part-way through Q1 FY27, and Q2 is its first full quarter [2], so YoY growth is not like-for-like.
| Metric | Q2 FY27 | YoY | QoQ |
| Revenue from ops | 6,171 | +53.6% | +11.6% |
| EBITDA (ex-other income) | 1,223 | +61.1% | +15.6% |
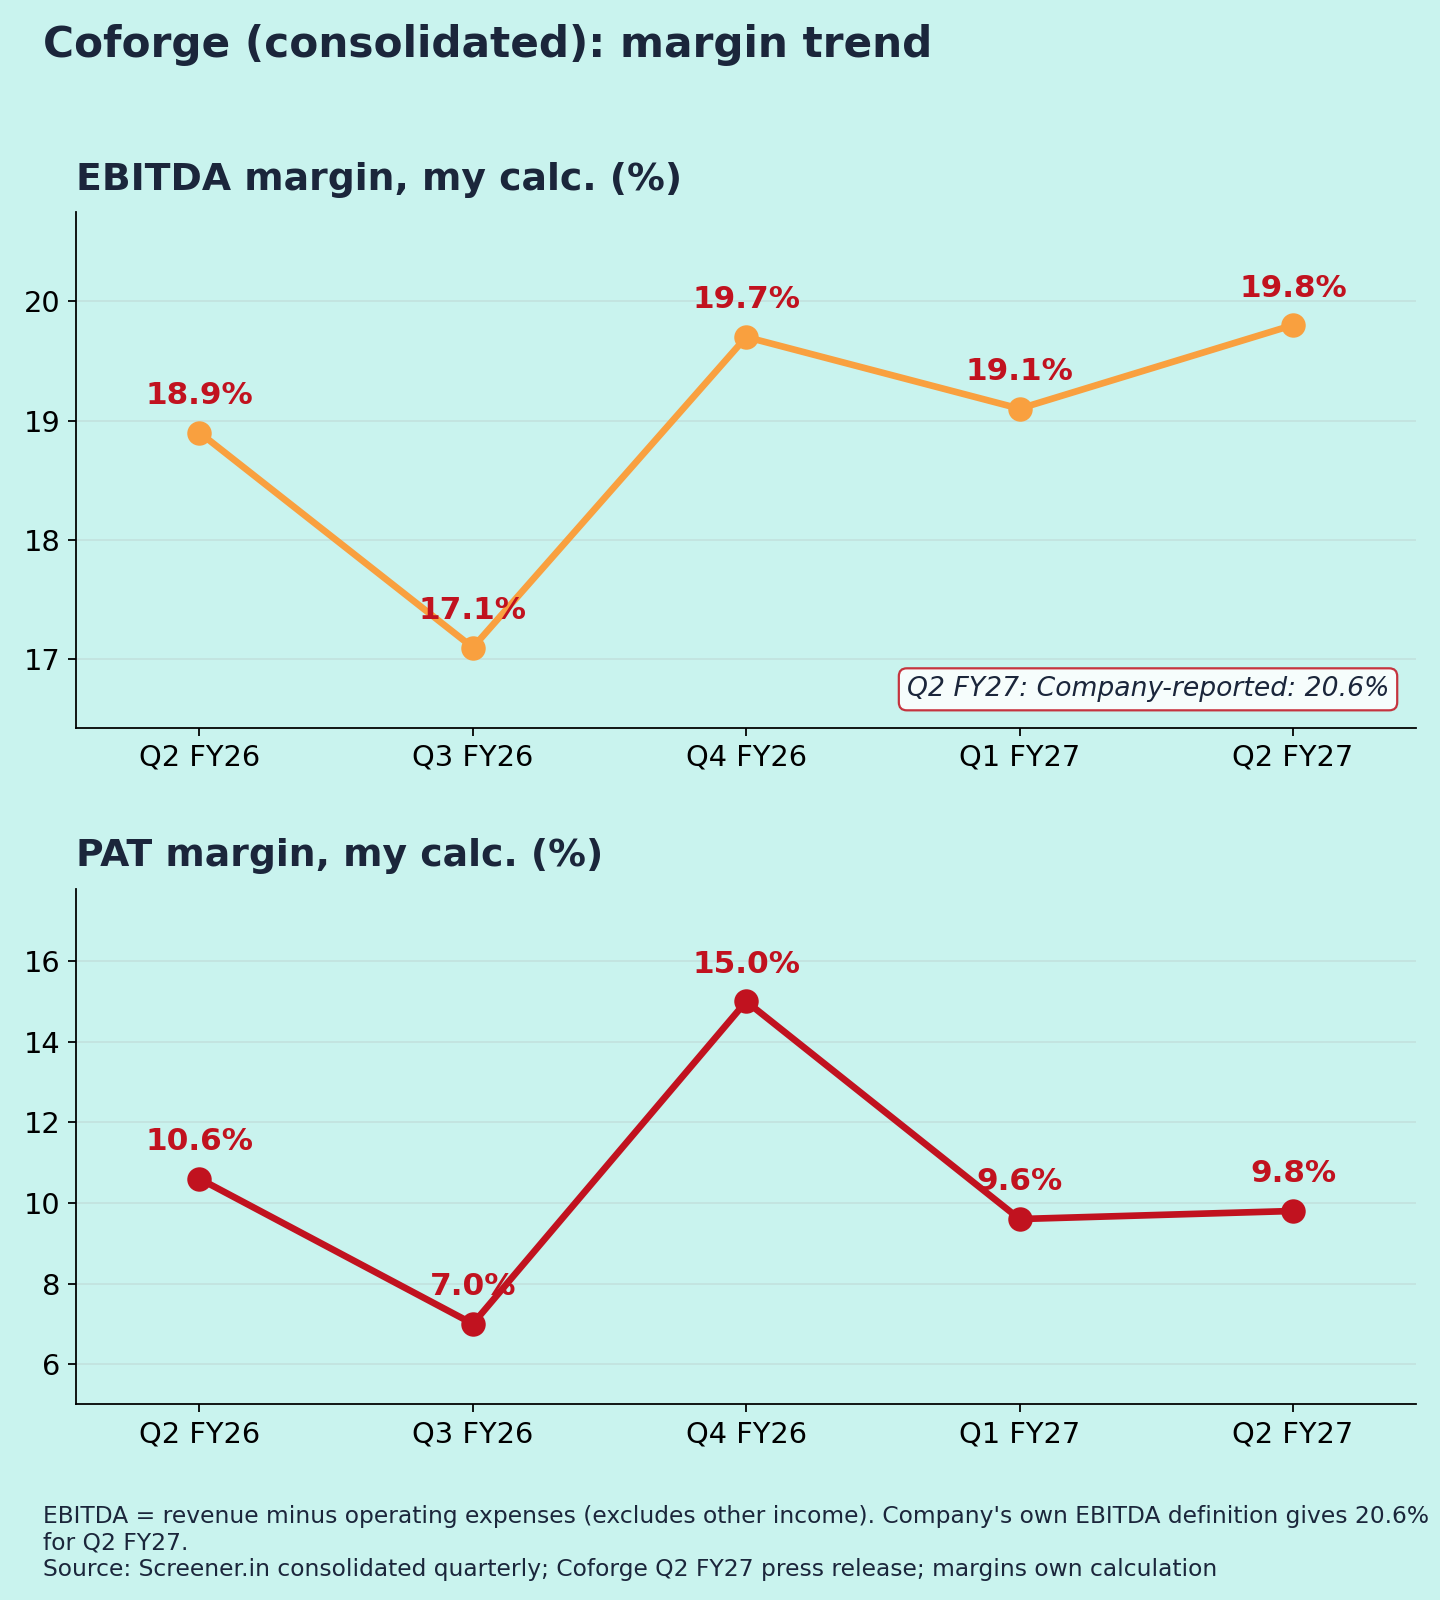
| EBITDA margin | 19.8% | 18.9% | 19.1% |
| PAT to owners (company) | 588 | +56.5% | +13.4% |
| Net profit incl. minority | 605 | +42.4% | +13.7% |
| PAT margin (incl. minority) | 9.8% | 10.6% | 9.6% |
| Other income / PBT | −3.9% | 2.2% | −4.0% |
For margin and ratio rows, the YoY and QoQ columns show the prior-period value. Sources: [1][2][3]
Source note: "₹605 cr, +42%" [4] includes minority interest; the company's ₹588 cr is the owners' share [1]. Both are correct. My charts use the ₹605 cr series because it runs back five quarters.
Quality of earnings
Growth is mostly acquired. Organic constant-currency growth was 3.8% QoQ; Encora supplied the rest of the 10.1% dollar growth [2].
Per-share growth is much weaker. EPS of ₹13.3 rose 18.3% YoY, against PAT +56.5% [2]. Equity capital went from ₹67 cr to ₹89 cr since March [3]. My reading: new shares were issued for Encora.
Acquisition costs sit below EBITDA. Borrowings rose to ₹6,026 cr from ₹728 cr in March. Interest rose to ₹108 cr from ₹41 cr YoY, and D&A to ₹285 cr from ₹172 cr [3].
Other income was negative (−₹31 cr) because of ₹97 cr of hedge losses [2][3]. Exceptional items were about $5.9 mn [2]. The tax rate was a normal ~24% [3].
Base effect: Q2 FY26 was a normal quarter (18.9% margin). The YoY jump comes from the acquisition, not a weak base.
Margins (Chart 3)
EBITDA margin (my calculation, ex-other income): 18.9% → 17.1% → 19.7% → 19.1% → 19.8%. On the company's own definition it is 20.6%, and EBIT margin is 16.0% (+134 bps) [1]. Management credits AI-led efficiencies [2]. Onsite work rose to 49.5% of IT revenue from 47.7% [2], which usually weighs on margins (my view).
Guidance: what changed
- EBIT margin: FY27 raised to 16% from 15.5% [1]. Management targets 17% in Q4 and at least 17% for FY28 [2].
- Deals: Order intake was $1.04 bn. The 12-month executable book is $2.38 bn, +45% YoY [1]. Eight or more large deals are expected in Q3 [2].
- One-offs: Hedge losses are guided to $7.1 mn in Q3 and $1.2 mn in Q4. Exceptional items are expected to be zero from Q3 [2].
- Other: Tax rate 23–24%, FCF at 100% of PAT for the year, and Encora growth to match Coforge's from Q3 [2].
Positives
- Record order intake; order book up 45% [1]
- Margin guidance raised [1]
- Attrition steady at 10.4%; FCF at 89% of PAT [1][2]
Concerns
- About ₹6,000 cr of acquisition debt [3]
- EPS growth diluted by new shares [2]
- Hedge losses and exceptional costs are still flowing [2]
Things to track in Q3 FY27
- Organic constant-currency growth versus the Encora contribution
- EBIT margin path toward the 17% Q4 target
- Hedge losses and exceptional items falling as guided
- Debt repayment and FCF conversion
Not a buy/sell recommendation. Facts are sourced; opinions are labelled.
Sources [1] Equitybulls – Coforge Q2 FY27 press release, 23 Oct 2026 · [2] Investing.com – Q2 FY27 slides · [3] Screener.in – consolidated · [4] ScanX – Q2 FY27 · [5] Coforge newsroom – press release
Charts:
(1) last 5 quarters revenue & net profit;
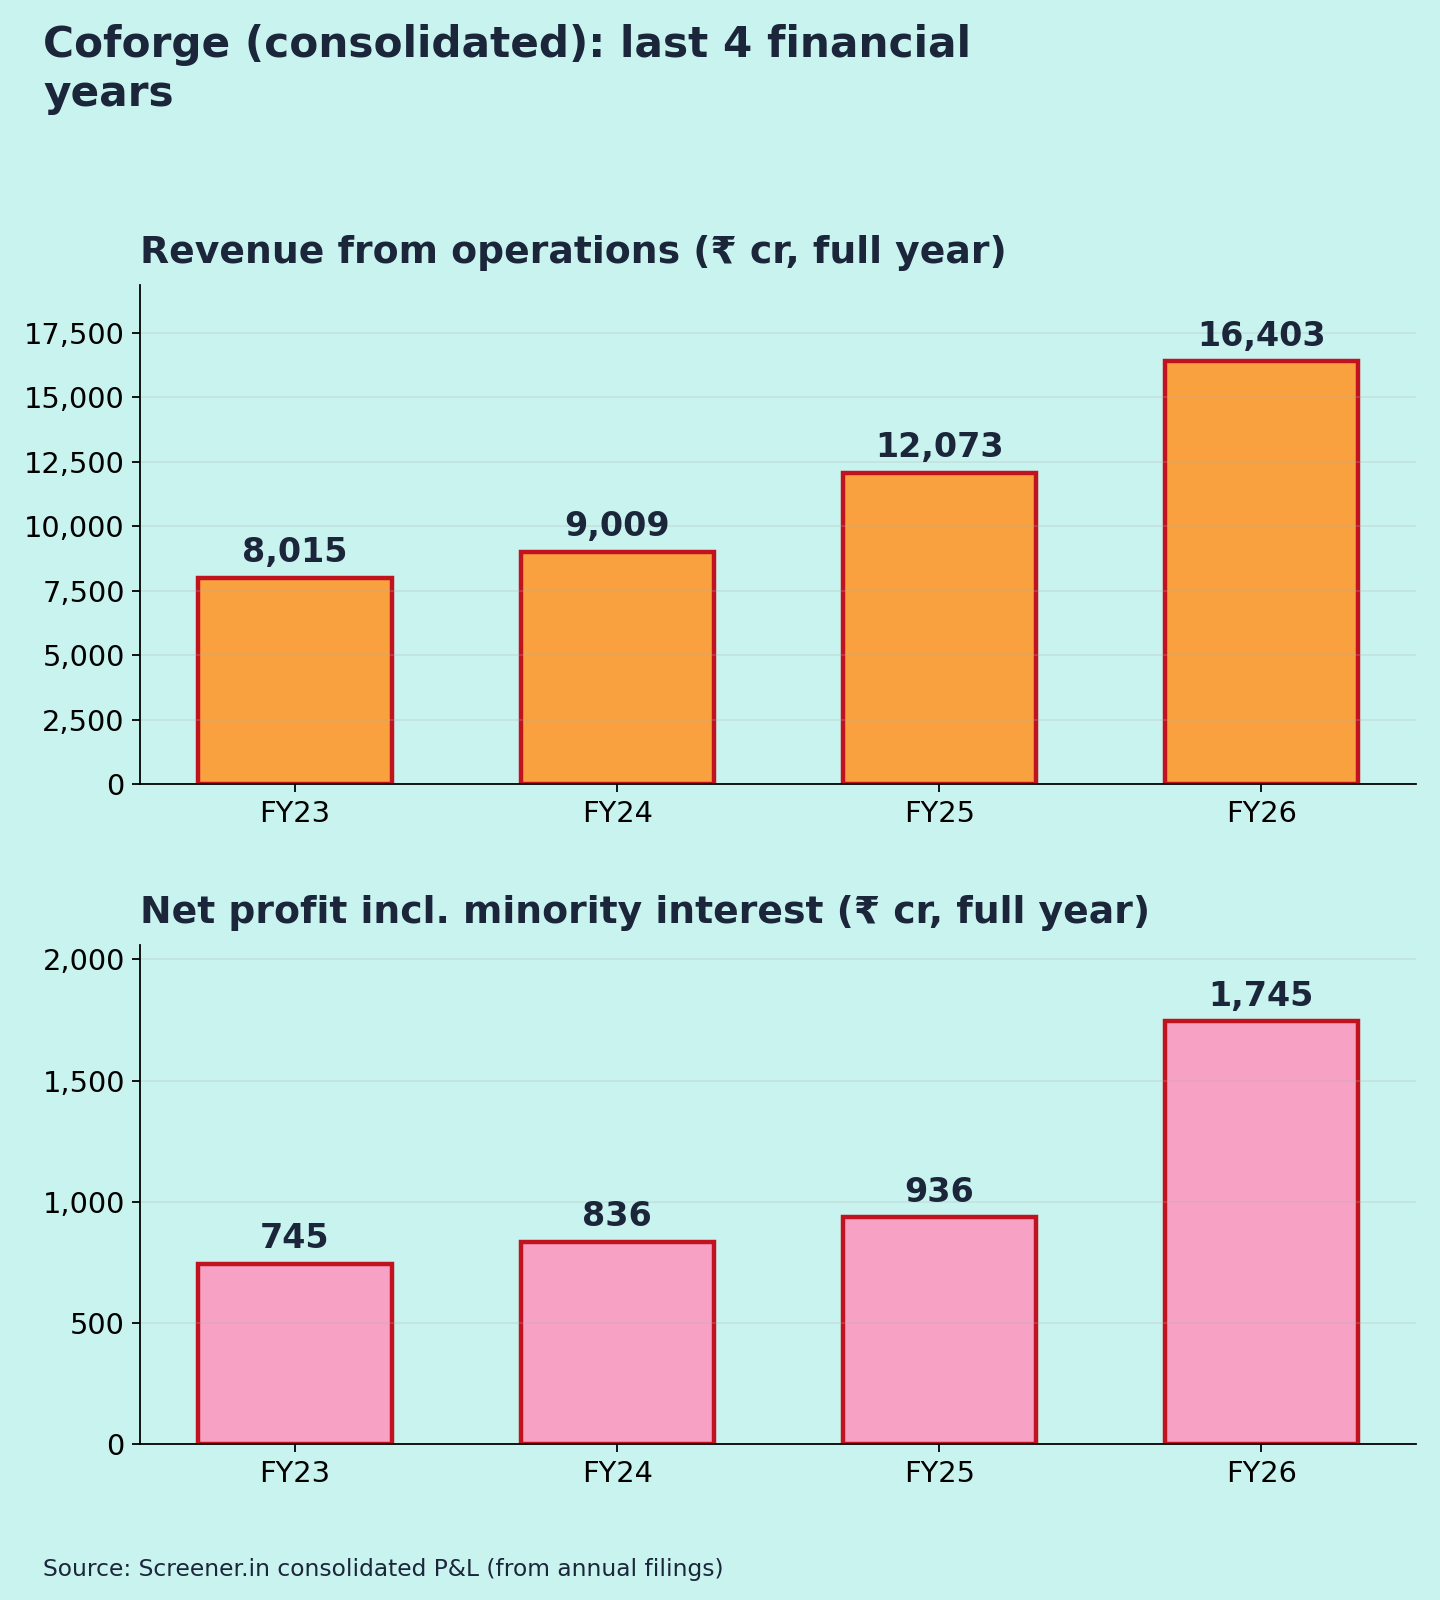
(2) FY23–FY26 revenue & net profit;
(3) EBITDA and PAT margin (own calc.).