Bandhan Bank (BANDHANBNK): Q2 FY27 results analysis
(Quarter ended 30 Sep 2026)
All figures standalone (the basis the bank reports on), ₹ crore unless stated. Results approved on 28 Oct 2026. YoY/QoQ % are my calculations from reported numbers.
| Metric | Q2 FY27 | YoY | QoQ |
| Gross advances | ~1,58,000 | +13.1% | +1.8% |
| Deposits | ~1,73,000 | +9.2% | +4.7% |
| NII | 2,960 | +14.3% | +1.3% |
| NIM | 6.1% | 5.8% | 6.2% |
| Other income | 705 | +29% | +17% |
| Operating profit | 1,556 | +18.8% | +14.6% |
| Provisions | 718 | −37.7% | +5.2% |
| Credit cost | 1.8% | 3.4% | 1.8% |
| PAT | 622 | 5.5x | +23.9% |
| GNPA / NNPA | 3.11% / 0.92% | 5.0% / 1.37% | 3.15% / 0.93% |
| PCR (excl. / incl. write-offs) | 71.2% / 86.7% | 73.7% / – | – / 85.9% |
| CASA | 26.7% | – | 29.4% |
| Net CD ratio | 89.5% | – | ~92% |
| CRAR | 18.3% | – | 18.2% |
| RoA / RoE | 1.2% / 9.3% | 0.2% / 1.8% | 1.0% / 7.7% |
For ratio rows, the YoY and QoQ columns show the prior-period value. Other income = net total income minus NII.
Quality of earnings
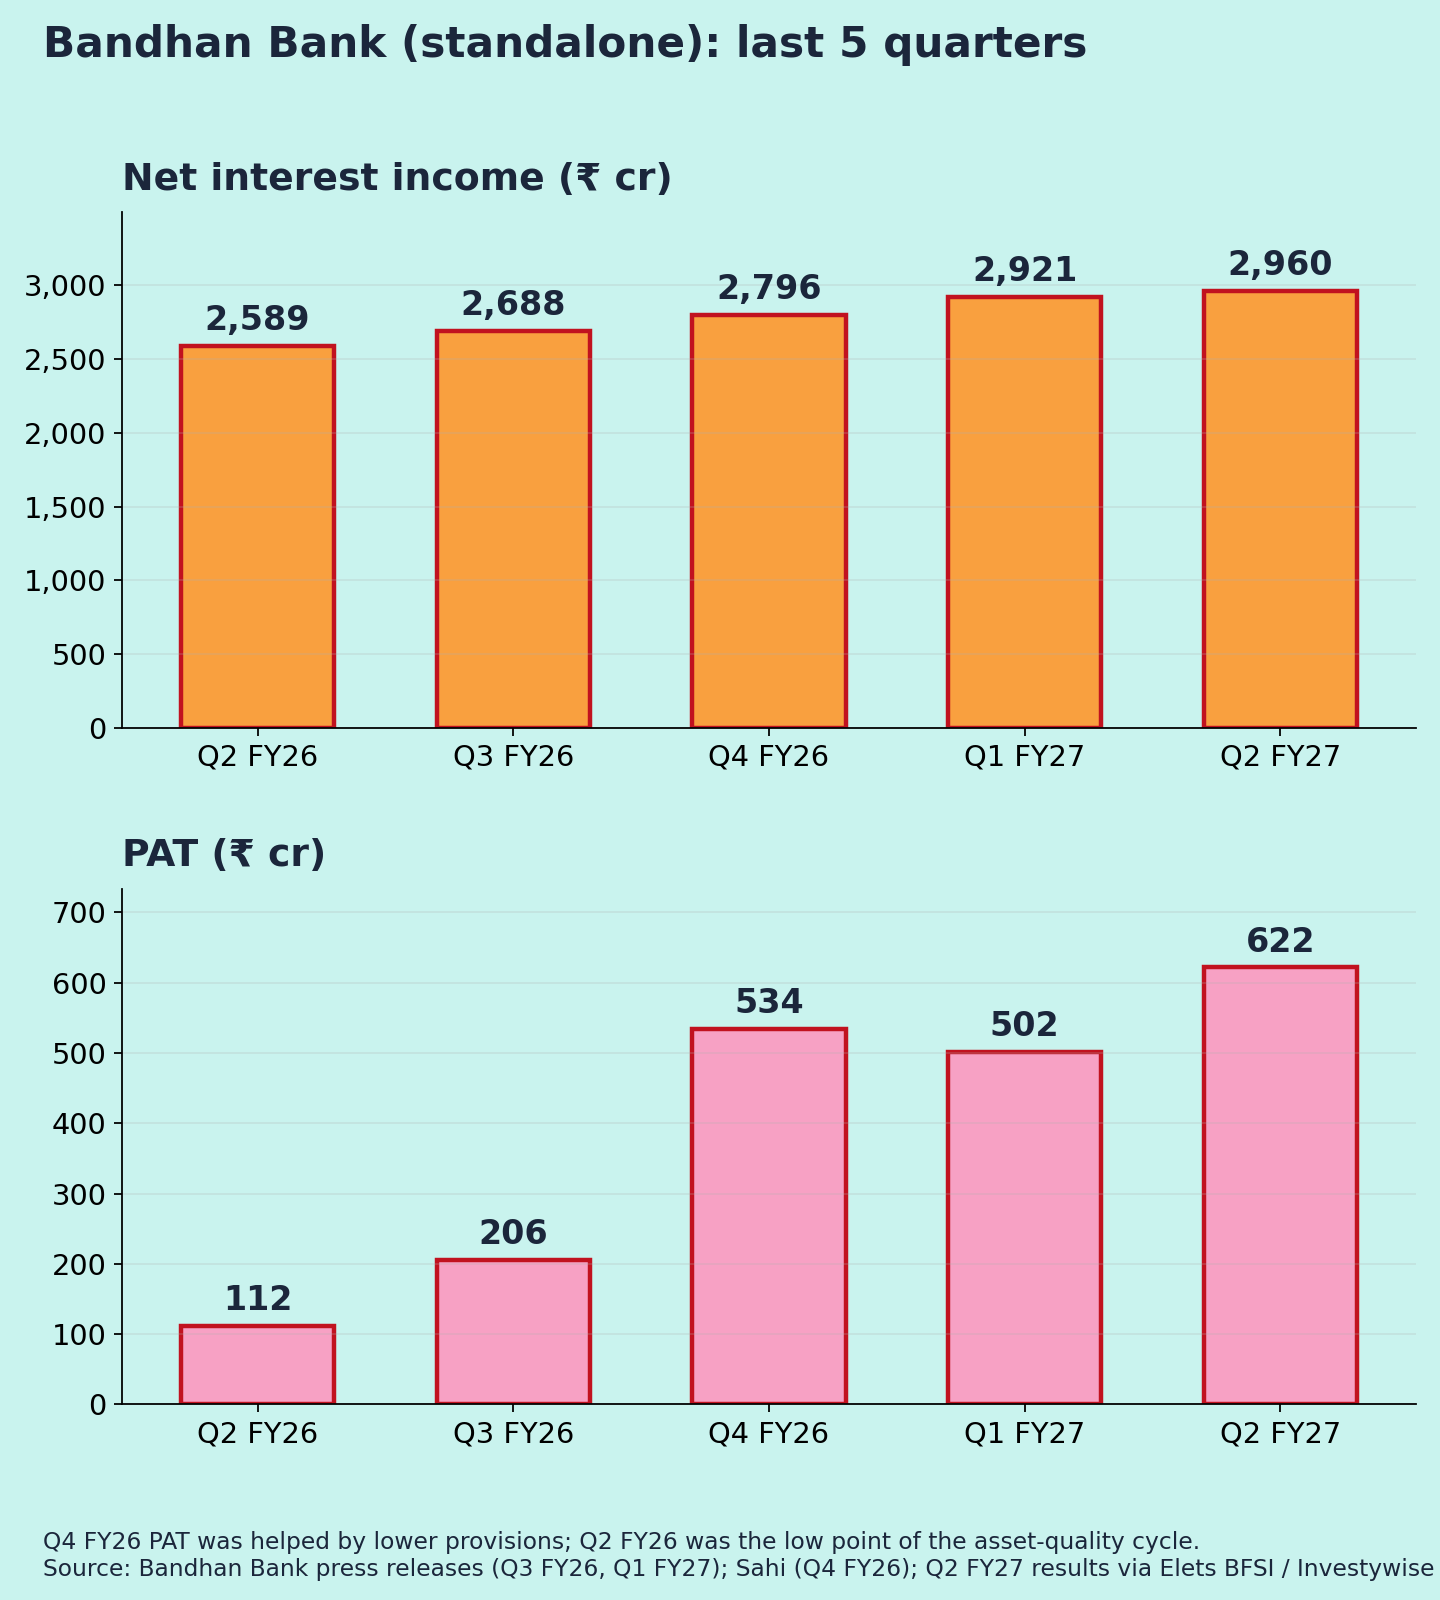
The 5.5x jump is mostly a weak-base effect. Q2 FY26 PAT was just ₹112 cr, when provisions were ₹1,153 cr and credit cost was 3.4% [1]. Provisions this quarter were ₹718 cr [1].
The core did improve. NII rose 14% and operating profit 19% [1]. QoQ, though, NII grew only 1.3% and NIM slipped 10 bps to 6.1% [2].
Two smaller flags:
- Other income: treasury income rose about 39% QoQ, alongside higher processing fees [2]. Part of the fee jump is volatile (my view).
- Coverage: PCR excluding technical write-offs is 71.2% [2], versus 73.7% a year ago [7]. Write-offs of ~₹607 cr helped the headline NPA ratios [2].
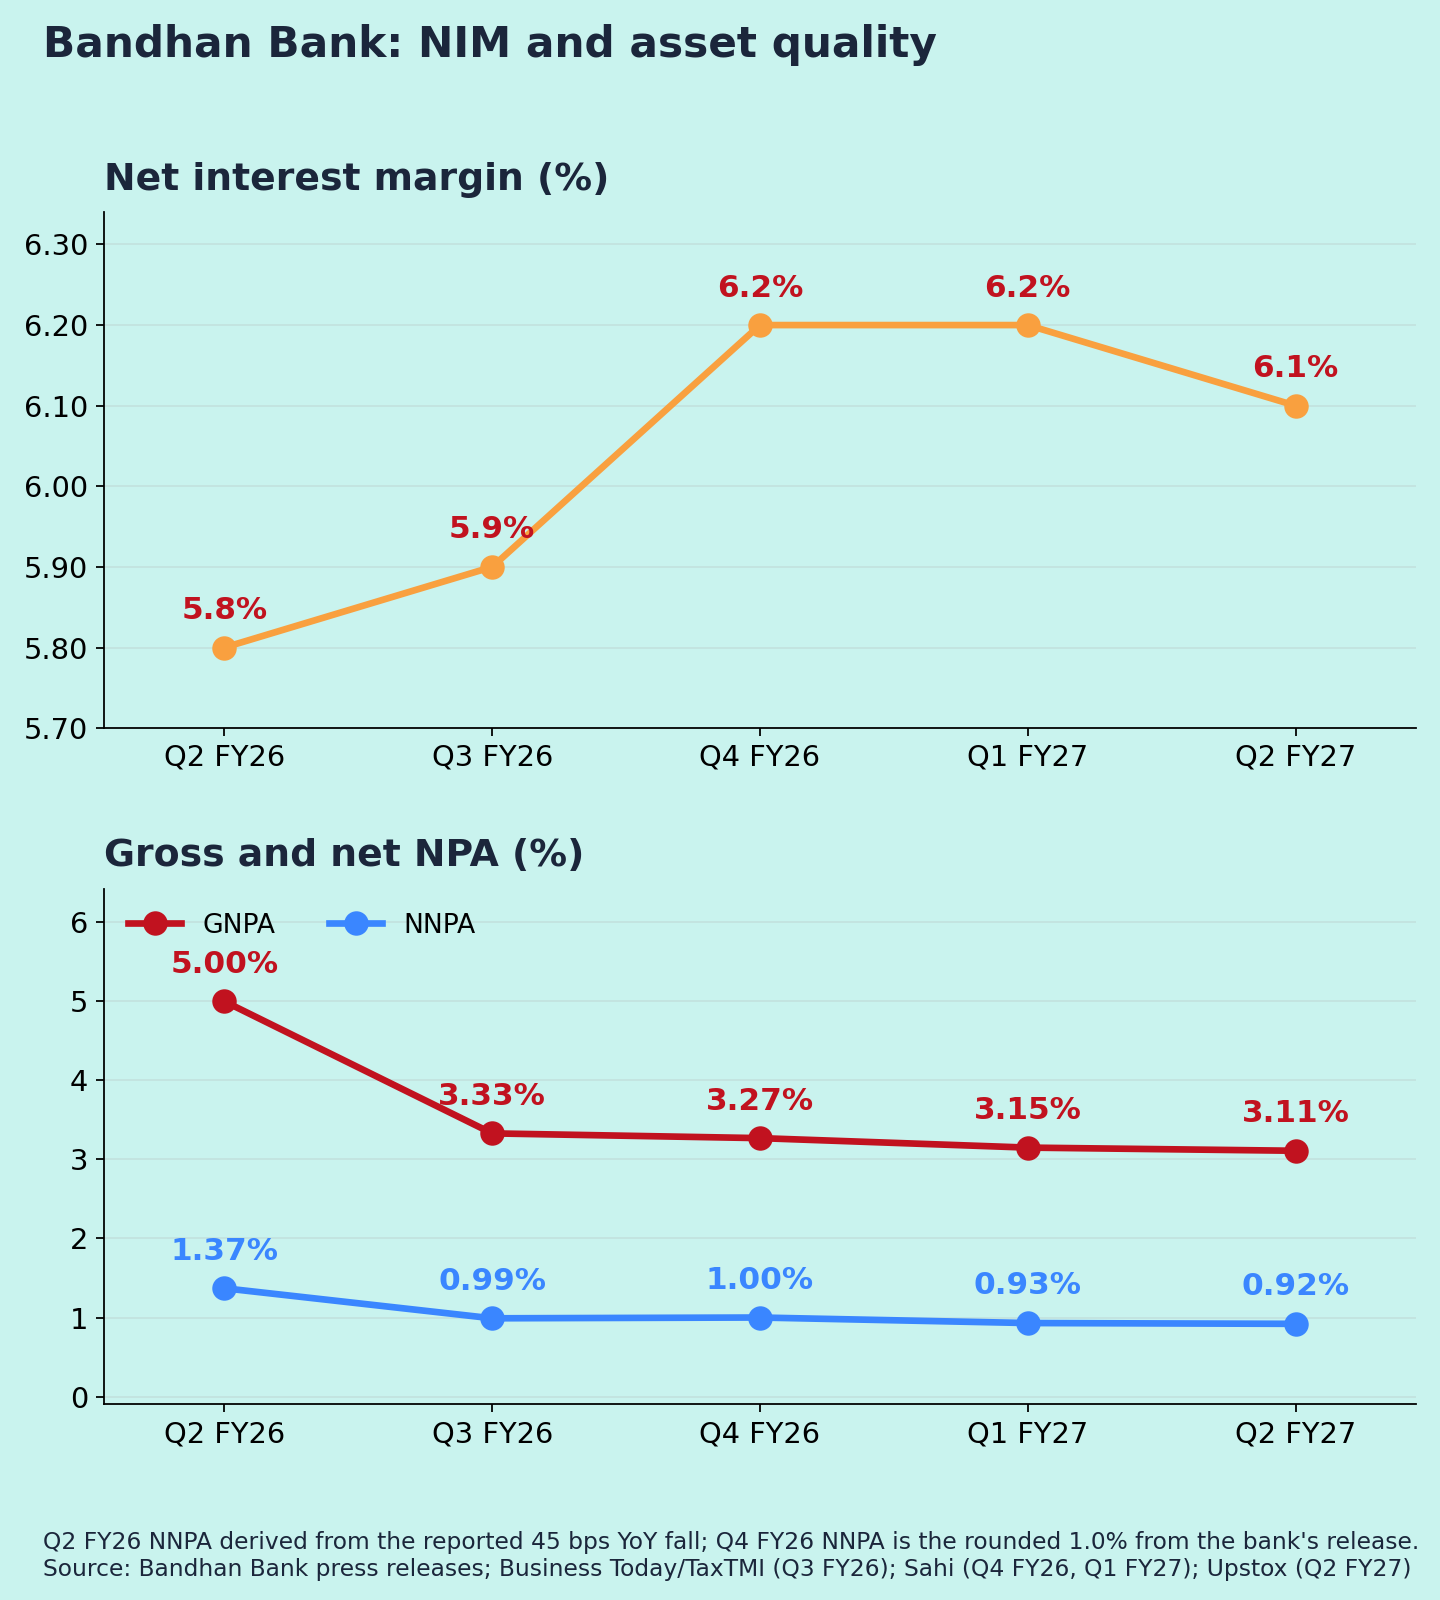
NIM and asset quality (Chart 3)
NIM over five quarters: 5.8% → 5.9% → 6.2% → 6.2% → 6.1% [1][5][6]. GNPA fell from 5.0% to 3.11%, but almost all of that fall came in Q3 FY26. Since then the ratio has been nearly flat [5][6].
Gross slippages were ₹1,125 cr, slightly above Q1's ₹1,079 cr [2]. Collection efficiency improved to 99.4% [2].
Guidance: what changed
- Unchanged: NIM of 6.1–6.2% for FY27, ~14% loan growth, and opex-to-assets of 4.2% [3].
- RoA: the Q4 FY27 target of 1.2–1.4% stays. The lower end was already reached in Q2 [2].
- Microfinance (EEB): the book was flat (+1.7% YoY). Management targets 8–10% growth in H2 [2].
- New: an expected credit loss (ECL) transition impact of about ₹2,200 cr. It goes against capital, not P&L, over five years. On a flow basis it adds 15–20 bps a quarter to credit cost [2].
- Pressure points: CASA fell to 26.7% from above 29% in Q1, after savings-rate cuts [2][6]. Proposed caps on bancassurance commissions are a fee headwind [2].
- New product: credit cards launched in the quarter [1].
Positives
- Credit cost halved YoY; RoA back to 1.2% [1][2]
- Secured loans are now over 57% of the book [1]
- Strong capital (CRAR 18.3%) [1]
Concerns
- CASA falling; deposit growth (9%) lags loan growth (13%) [1][2]
- ECL transition and its higher ongoing credit cost [2]
- Microfinance growth still stalled [2]
Things to track in Q3 FY27
- NIM within 6.1–6.2% as deposit costs rise
- CASA ratio recovery
- Microfinance growth toward 8–10%, and slippage trends
- Credit cost including the ECL flow impact
Not a buy/sell recommendation. Facts are sourced; opinions are labelled.
Sources [1] Elets BFSI, 28 Oct 2026 · [2] GuruFocus via Yahoo – Q2 FY27 call highlights · [3] Investing.com – call transcript · [4] Investing.com – Q2 FY27 slides · [5] Bandhan Bank – Q3 FY26 press release · [6] Bandhan Bank – Q1 FY27 press release · [7] Business Standard – Q2 FY26 · [8] Zee Business – brokerage views · [9] Upstox – Q2 FY27 · [10] Sahi – Q1 FY27 (Q4 FY26 figures) · [11] Bandhan Bank – FY24 press release · [12] Goodreturns – 9M FY26
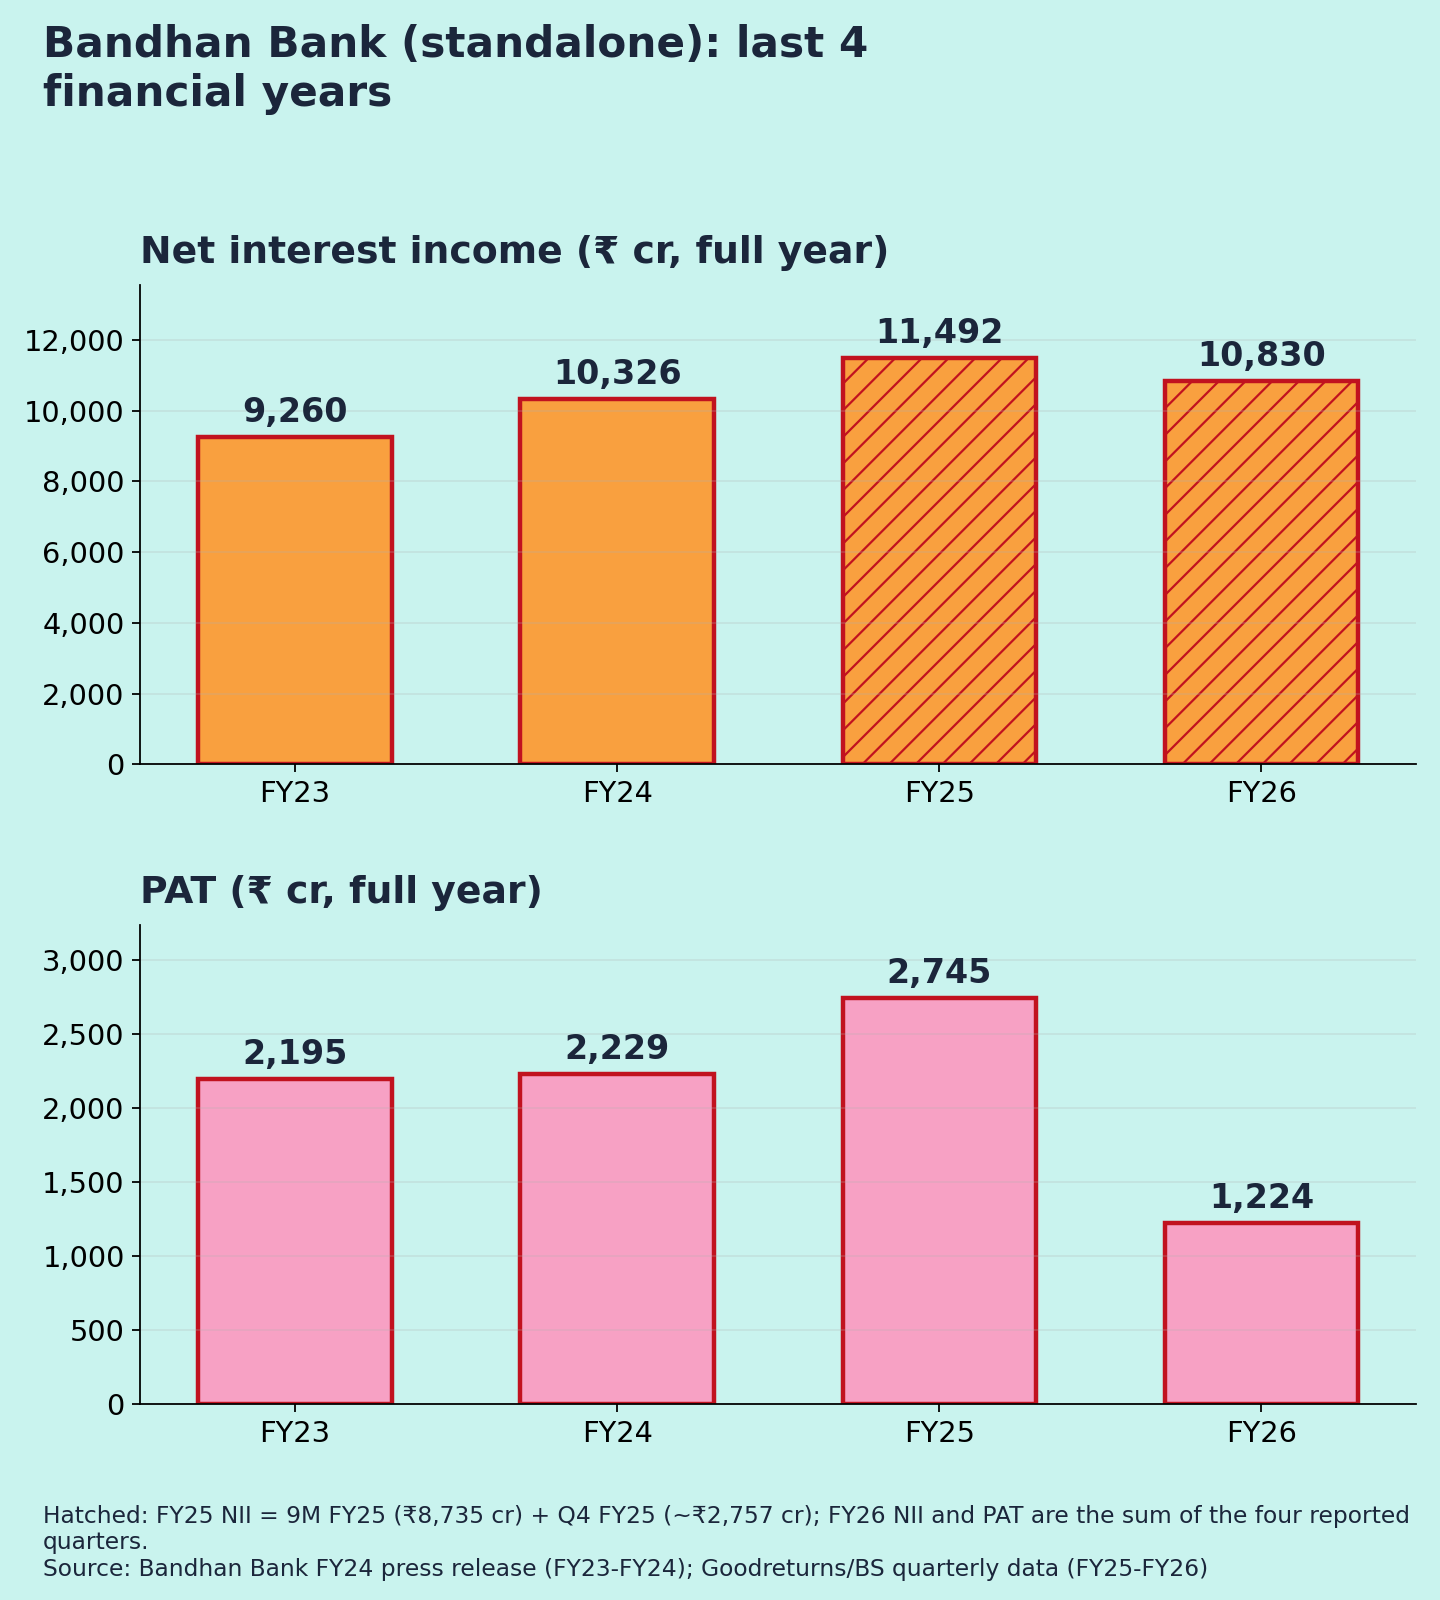
Charts: (1) last 5 quarters NII & PAT; (2) FY23–FY26 NII & PAT (FY25 NII and FY26 totals derived); (3) NIM and GNPA/NNPA.