Atul (ATUL): Q2 FY27 results analysis
(quarter ended 30 Sep 2026)
All figures consolidated, ₹ crore unless stated. Results released during market hours on 23 Oct 2026. YoY/QoQ %, margins and ratios are my calculations from reported numbers.
| Metric | Q2 FY27 | YoY | QoQ |
| Revenue from ops | 1,877.0 | +21.0% | +1.6% |
| EBITDA | 246.5 | −7.9% | −37.4% |
| EBITDA margin | 13.1% | 17.2% | 21.3% |
| PBT | 214.4 | −7.3% | −38.2% |
| PAT | 158.7 | −13.0% | −37.5% |
| PAT margin | 8.5% | 11.8% | 13.7% |
| Other income / PBT | 22.6% | 21.0% | 9.6% |
For margin and ratio rows, the YoY and QoQ columns show the prior-period value. Sources: [1][2][5][6]
Source note: Sahi reports PAT as ₹160 cr [4]. That figure appears to be the owners' share; ₹158.7 cr is total consolidated PAT [1].
Quality of earnings
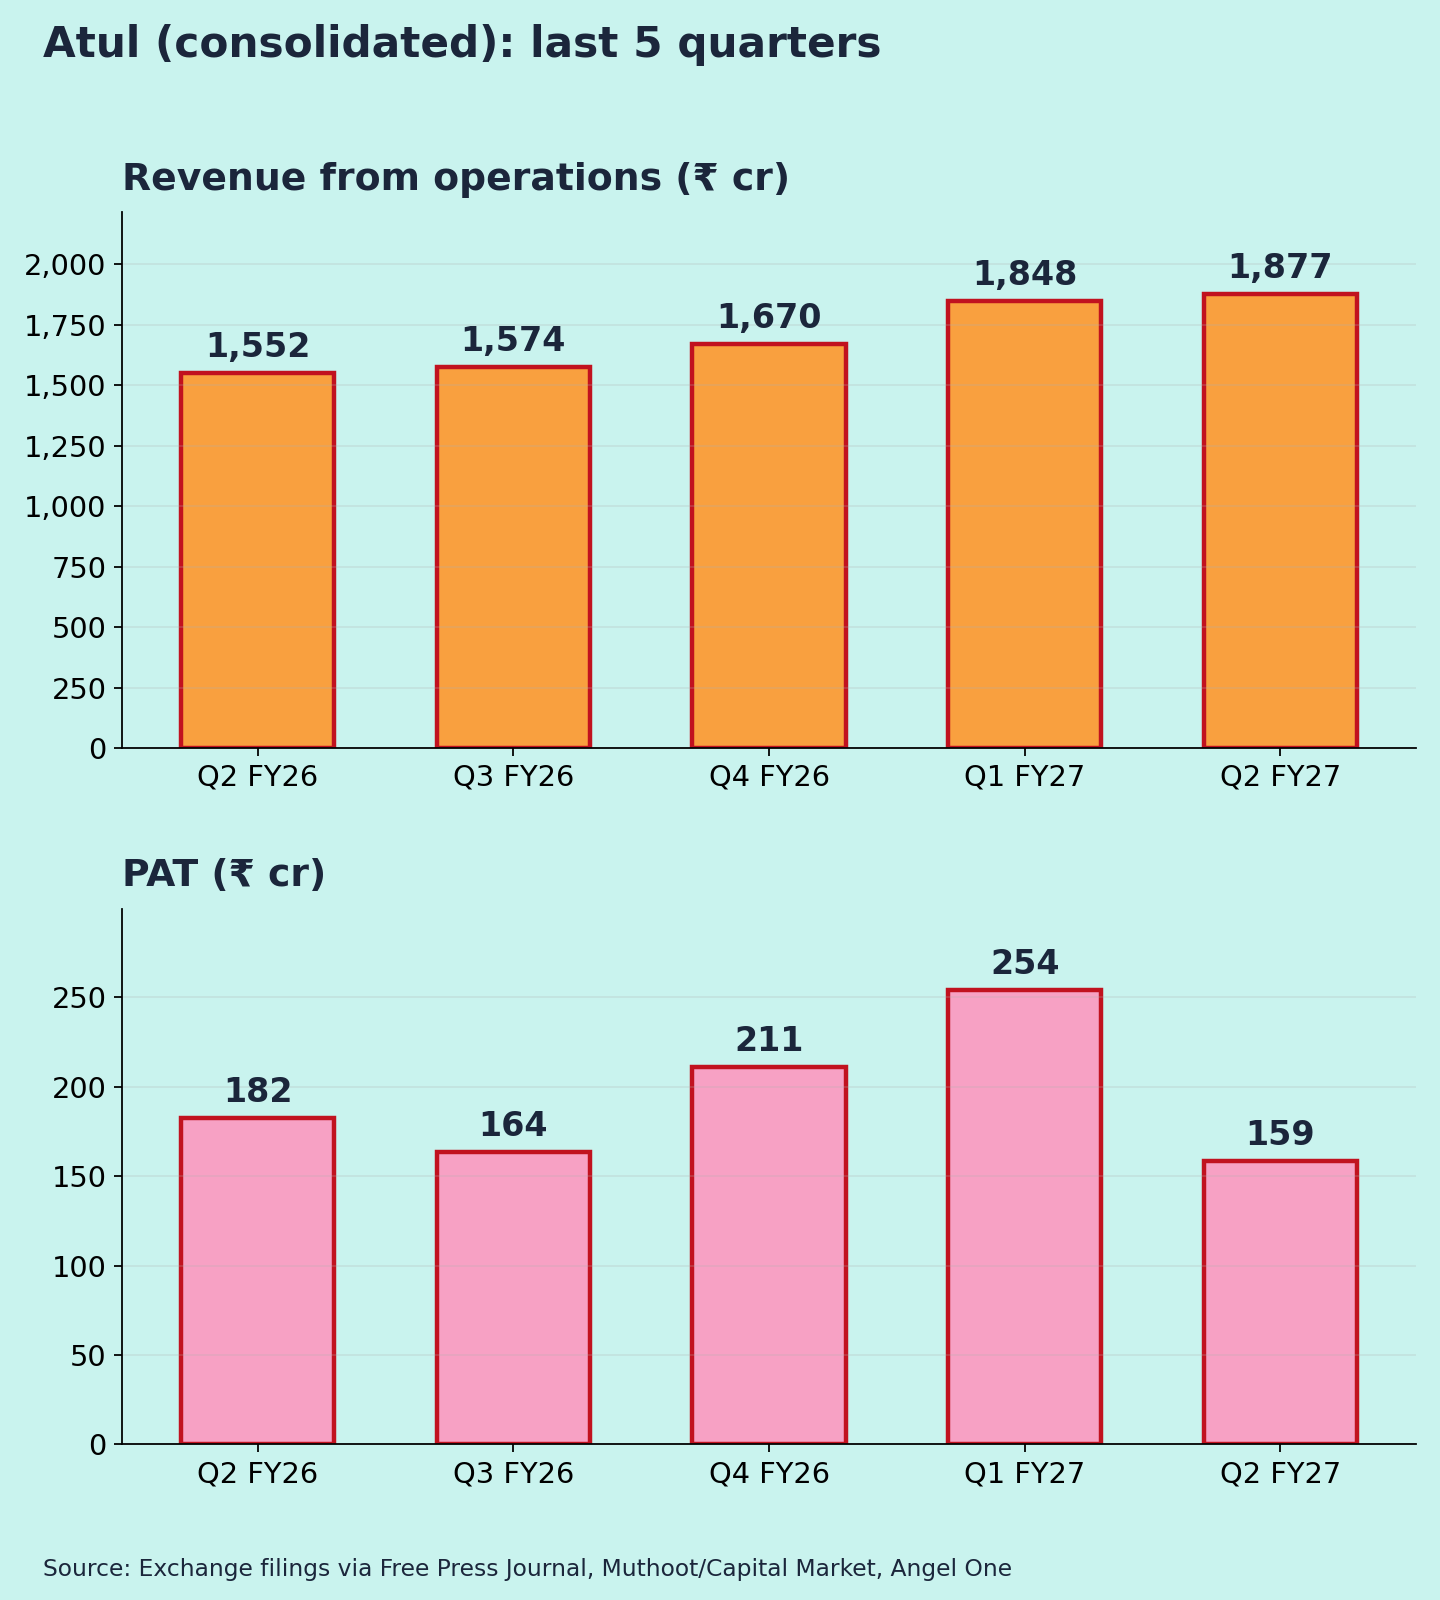
Revenue growth was strong, but costs grew faster. Total expenses rose 25%, against revenue +21% [1]. The result also missed the consensus PAT estimate of ₹210 cr [4].
- Segments: Performance & Other Chemicals revenue rose 31% to ₹1,503.9 cr. Life Science Chemicals slipped 3% to ₹427.3 cr [1]. Segment profits weren't in the coverage I found.
- Other income: ₹48 cr, now ~23% of PBT, vs ~10% in Q1 (my calculation from [1][5]). Core profit fell more than the PBT line shows.
- Tax: the rate rose to ~26% from ~21% a year ago (my calculation from [1]). That is why PAT (−13%) fell more than PBT (−7%).
Base effect: Q2 FY26 was a normal quarter (17.2% margin) [6], so the YoY fall is not a high-base effect. The QoQ drop stands out more, because Q1 FY27 was a record. In Q1, analysts noted cost discipline and forex tailwinds, while materials rose faster than revenue [17]. My reading: Q1's 21% margin was partly helped by those tailwinds and didn't repeat.
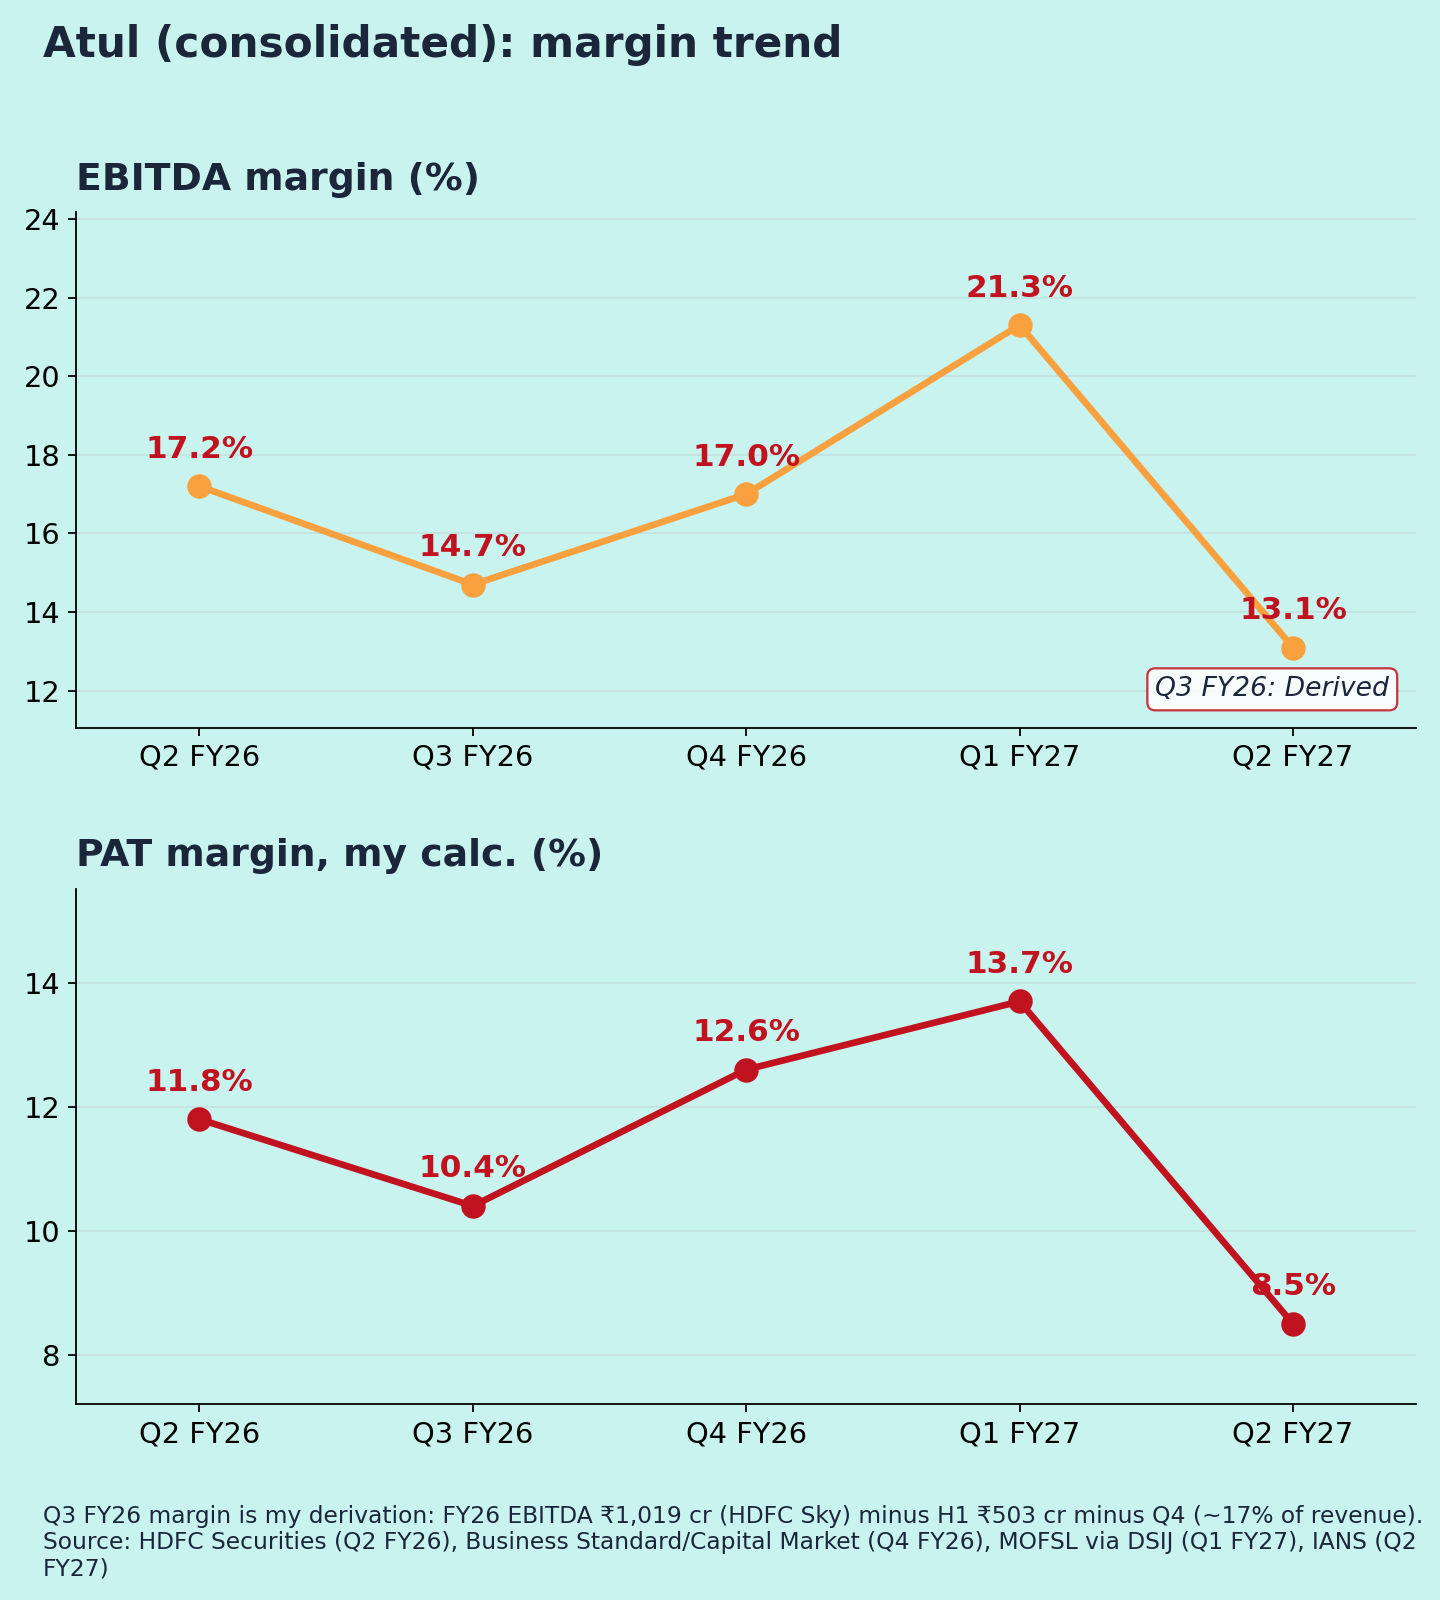
Margins (Chart 3)
EBITDA margin over five quarters: 17.2% → ~14.7% → ~17.0% → 21.3% → 13.1%. The Q3 FY26 figure is my derivation from full-year and H1 numbers [5][6]. Q2 FY27 is the lowest in the series. The coverage I found doesn't explain the drop (pricing, raw materials or mix).
Management commentary
- Guidance: Atul does not give numeric guidance in the coverage I found. No Q2 call transcript was available at the time of writing.
- Buyback: up to ₹90 cr via the open market, at a maximum ₹7,500 per share (about 1.2 lakh shares, 0.41% of equity) [1].
- Capex: a ₹167 cr capex plan was approved with the Q1 results [16].
Positives
- Revenue +21%, led by Performance & Other Chemicals [1]
- Buyback signals confidence (my view) [1]
- Low debt: Q4 FY26 finance cost was just ₹4.3 cr [7]
Concerns
- EBITDA margin at a five-quarter low [5][6]
- Life Science Chemicals revenue declining [1]
- Rising share of other income in PBT, and a higher tax rate [1]
- No management explanation yet (my view)
Things to track in Q3 FY27
- EBITDA margin: back toward the 16–17% FY26 average? [5]
- Life Science Chemicals growth
- Raw-material and forex commentary on the call or in the presentation
- Buyback execution
Not a buy/sell recommendation. Facts are sourced; opinions are labelled.
Sources [1] Free Press Journal, 23 Oct 2026 · [2] IANS via SocialNews · [3] IANS via Punjab Kesari – share price · [4] Sahi – vs estimates · [5] HDFC Sky – Q1 FY27 update · [6] HDFC Securities – Q2 FY26 note · [7] Arihant/Capital Market – Q4 FY26 · [8] Stockanalysis – Q4 FY26 margin · [9] Muthoot/Capital Market – Q3 FY26 · [10] Angel One – Q4 FY26 · [11] Indian Chemical News – Q1 FY27 · [12] DSIJ – MOFSL Q1 FY27 note · [13] Bajaj Broking – FY25 · [14] Equitymaster – FY24 annual report · [15] Fyers – quarterly revenue · [16] Sahi – Q1 FY27 capex · [17] CompoundingAI – Q1 FY27 analysis
Charts:
(1) last 5 quarters revenue & PAT;
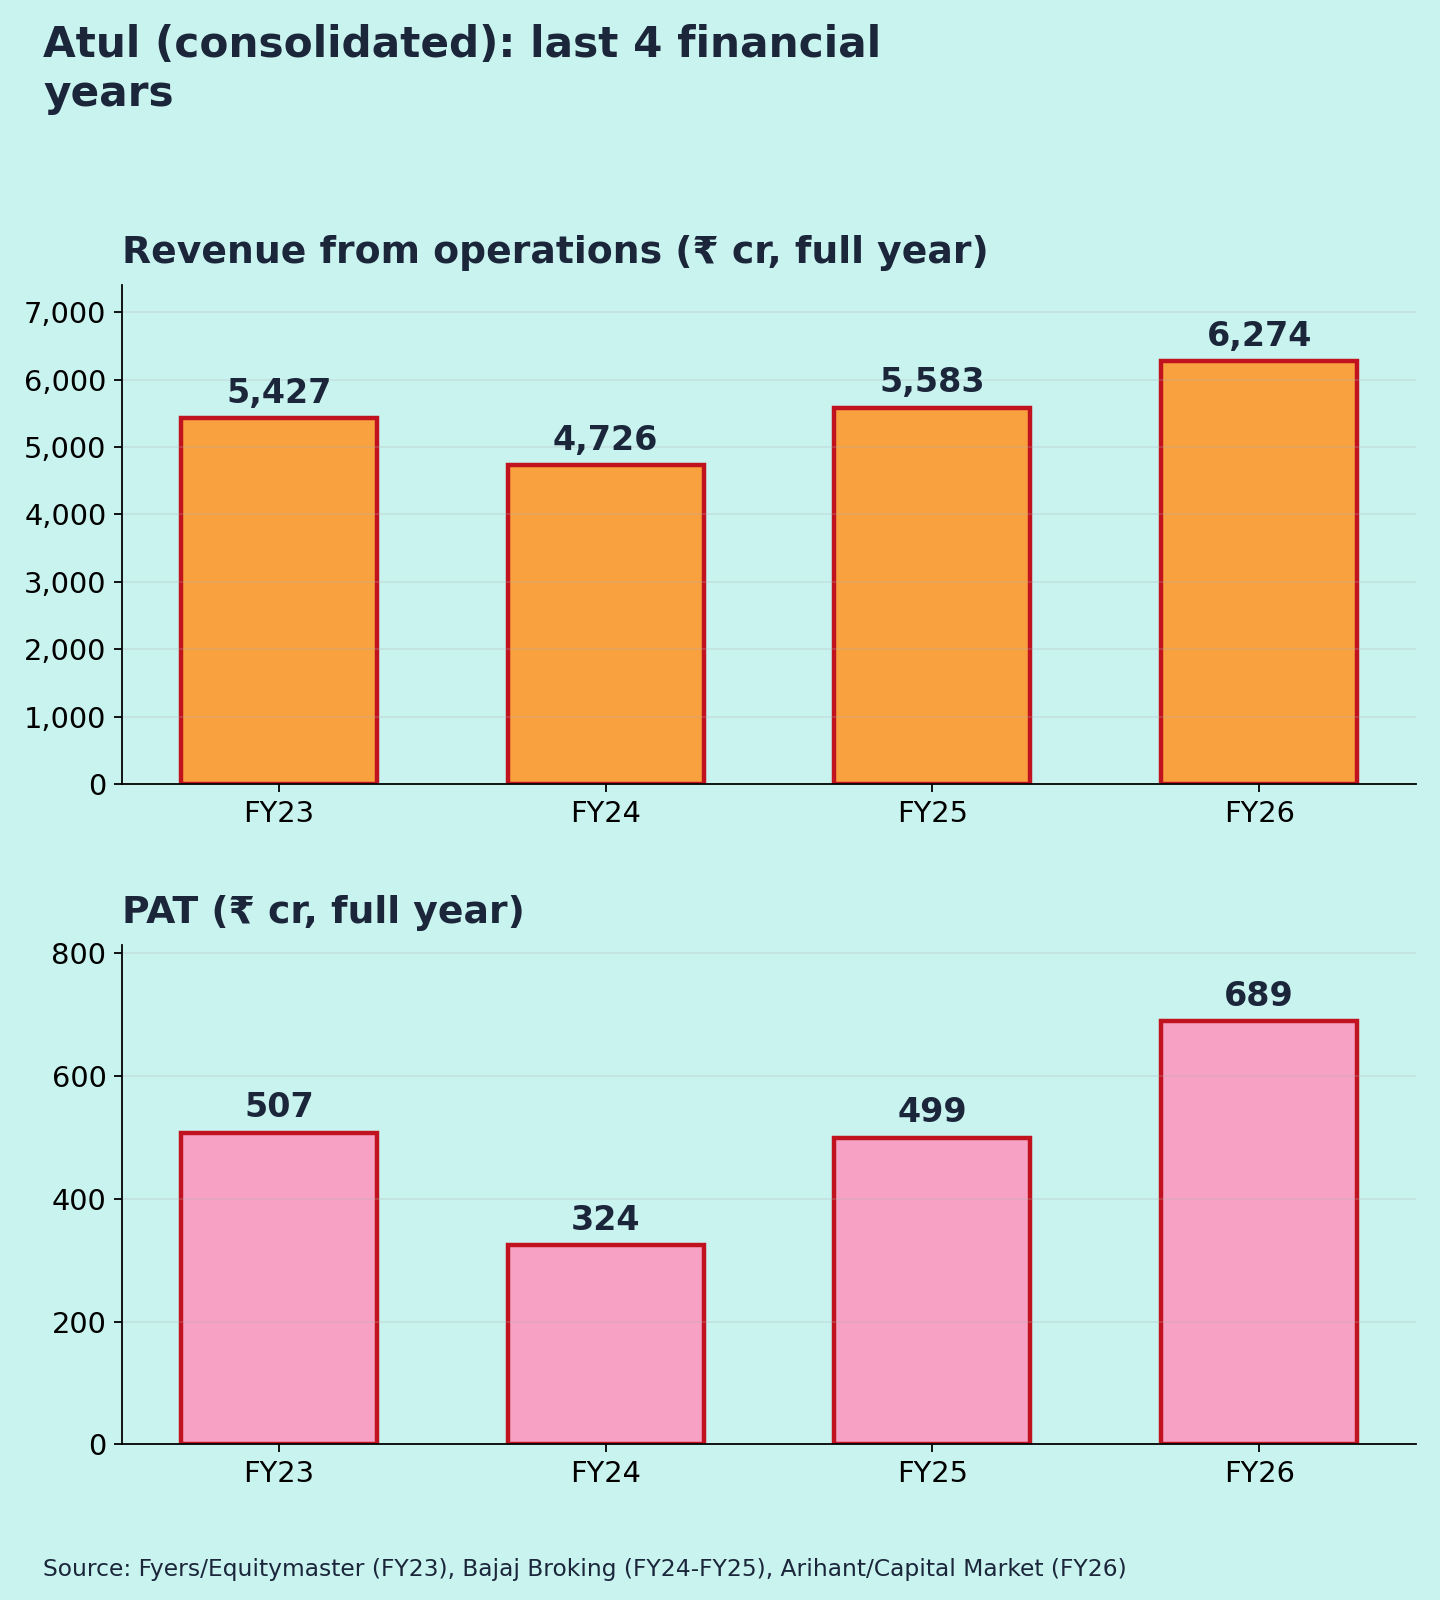
(2) FY23–FY26 revenue & PAT ;
(3) EBITDA margin (Q3 FY26 derived) and PAT margin (own calc.).